

Maximum Sats: The Bitcoin Bear Market Playbook | 1
Formerly "The Macro Analysis of Bitcoin and How You Can Financially Take Advantage"


By:
William Sanchez
Bitcoin. That thing you've probably heard about on the news when it's peak highs in price or “going to zero” at its cycle lows. But what is it? Well, since this isn't an article about Bitcoin and its history, let's keep it as sweet and simple as possible. Defined in a white paper on October 31, 2008 and created on January 3, 2009, by an unknown individual or group of people using the pseudonym Satoshi Nakamoto. Bitcoin is a digital currency, also known as a cryptocurrency, that uses blockchain technology. Blockchain technology is a decentralized, digital ledger that records transactions across a network of computers. The transactions are recorded in blocks, which are linked together to form a chain, hence the name "blockchain."
Each block contains a record of multiple transactions, and once a block is added to the chain, its data cannot be altered or deleted. This makes the blockchain highly secure and resistant to tampering. Each block also includes a unique code called a "hash," which is generated using complex algorithms and serves as a fingerprint for that block. The blockchain is maintained by a network of computers, also known as "nodes," which work together to validate new transactions and add them to the blockchain. This process is called "mining," and it is done through a consensus algorithm called "proof-of-work." Miners use powerful computers to solve complex mathematical equations and create new blocks, and in return, they are rewarded with newly minted bitcoins.
Bitcoin uses peer-to-peer technology to operate with no central authority: managing transactions and issuing money are carried out collectively by the network. Bitcoin is open-source; its design is public, nobody owns or controls Bitcoin and everyone can take part. Transactions are made with no middlemen aka no banks!
The halving is an event that occurs every 210,000 blocks, or roughly every four years. The block reward for mining new Bitcoin is cut in half. This is built into the Bitcoin protocol as a mechanism to control the rate at which new bitcoin are created and introduced into the market. The halving is designed to control the rate of inflation in the Bitcoin economy and to keep the value of the currency stable. By reducing the rate at which new Bitcoin are created, the halving ensures that the total supply of Bitcoin will never exceed 21 million, which is the maximum number of Bitcoin that can ever be created. As the block reward decreases, the mining becomes more difficult and it becomes harder to mine new Bitcoin. When Bitcoin was first created, the block reward was 50 Bitcoin. After the first halving, it dropped to 25 Bitcoin. After the second halving in 2016, it dropped to 12.5 Bitcoin, and after the third halving in May 2020, the block reward is 6.25 Bitcoin. The next halving is expected to occur around the end of March 2024.
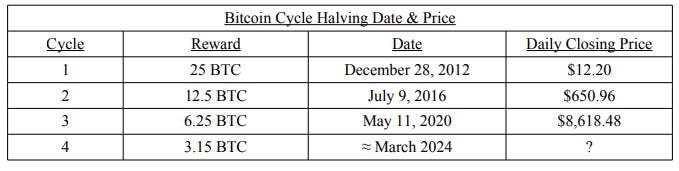
As you can see, the price of Bitcoin historically has increased significantly each halving. But now that we have built some background knowledge of Bitcoin, let us dive into how you can take advantage of investing in it from a technical analysis perspective using extremely simple methods.
The most commonly used fib ratios include 23.6%, 38.2%, 50%, 61.8%, 78.6%, and 100%. Additionally, some traders use Fibonacci levels derived from the golden ratio, such as 88.6%. In my trading experience here is why this level plays a critical step from a Bitcoin investing perspective.
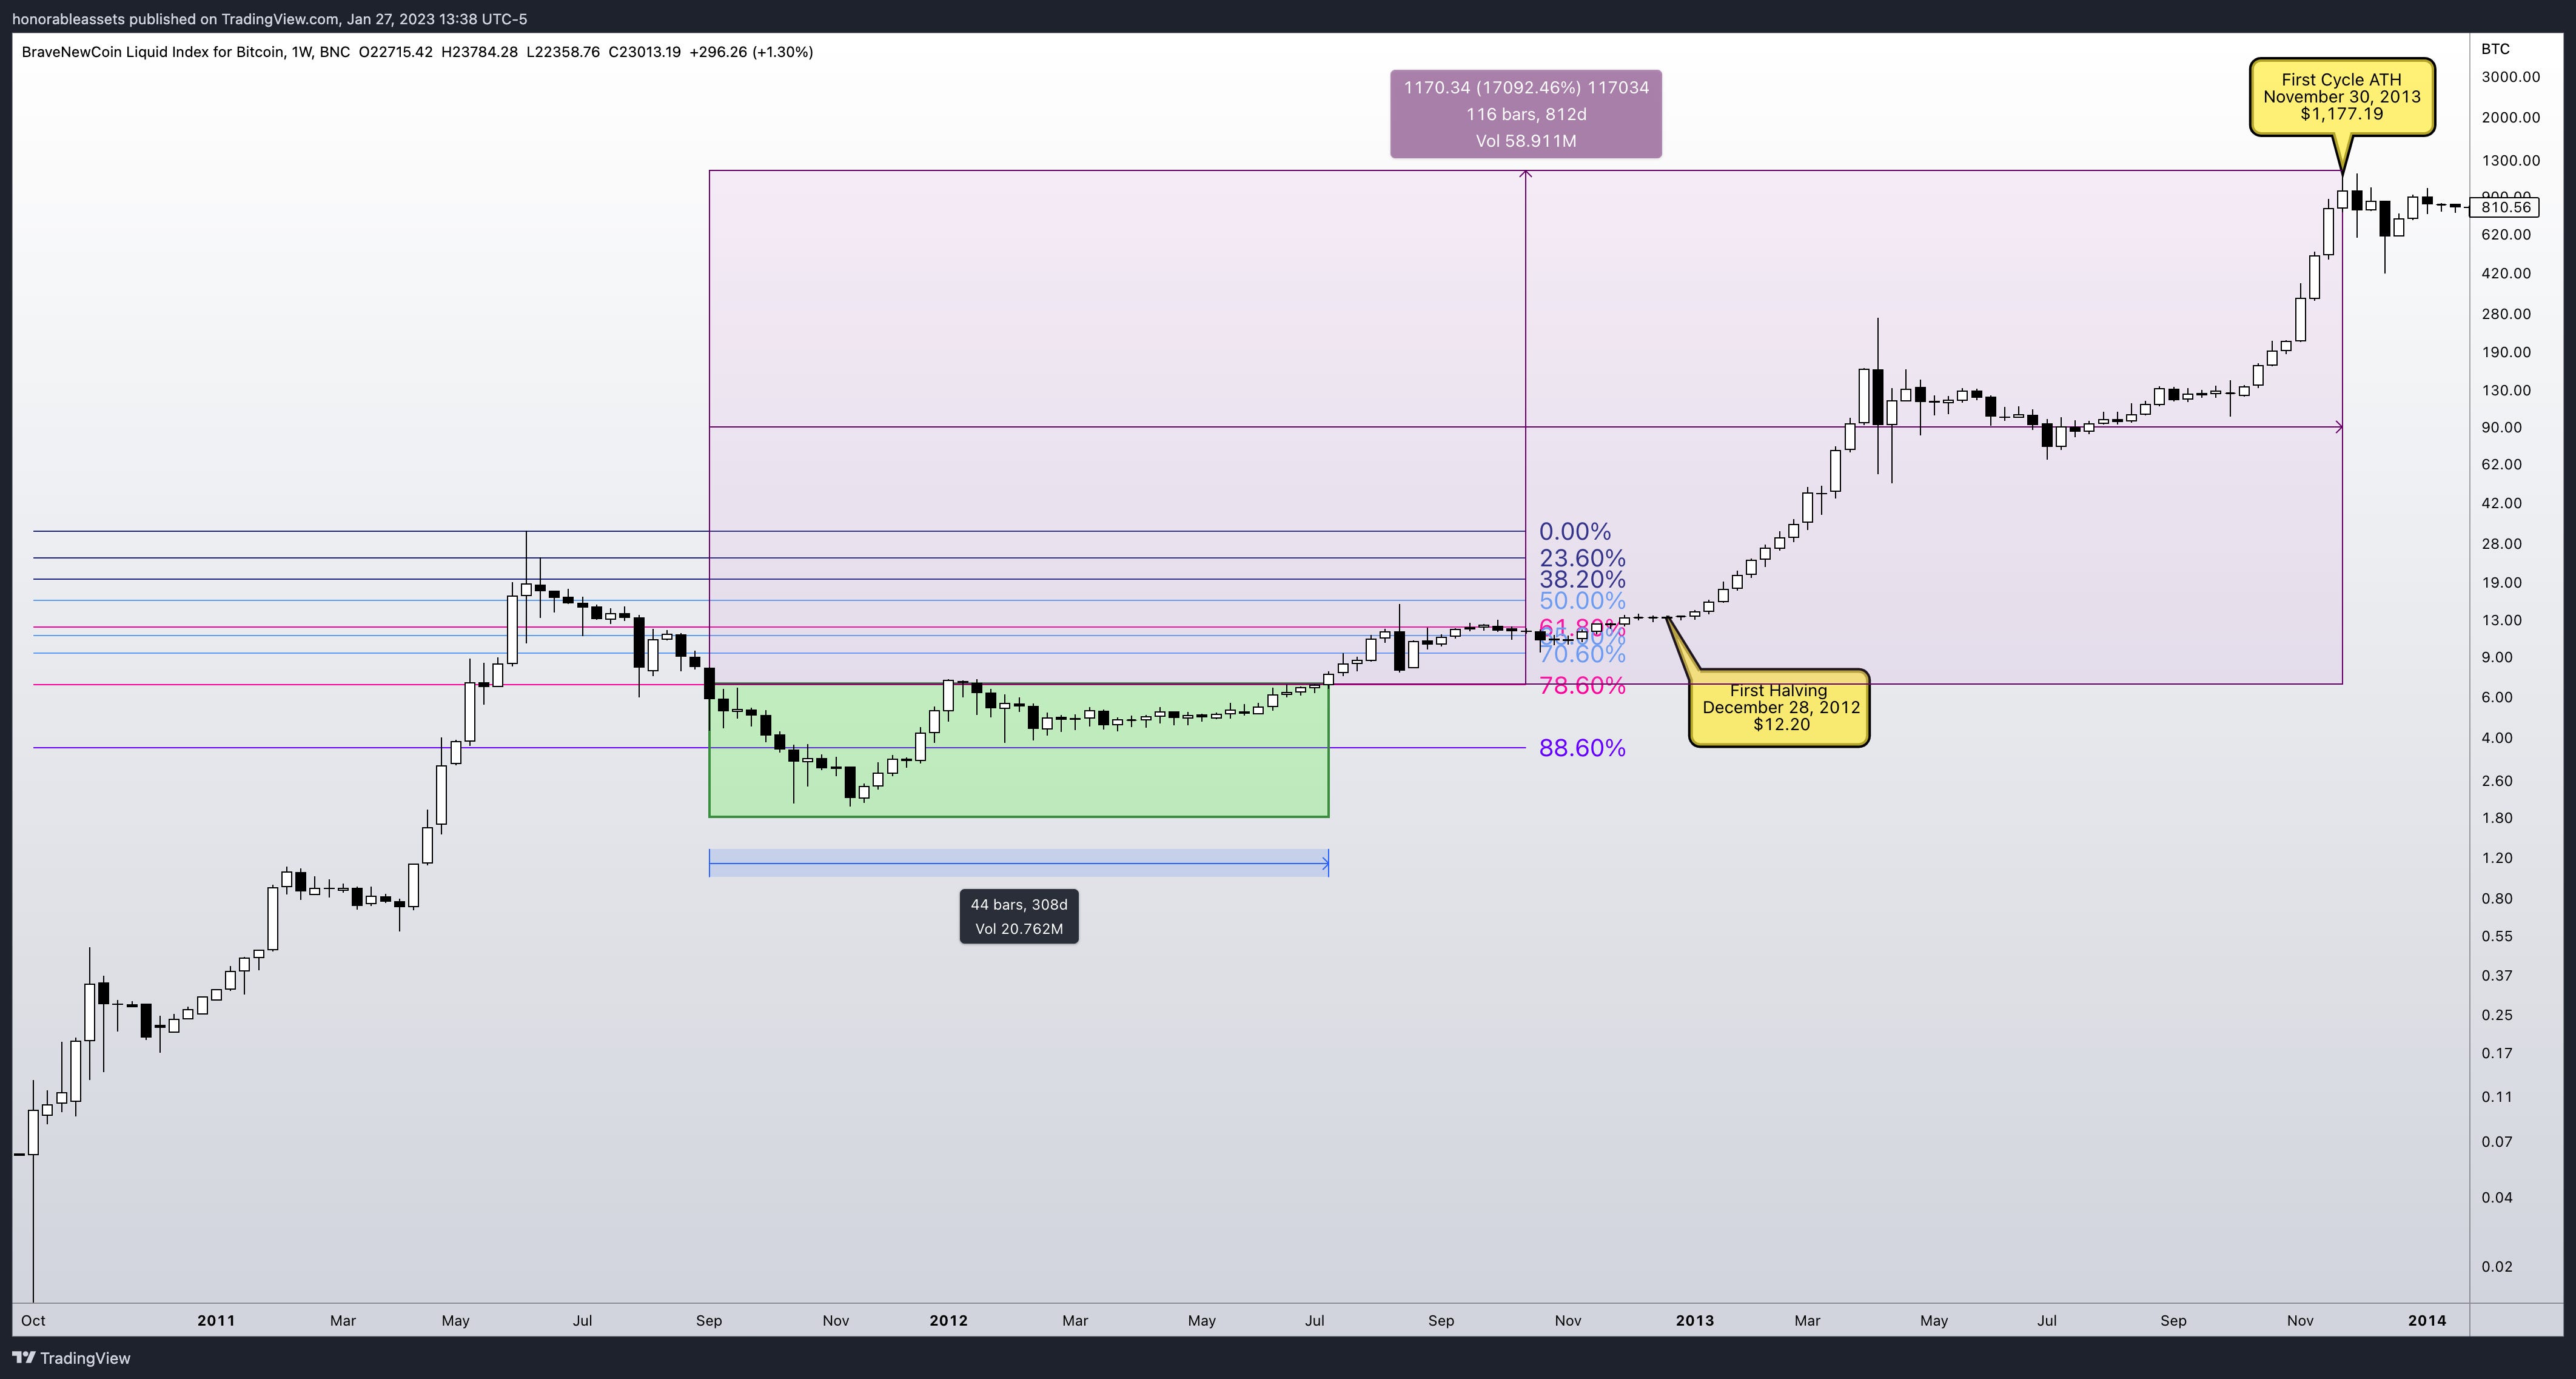
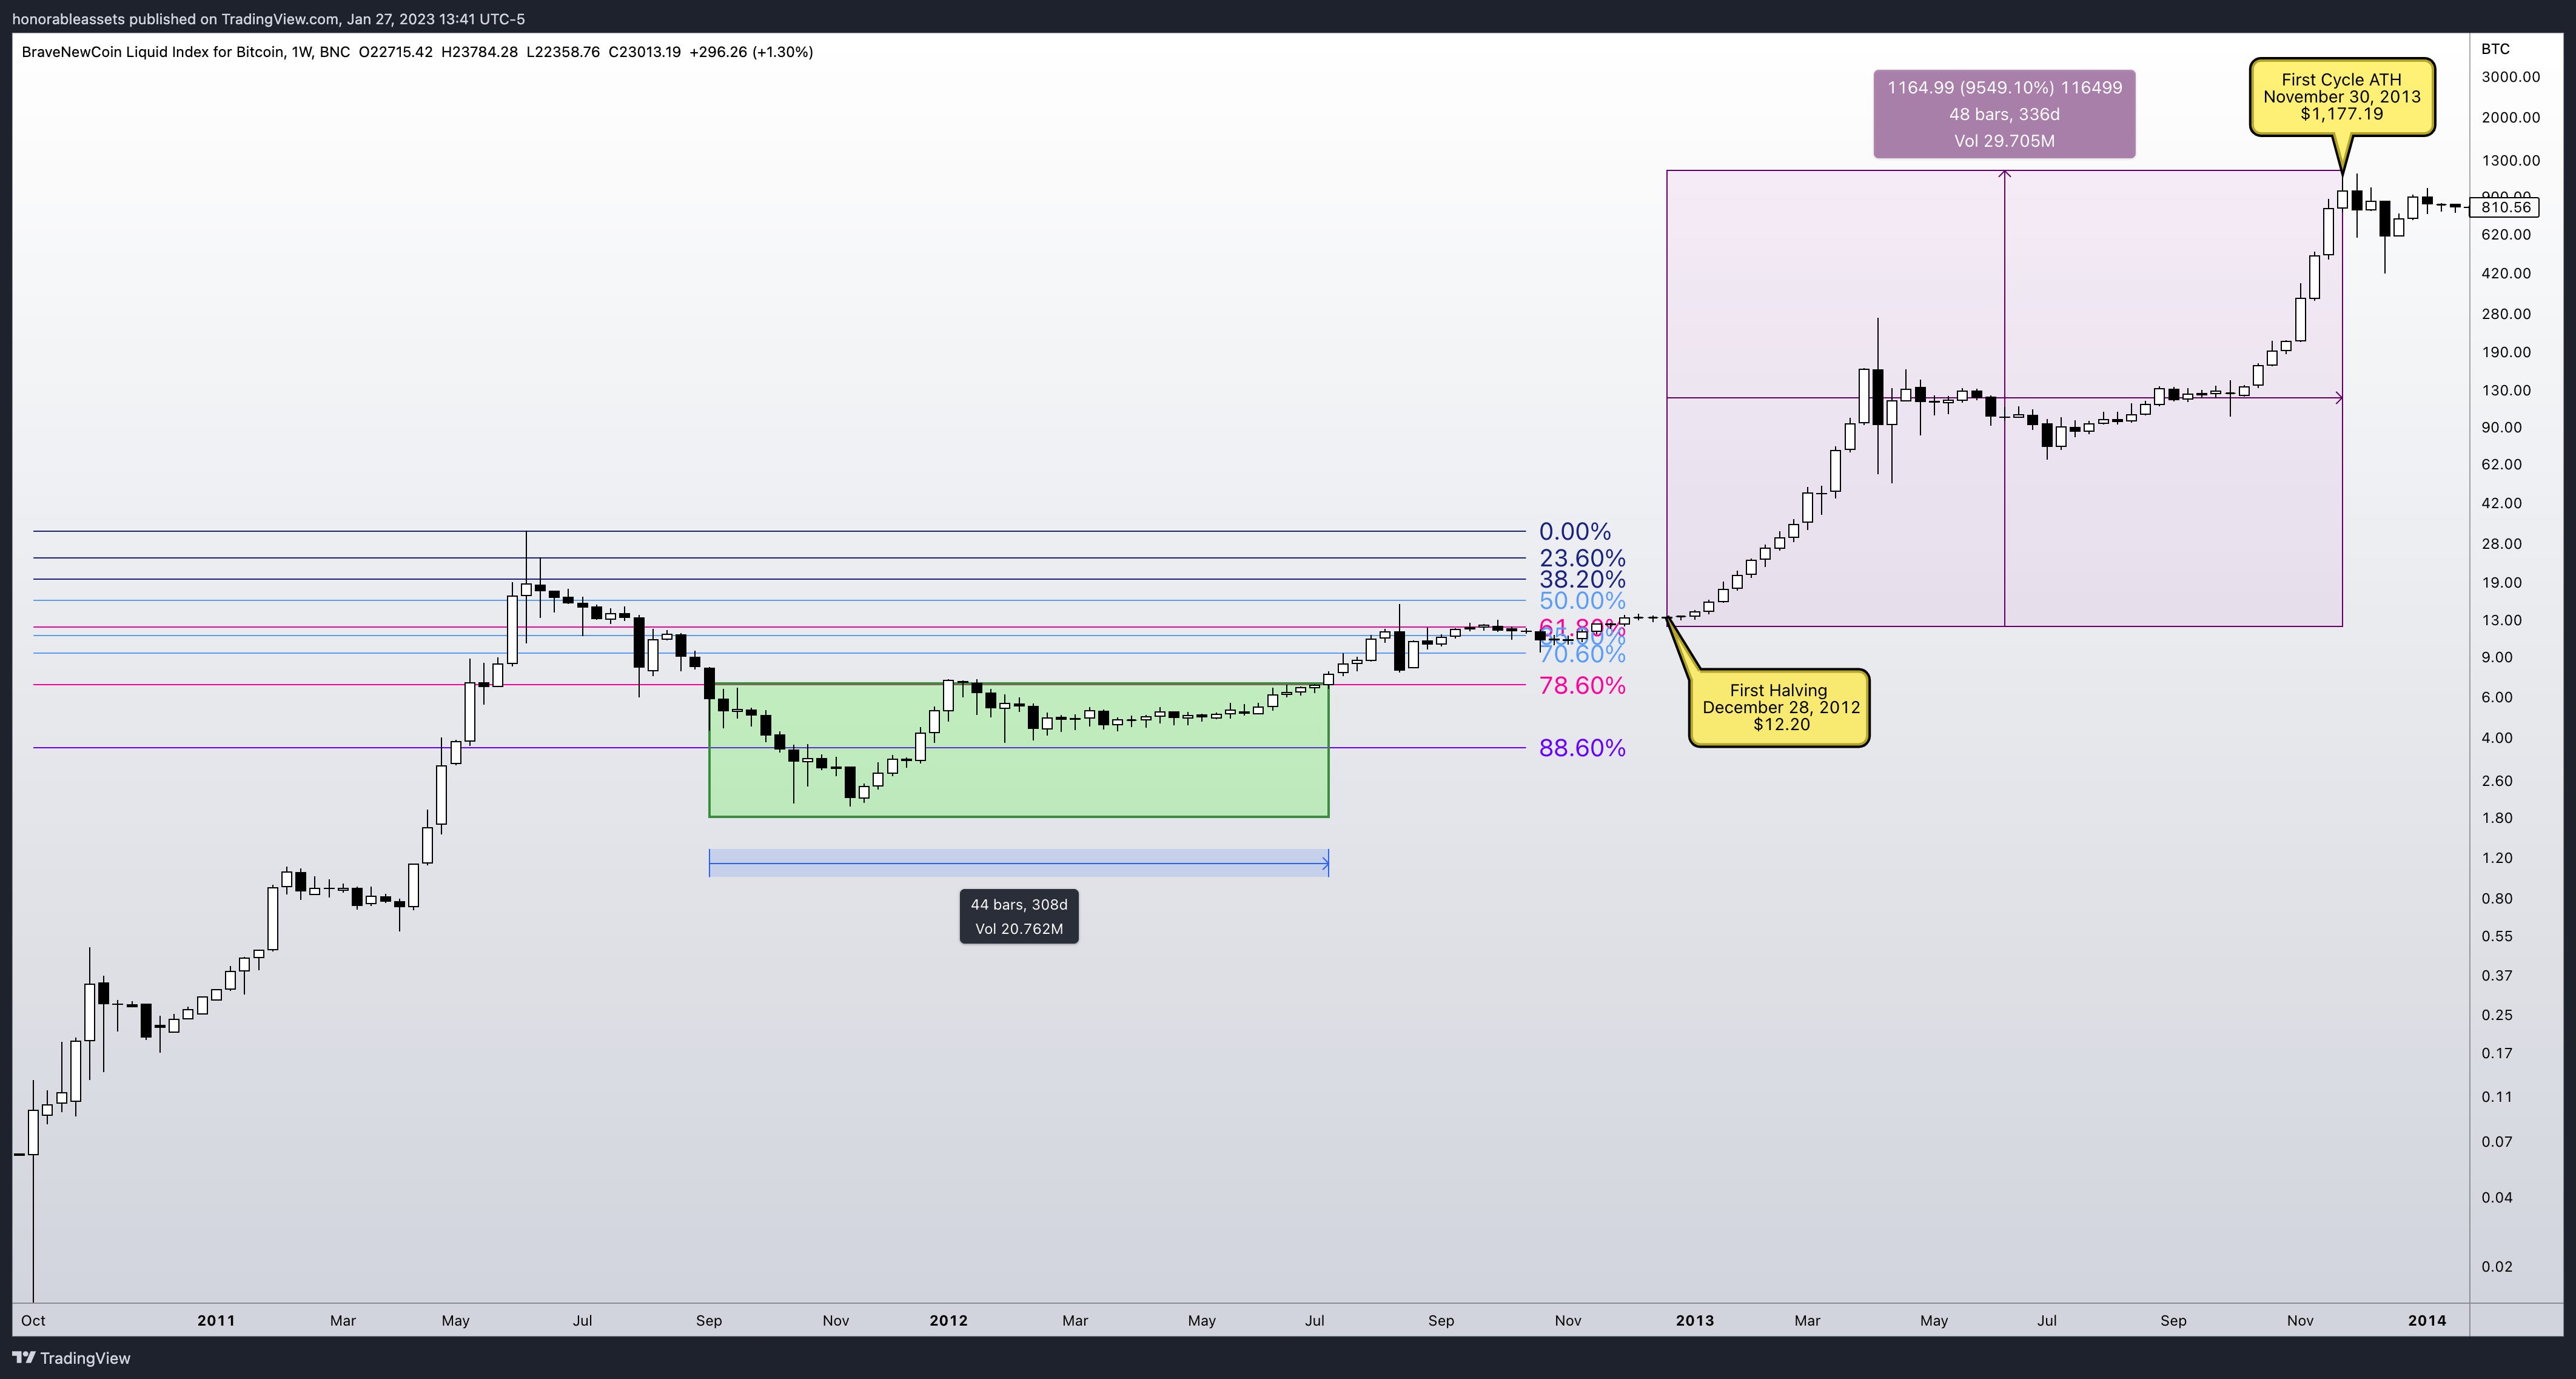
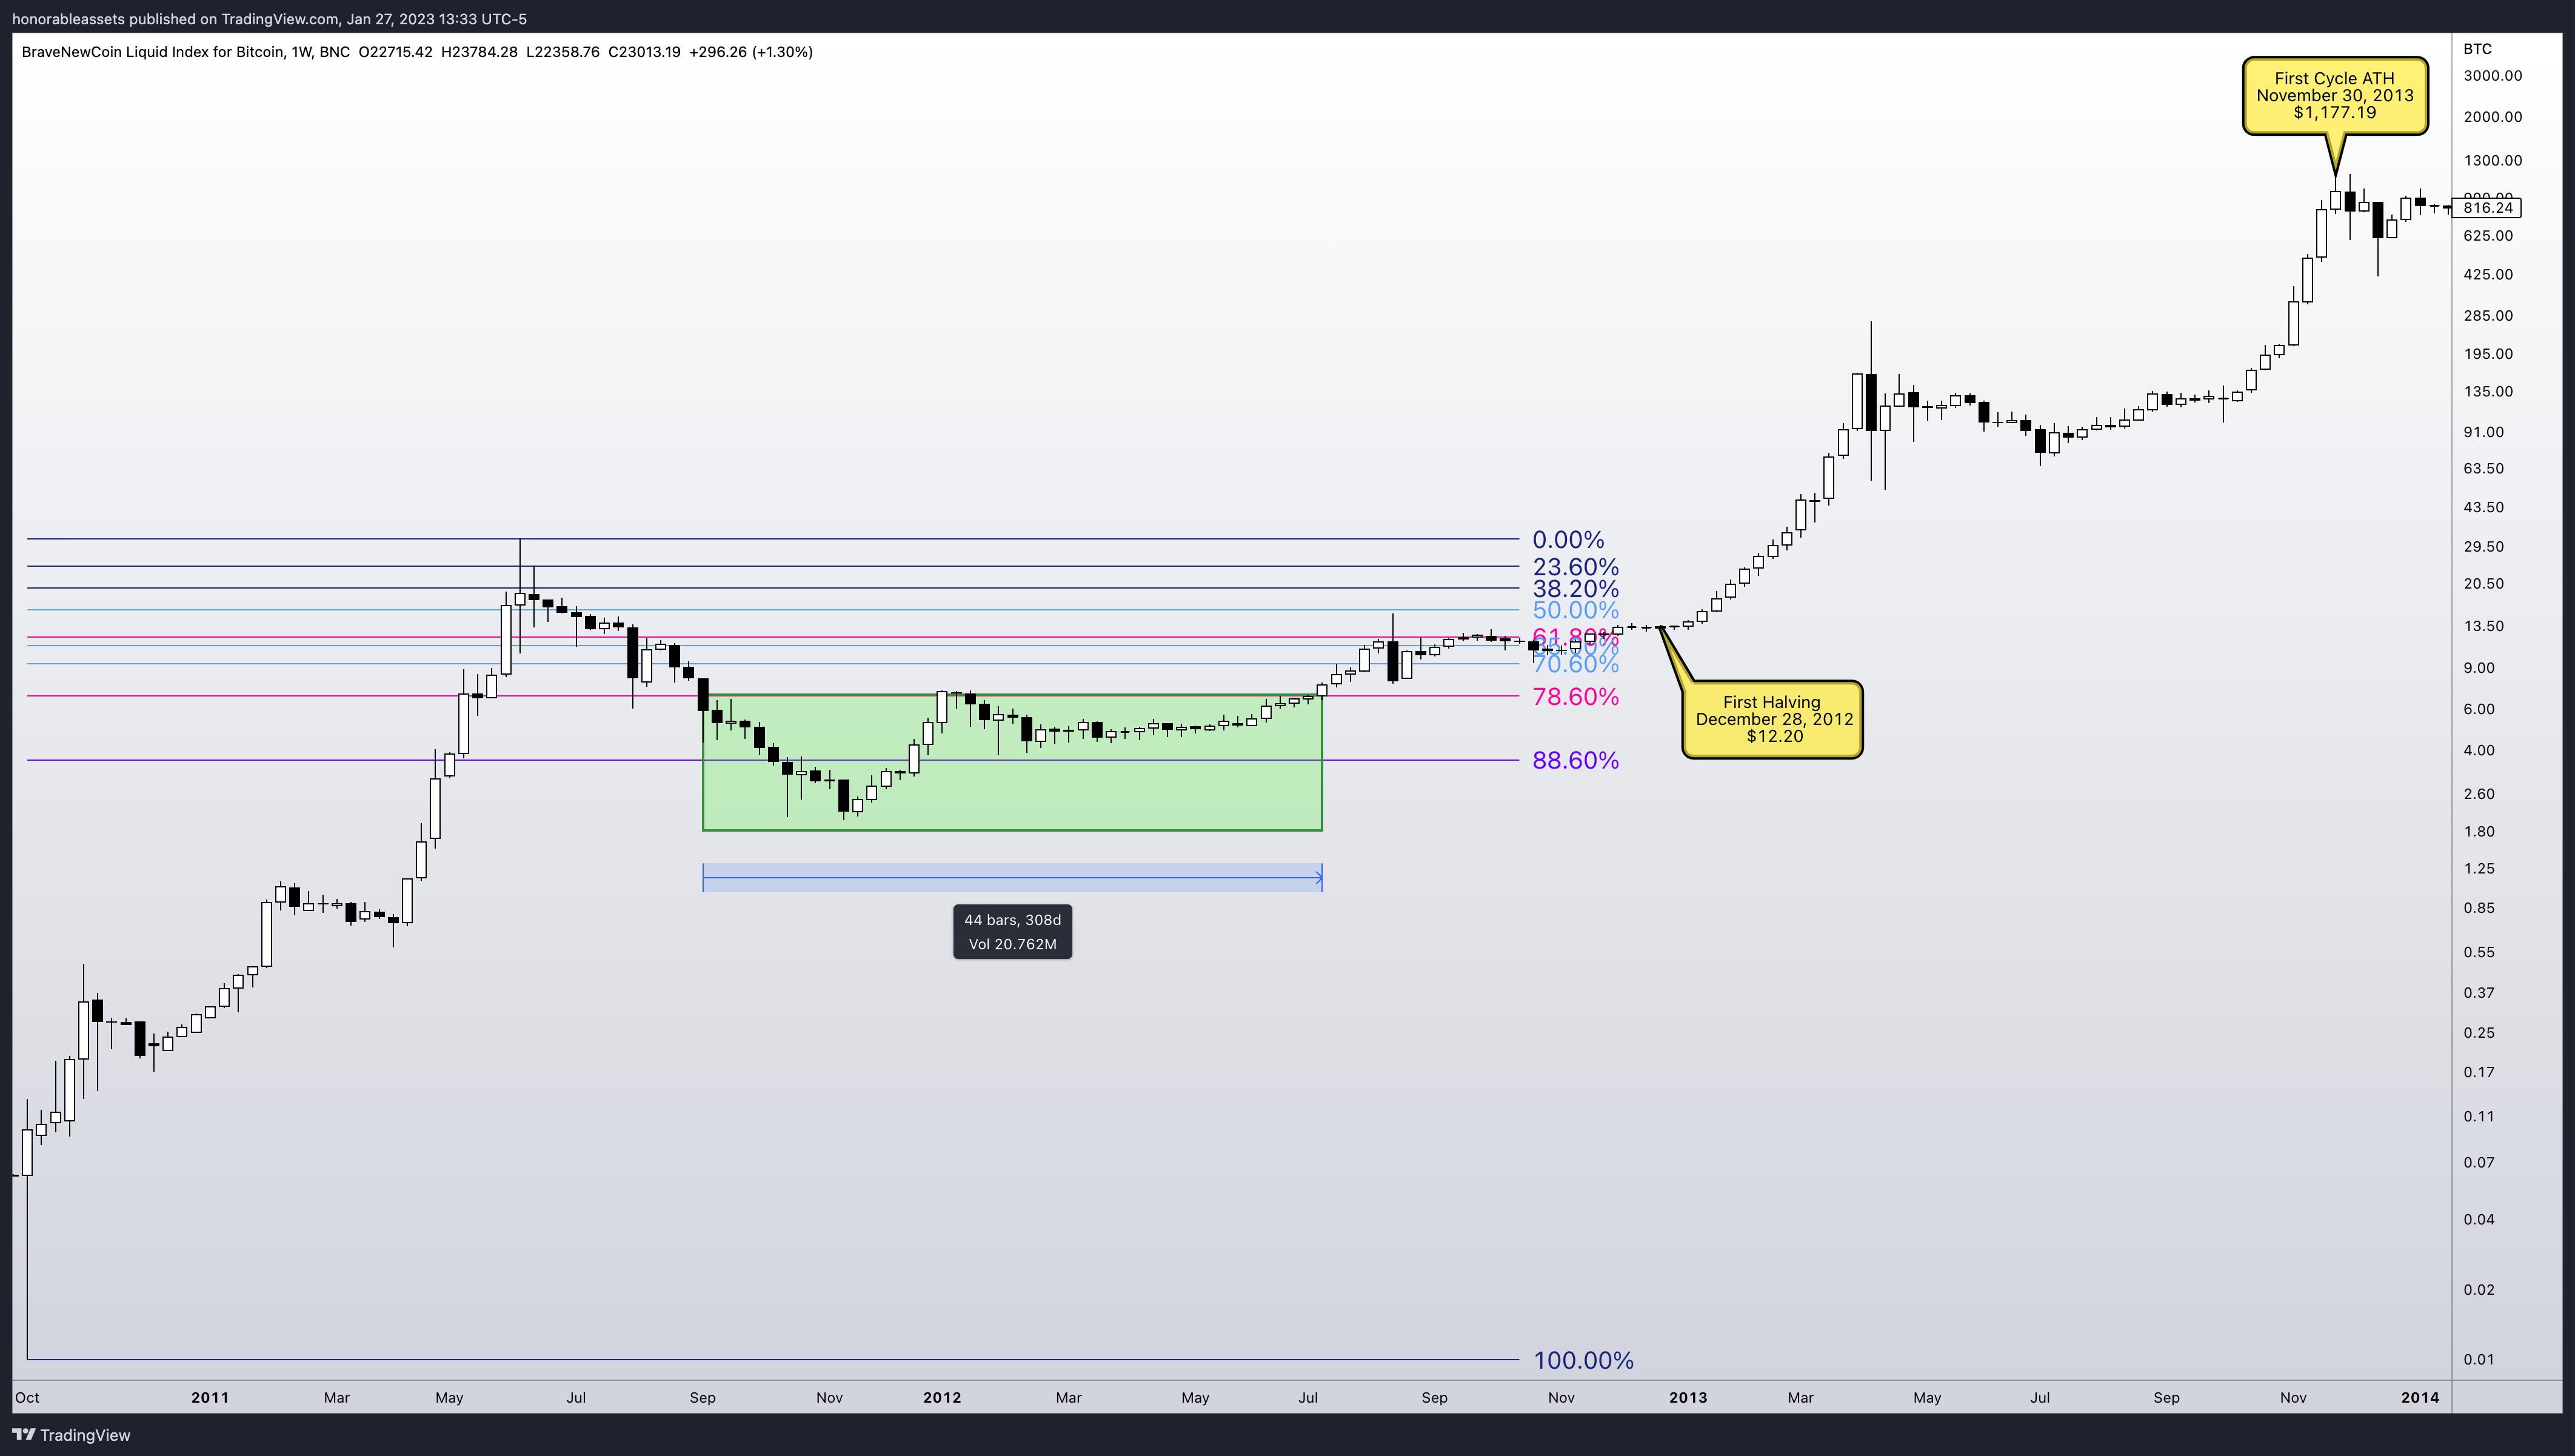
Above is the chart 1.1 covering BTC price action of the first halving cycle. Since we are looking at the buying possibilites, unless noted we are setting our fibs from lows to highs. The best buying opportunites came once we reached that green box in between the 78.6% - 88.6% levels and you will see how Bitcoin stays tried and true when it comes to this certain fib level (as of now). Once we break that 78.6% we are in 88.6% property and without a doubt in my mind is the best time for long term cold storage buys. Price stayed in this fib zone for a whopping 308 days. That's 308 chances to “buy the dip” and fatten up those cold storage wallets. You can also see how after the halving, price just skyrockets. In total with the worst case scenario investment at the start of that level, you would have seen a return of 17,092.46%. Not a bad return for being the early bird who got the worm.
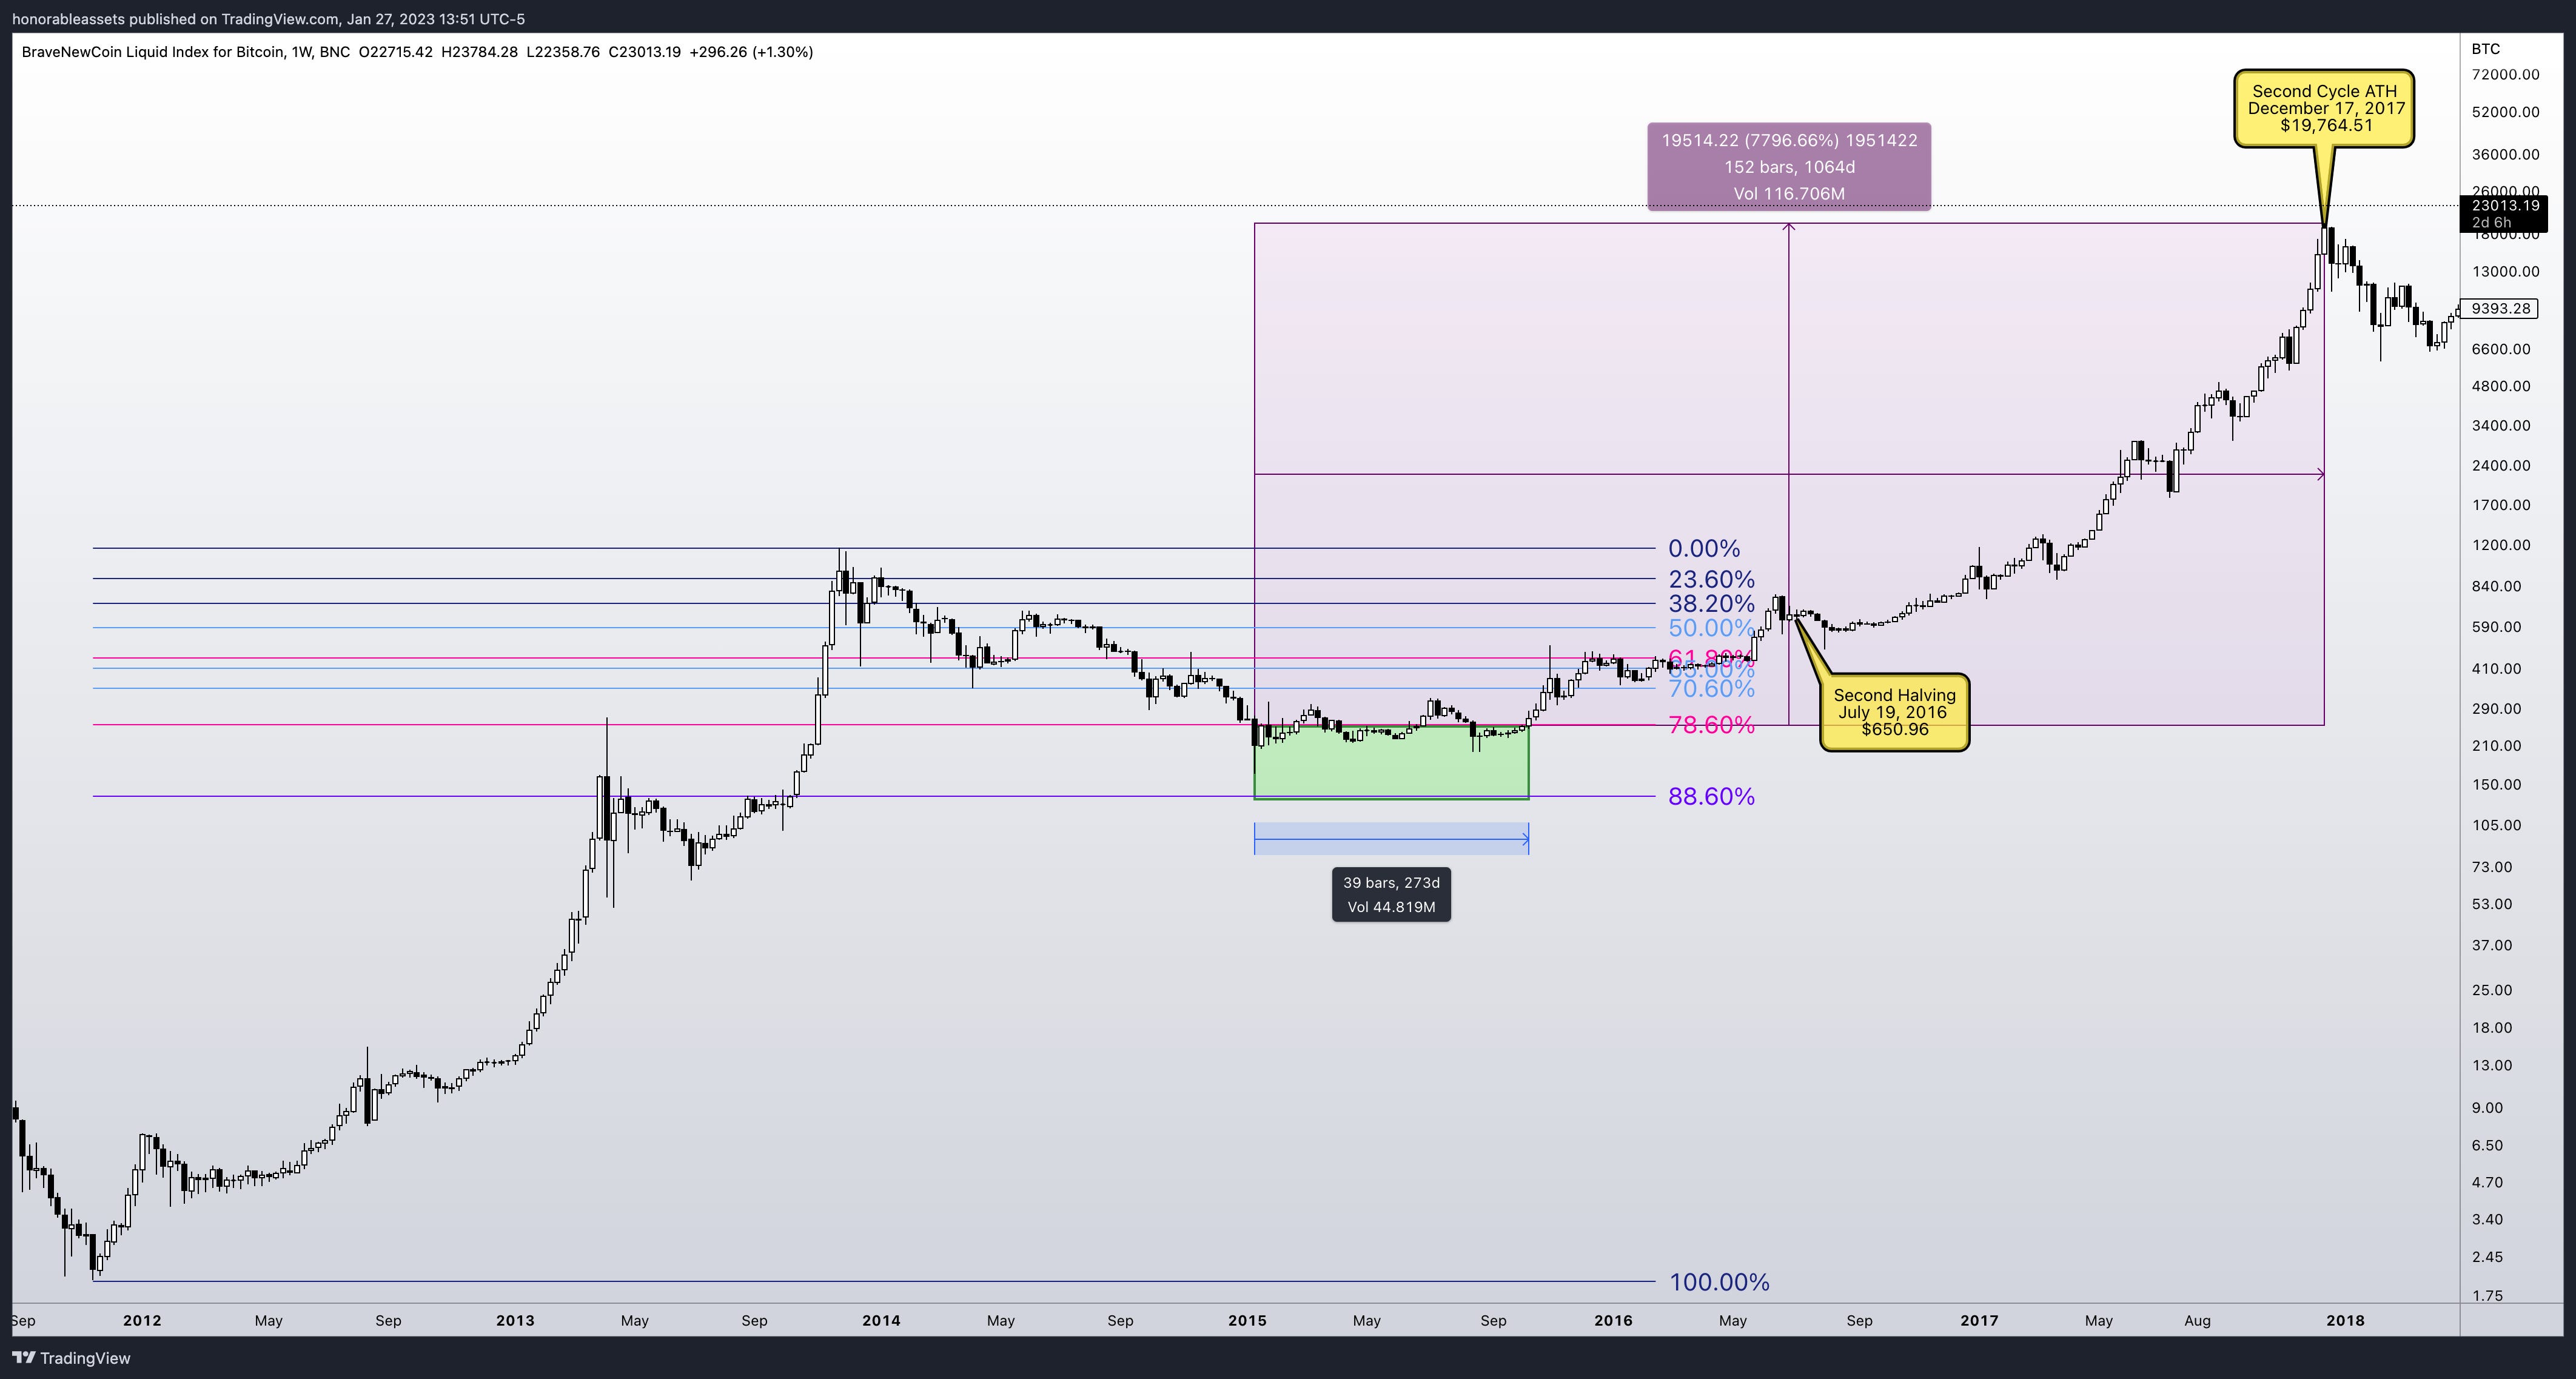
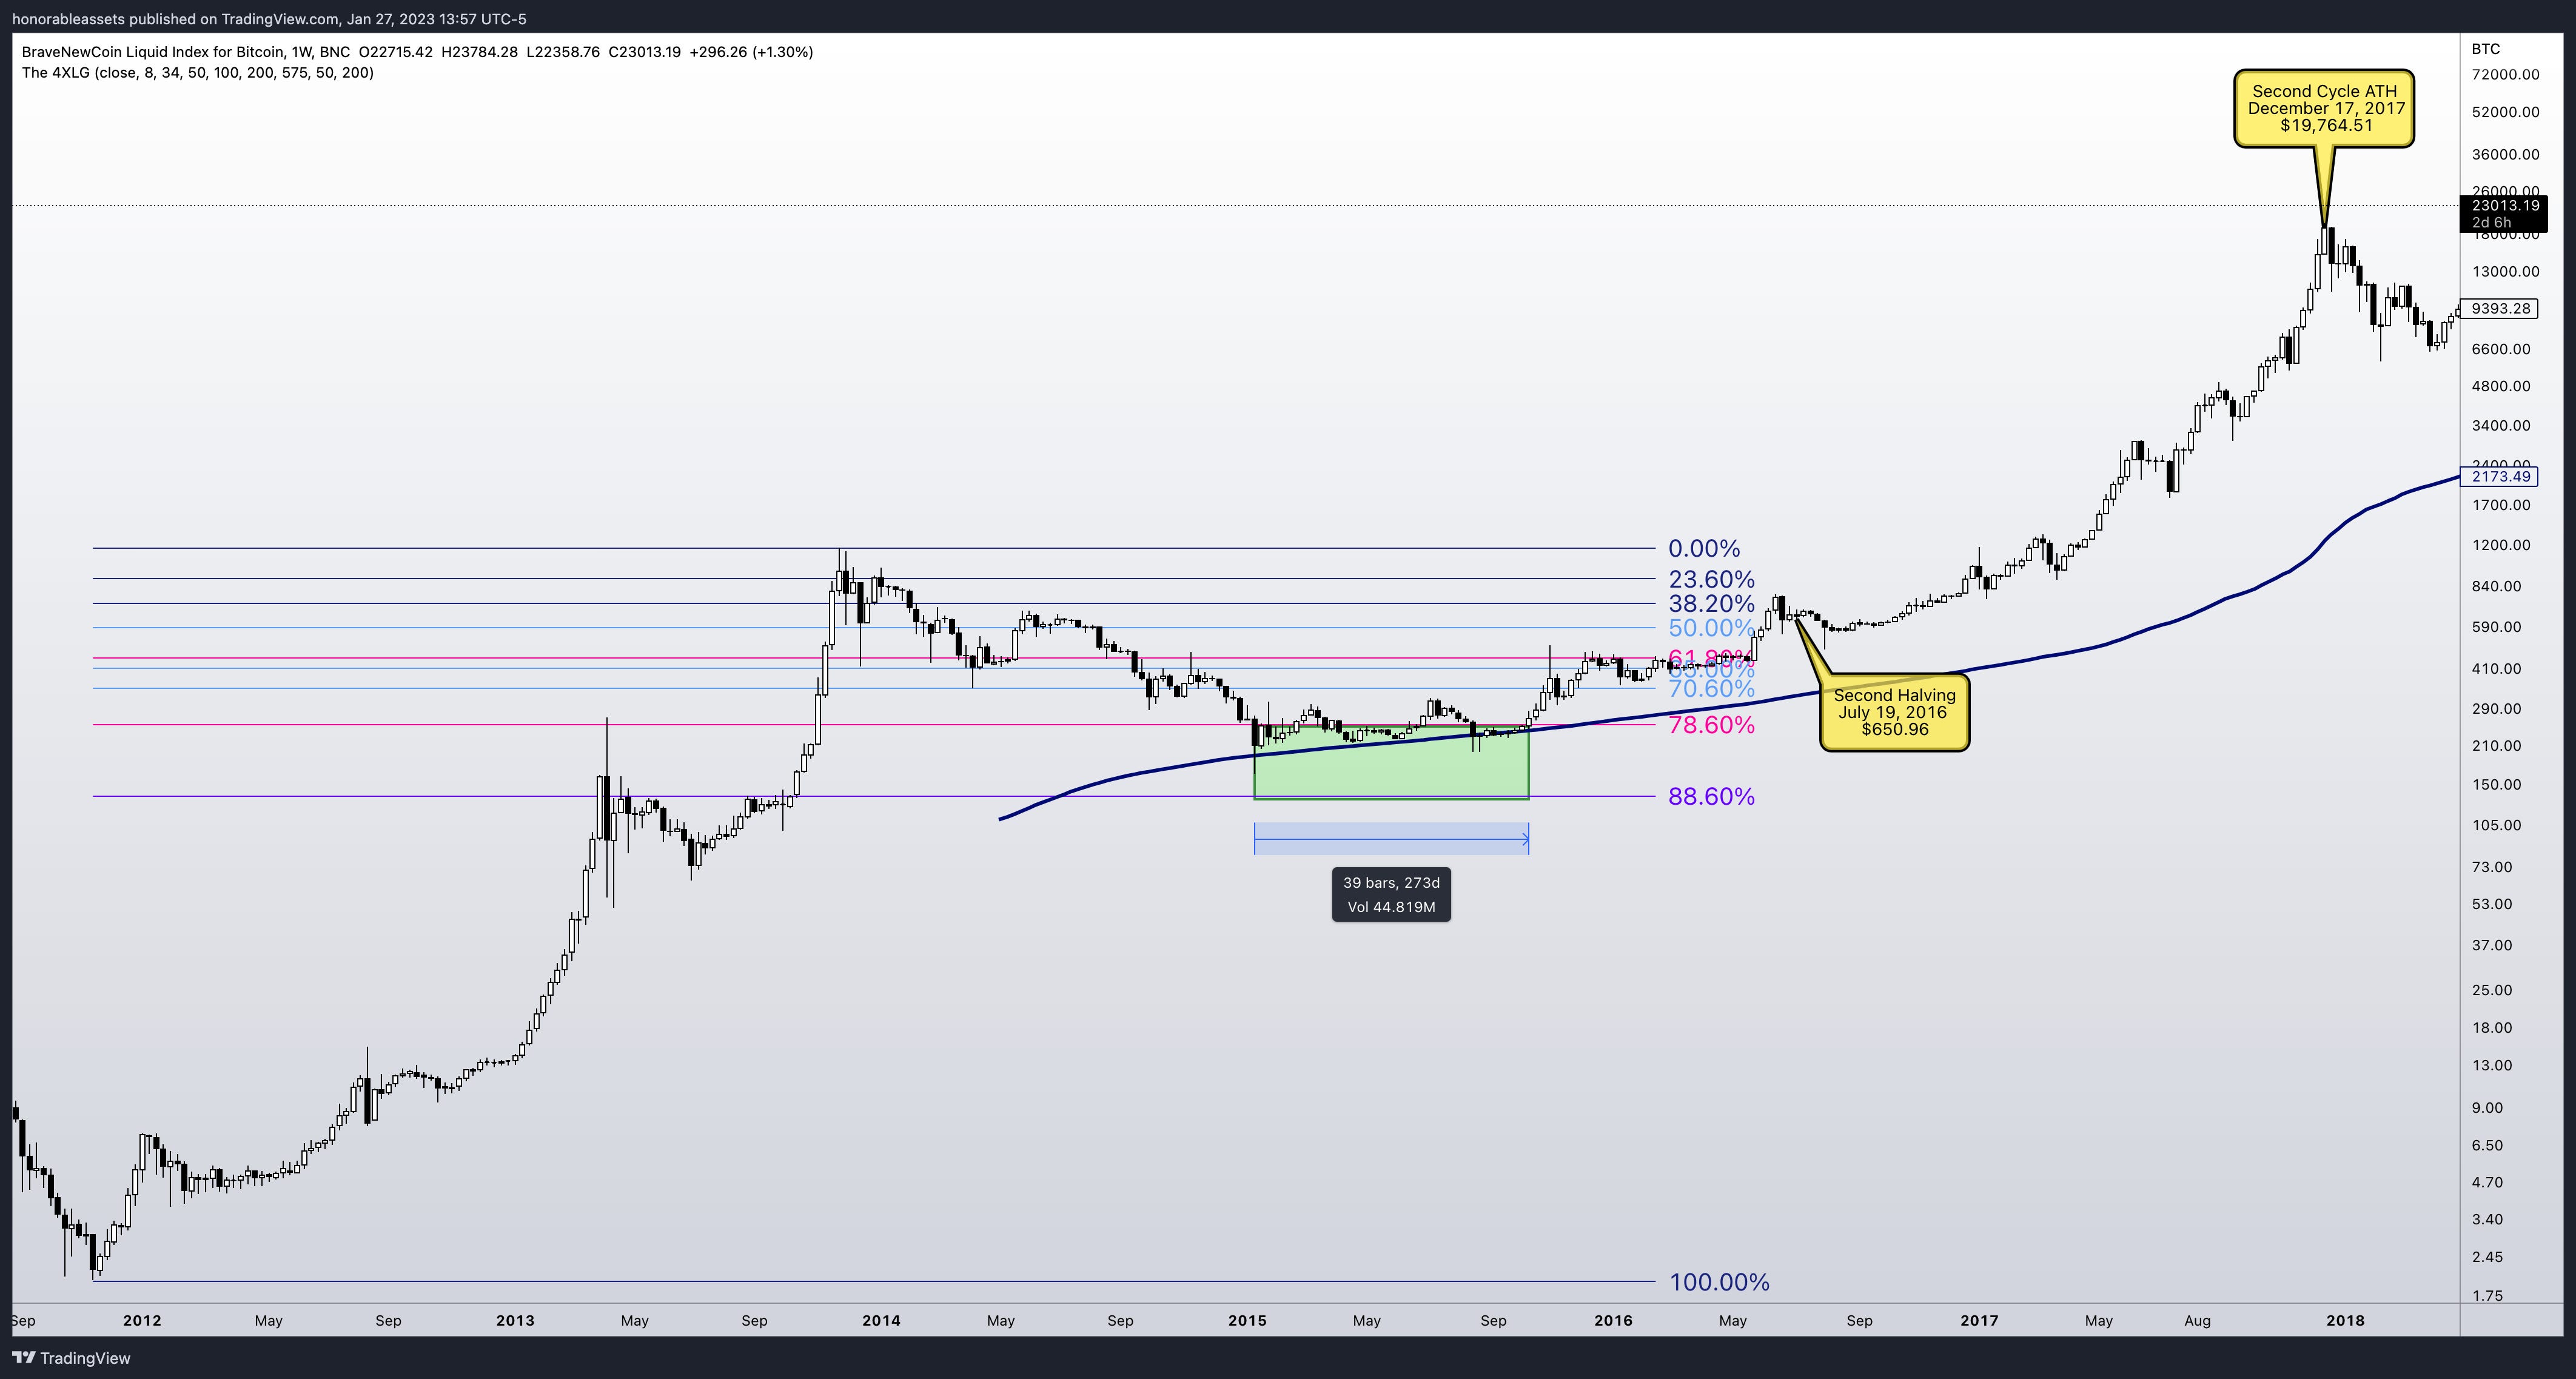
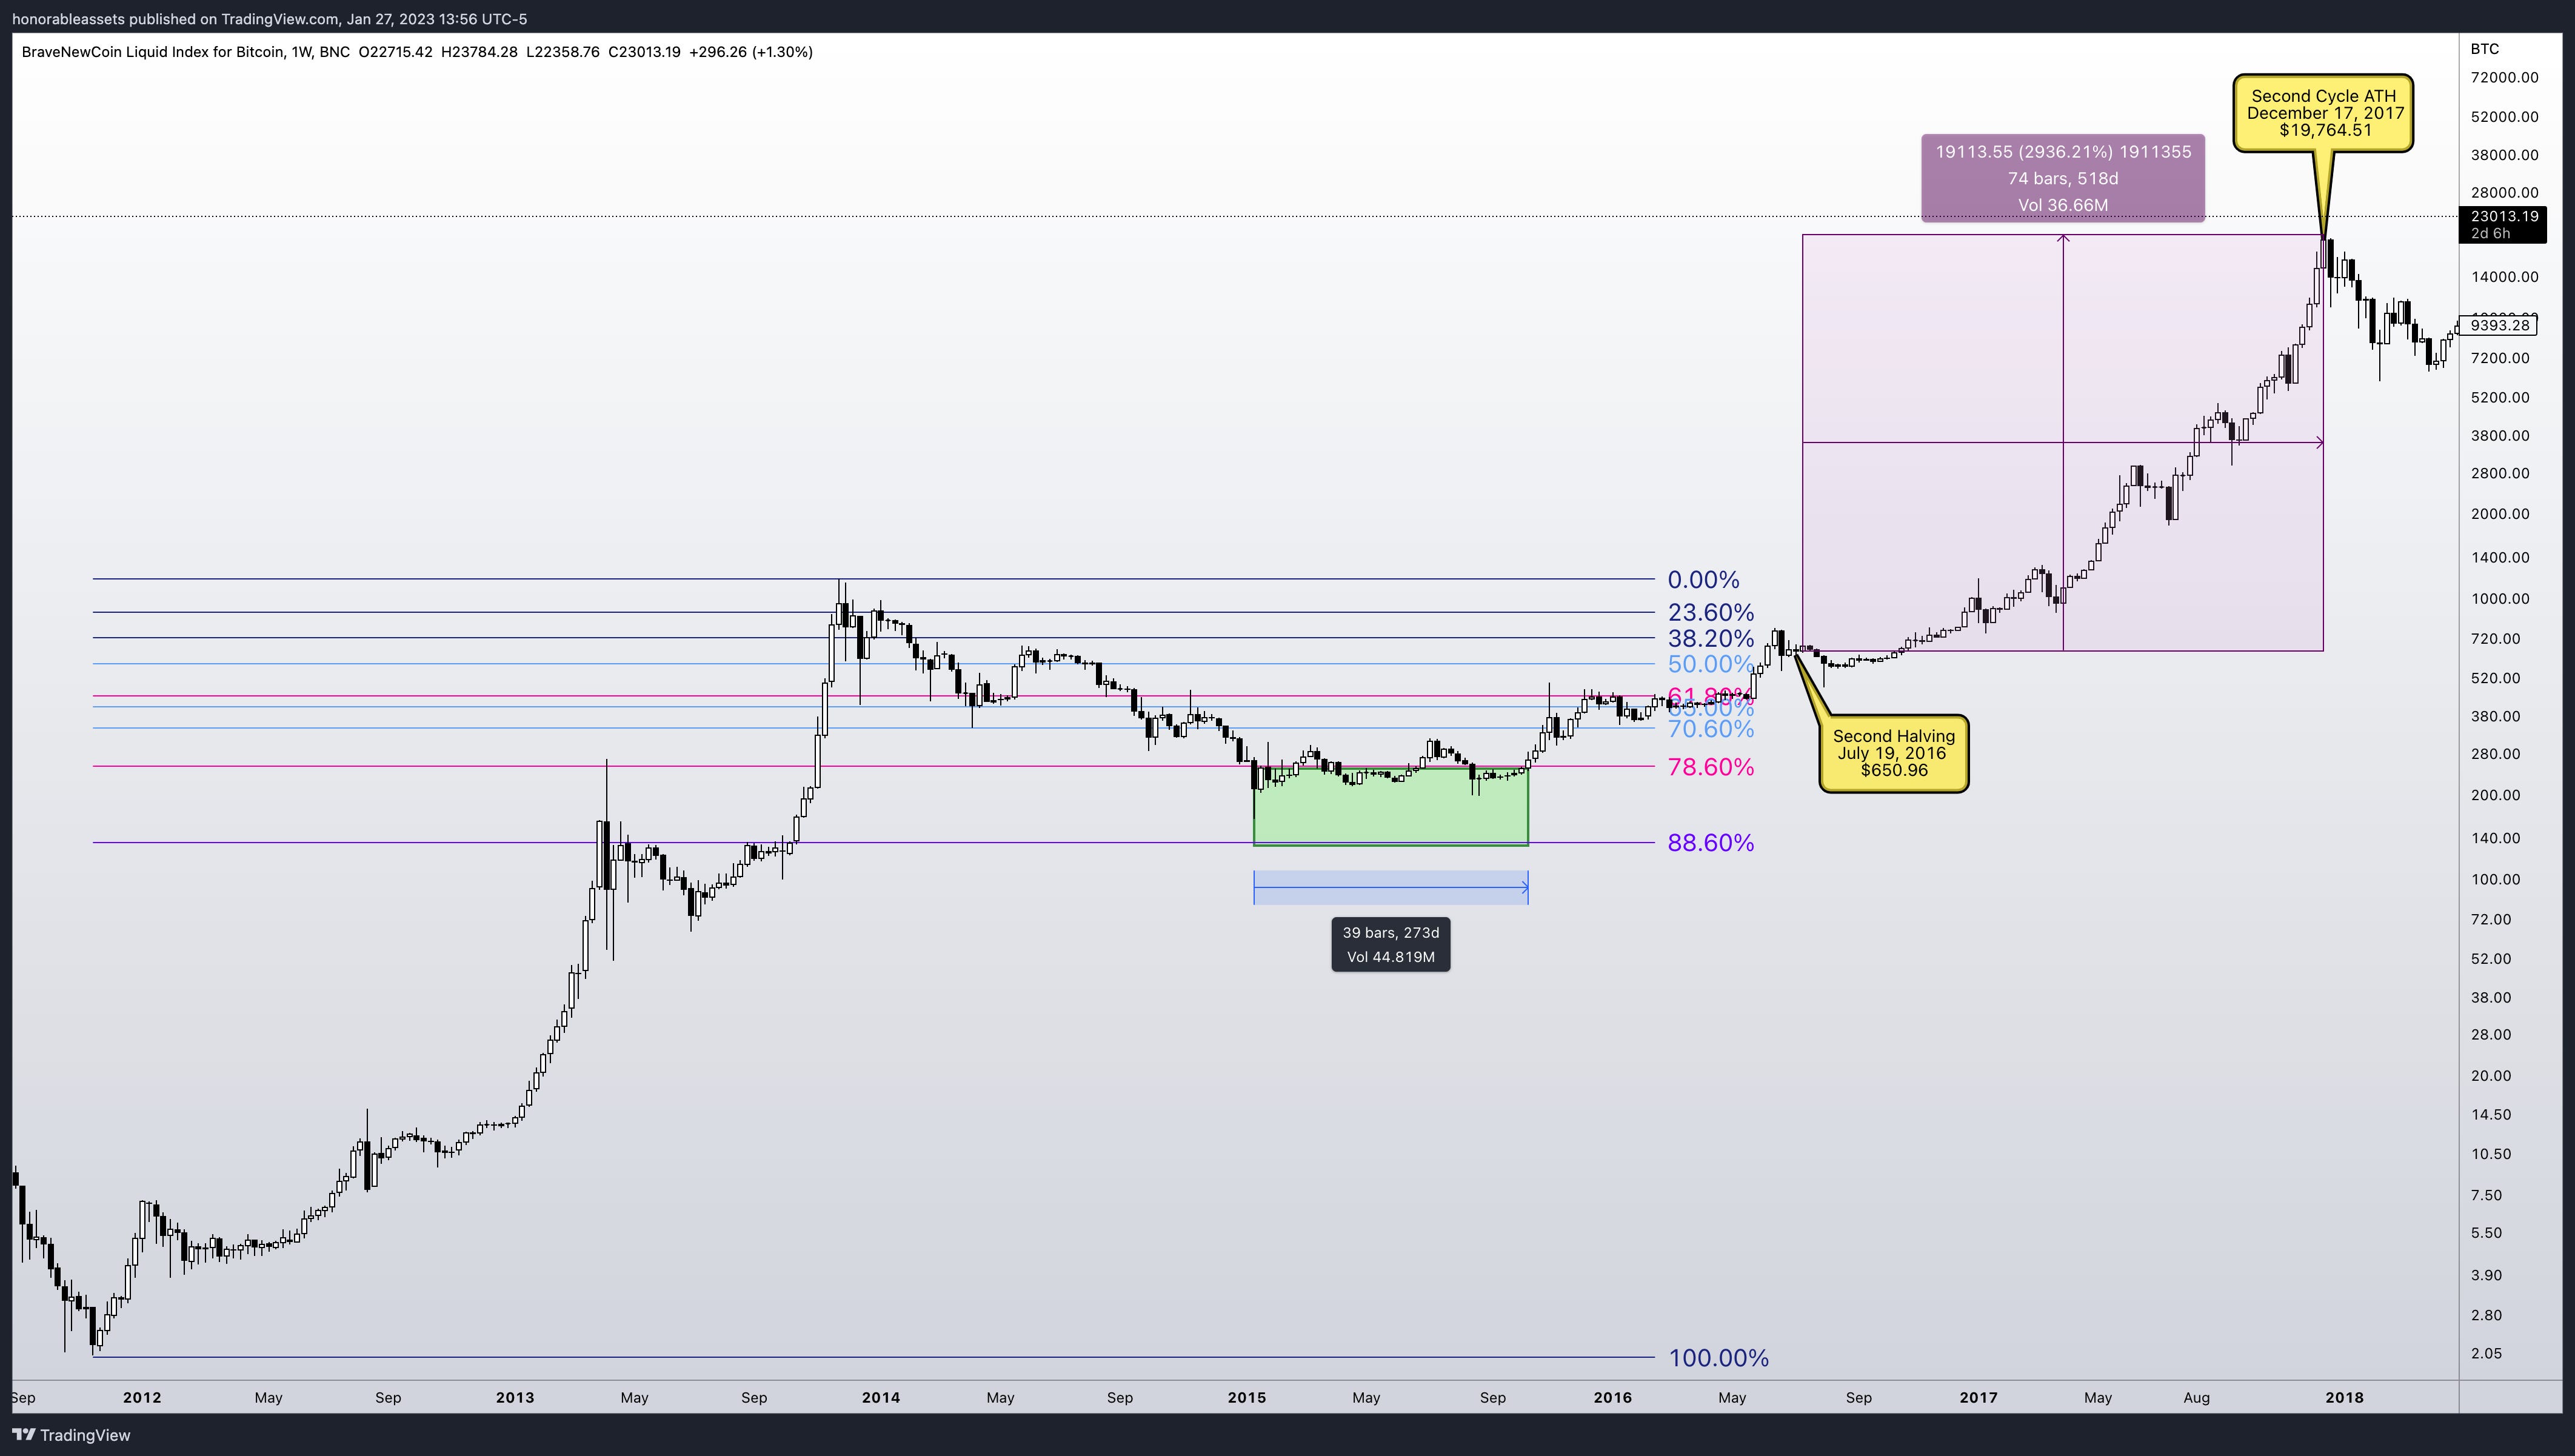
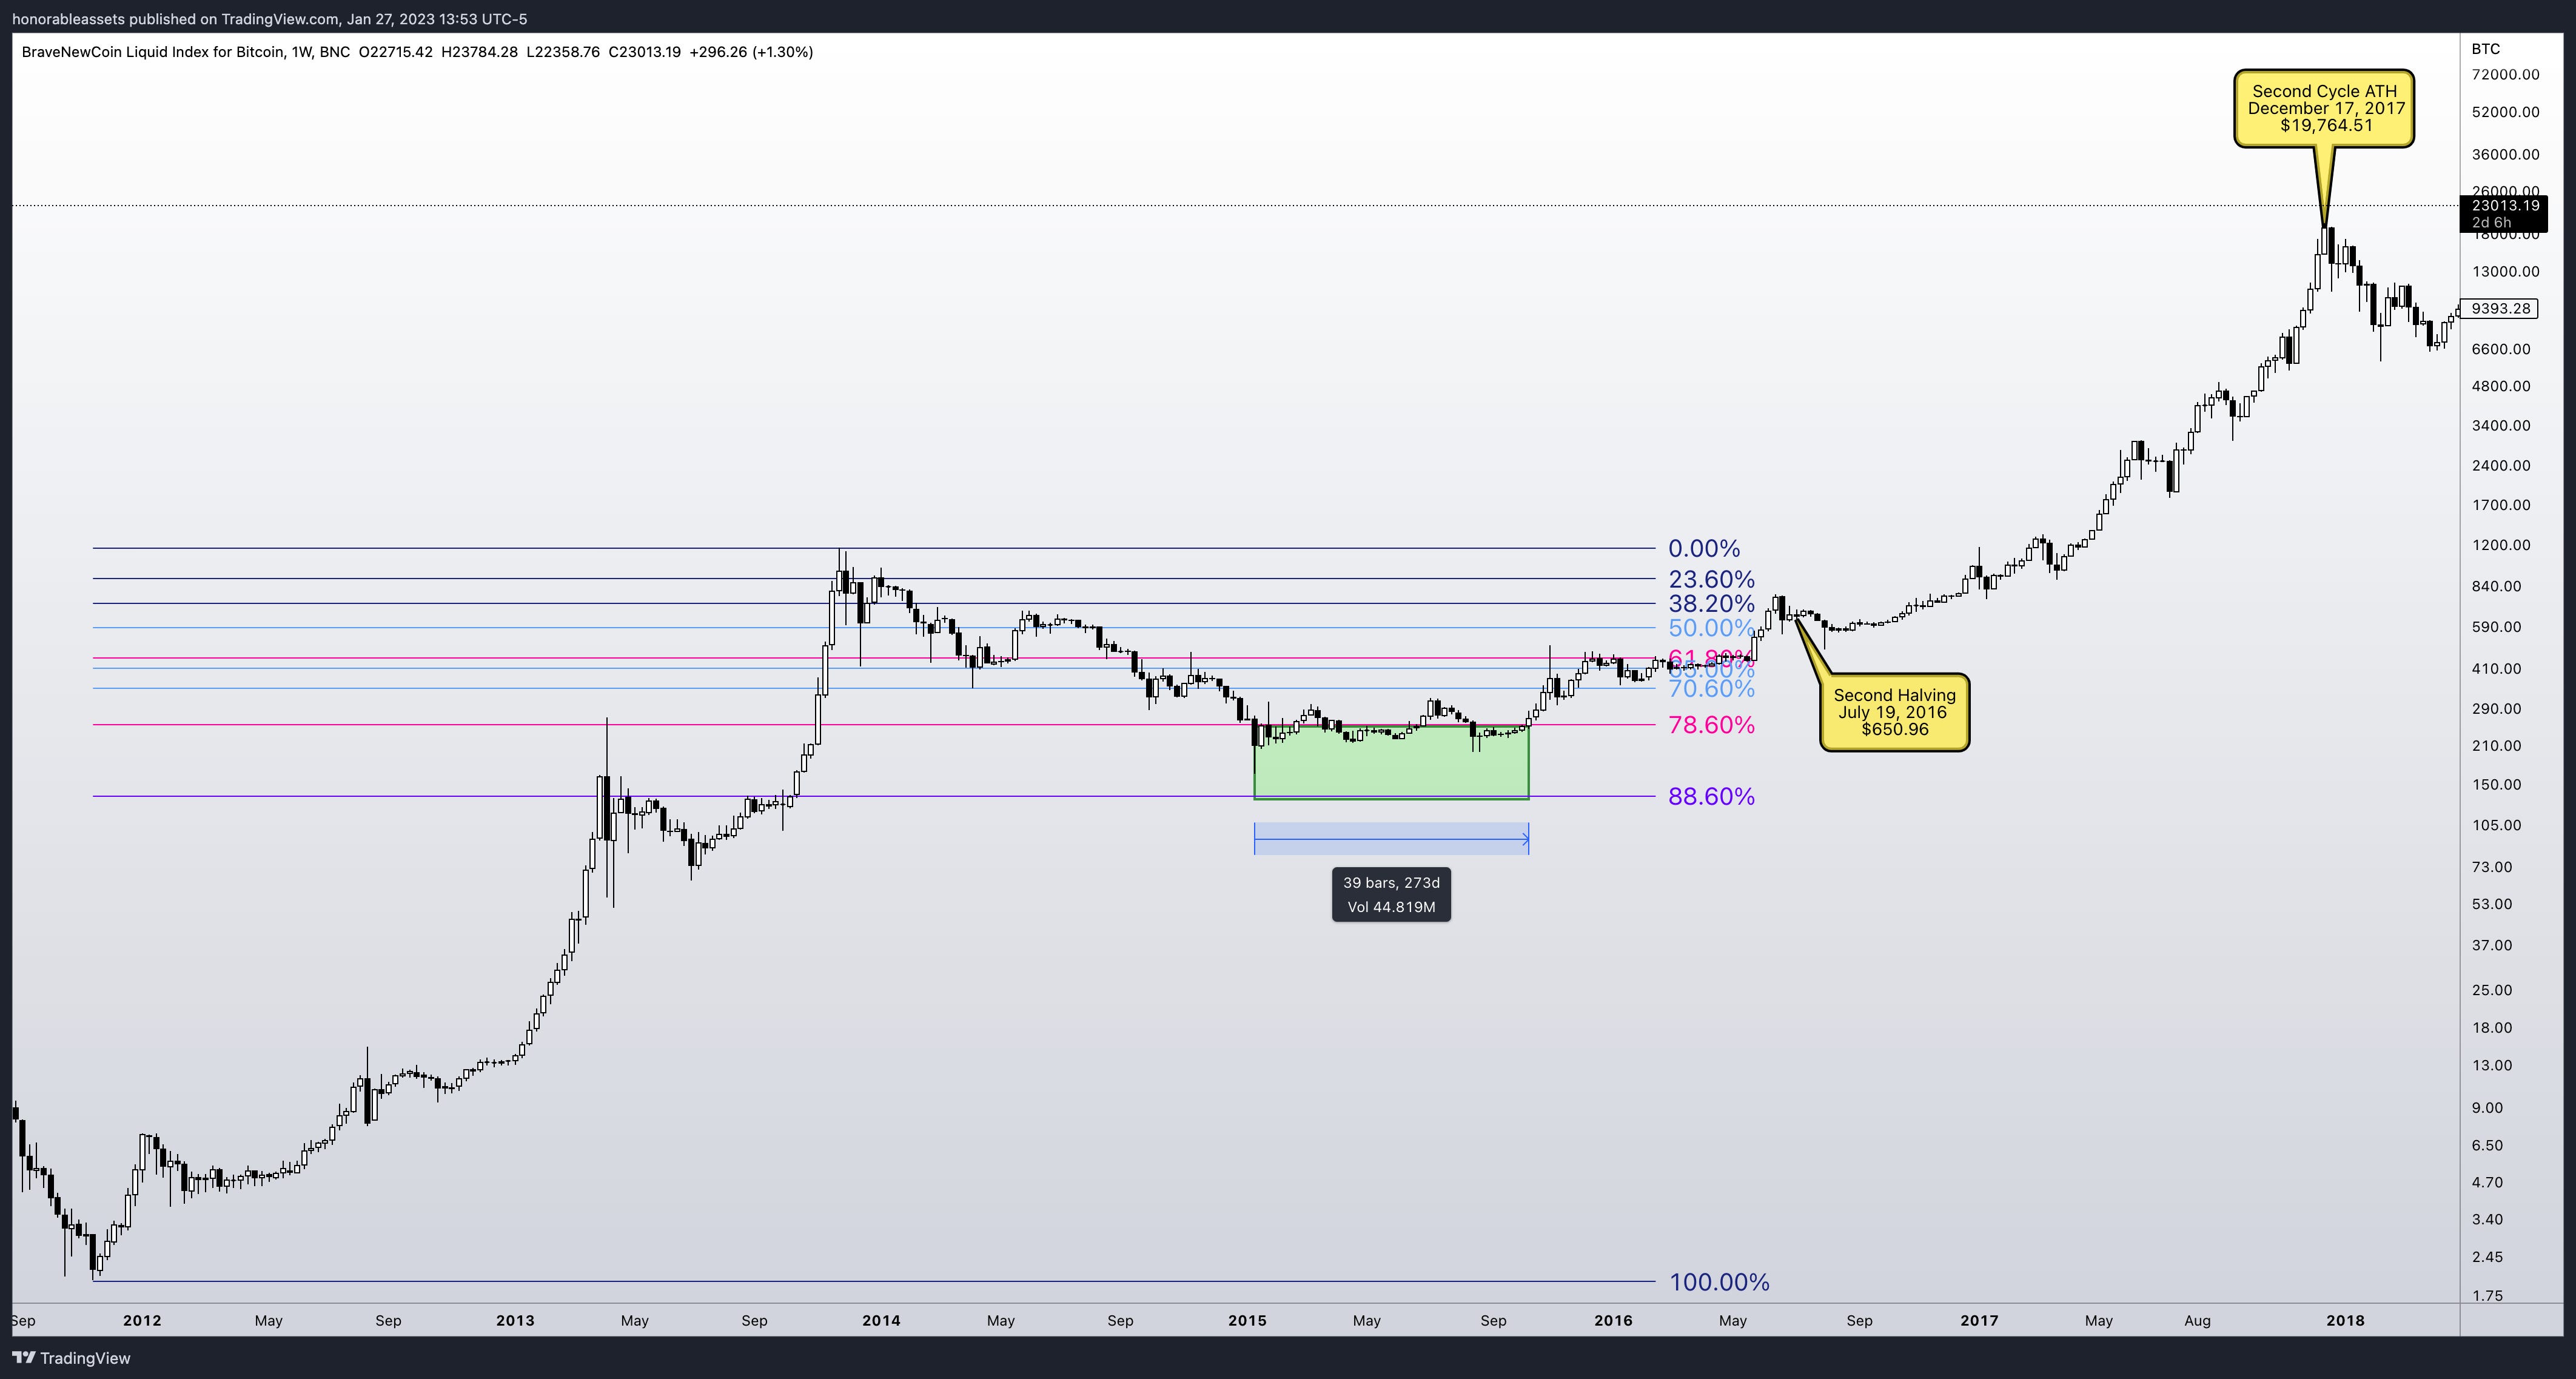
Were going to keep applying the 88.6% level from previous low to that cycle all time high. In chart 2.1 you can see the histoical view point of Bitcoin halving cycle 2. Same fibs, same levels, same strategy and you get similar results. Once again BTC gave you a range (273 days) to load up the cold storage wallets for the bigger picture. In the second cycle the returns weren't that large compared to the first cycle buy still gave you a 7,796% ROI.
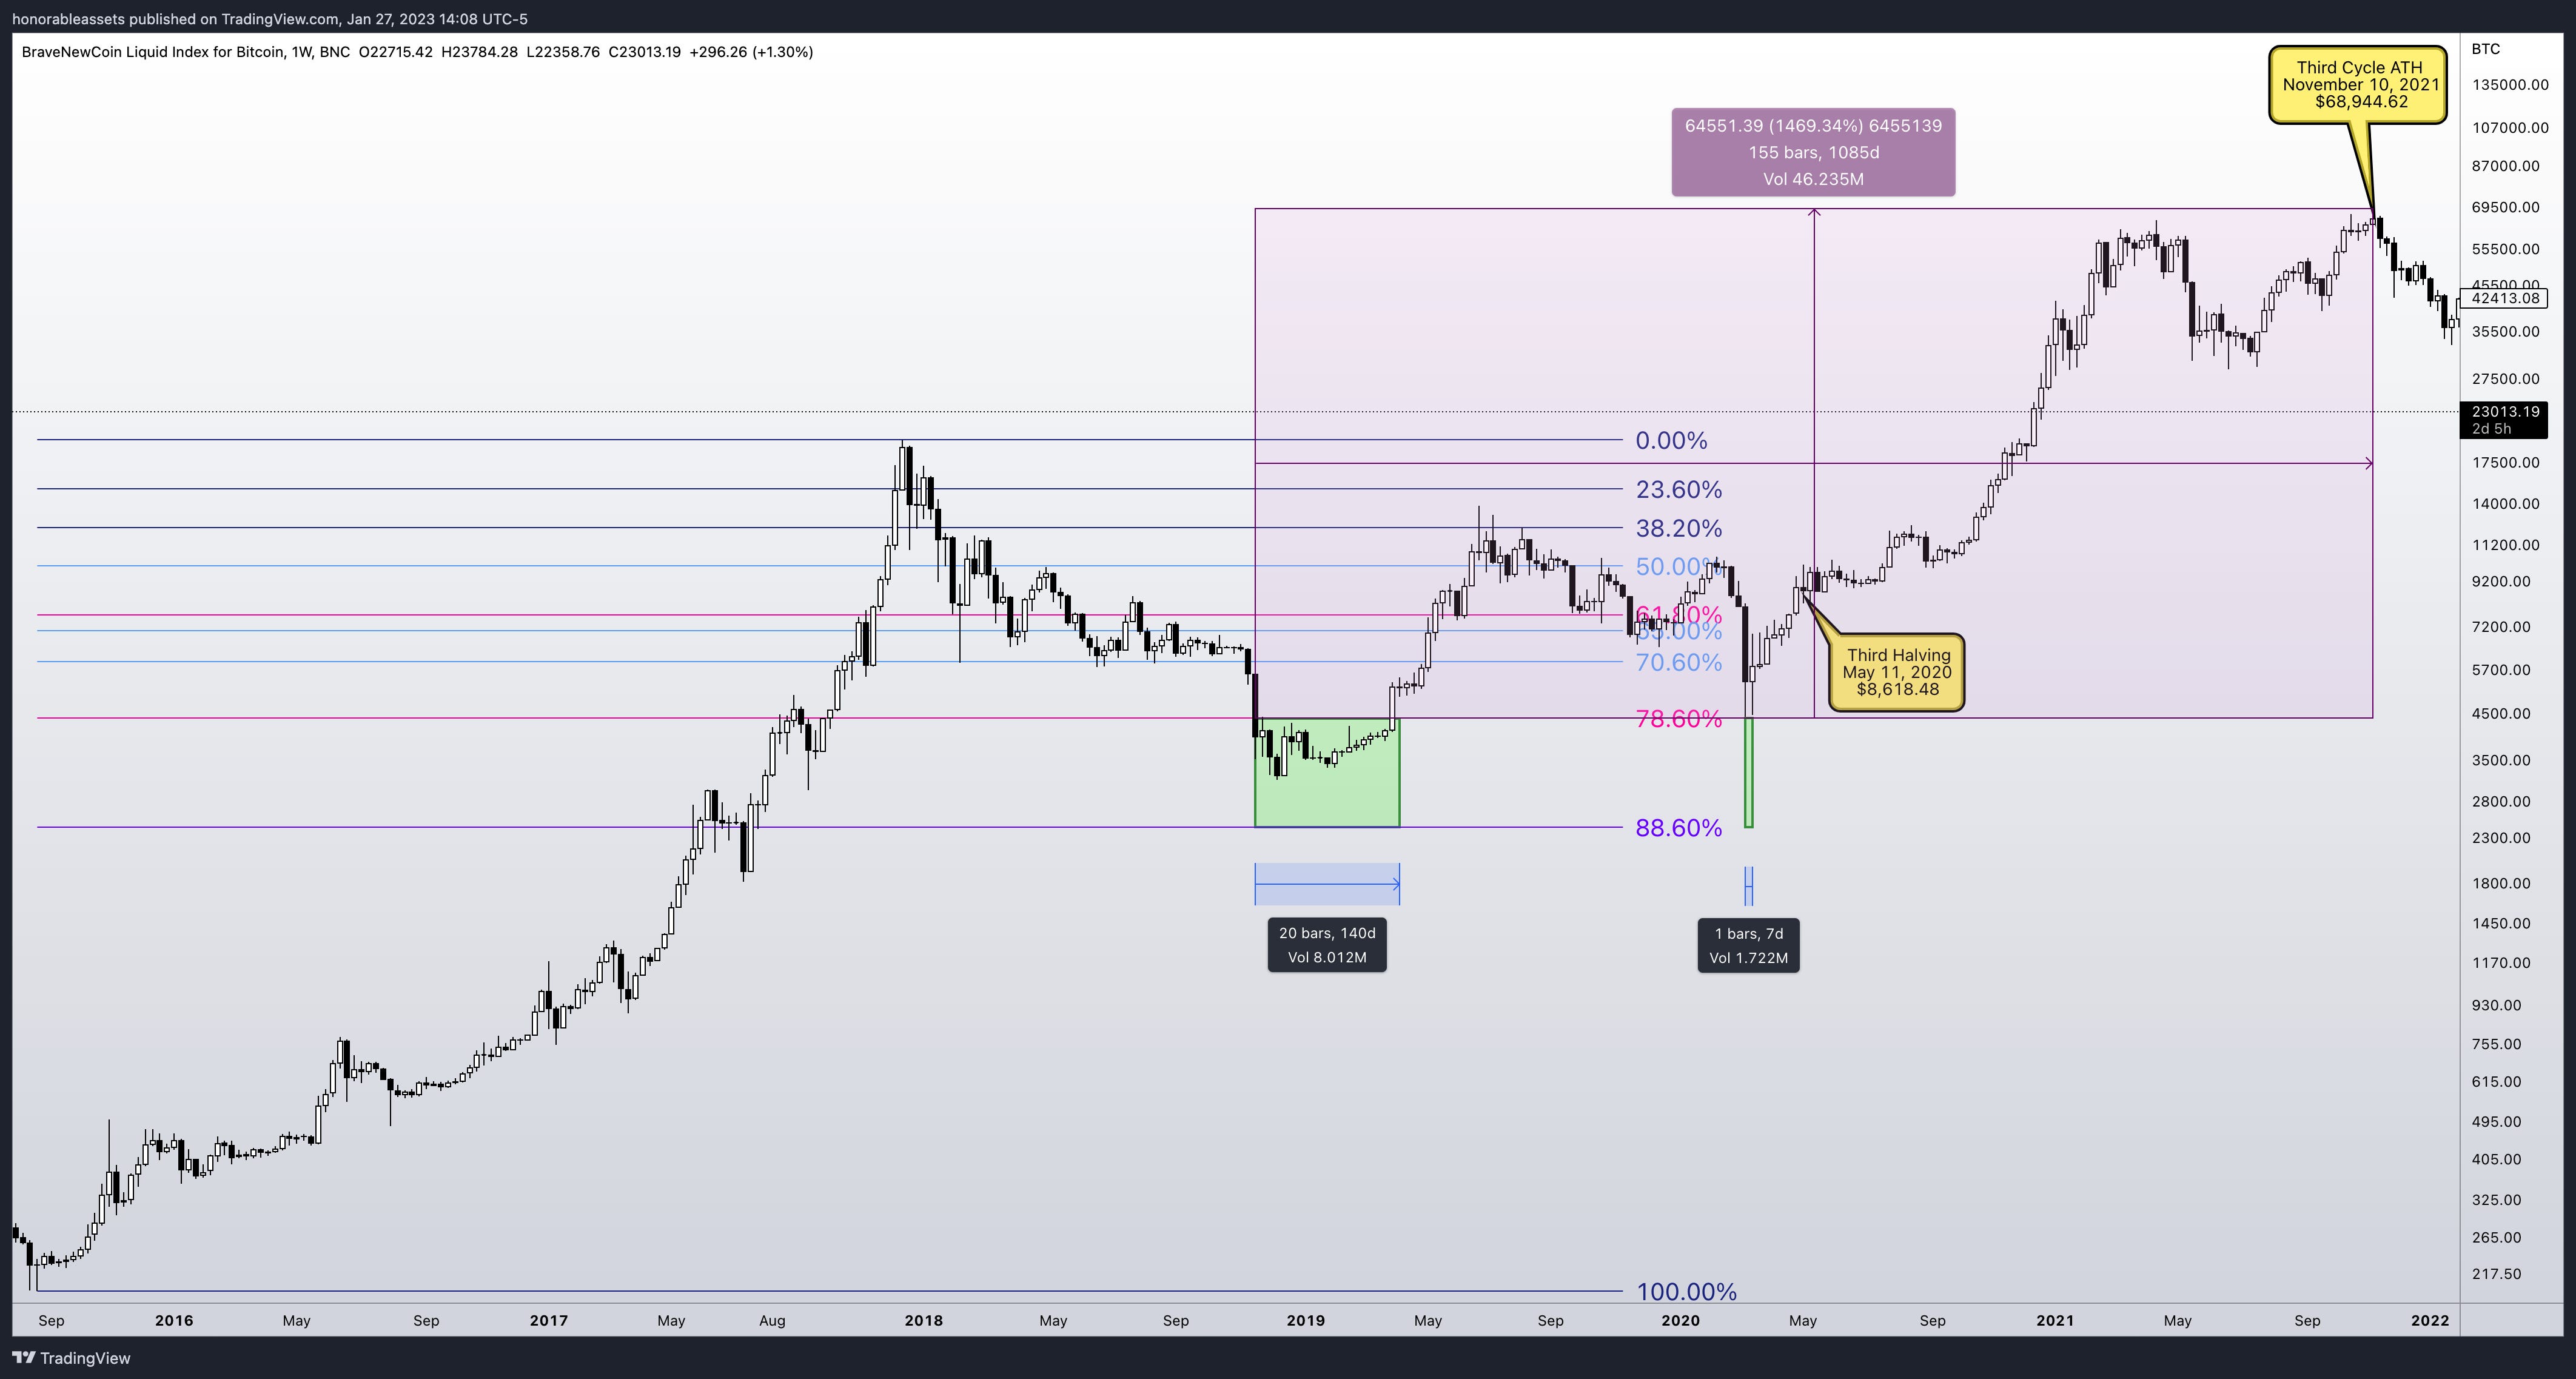
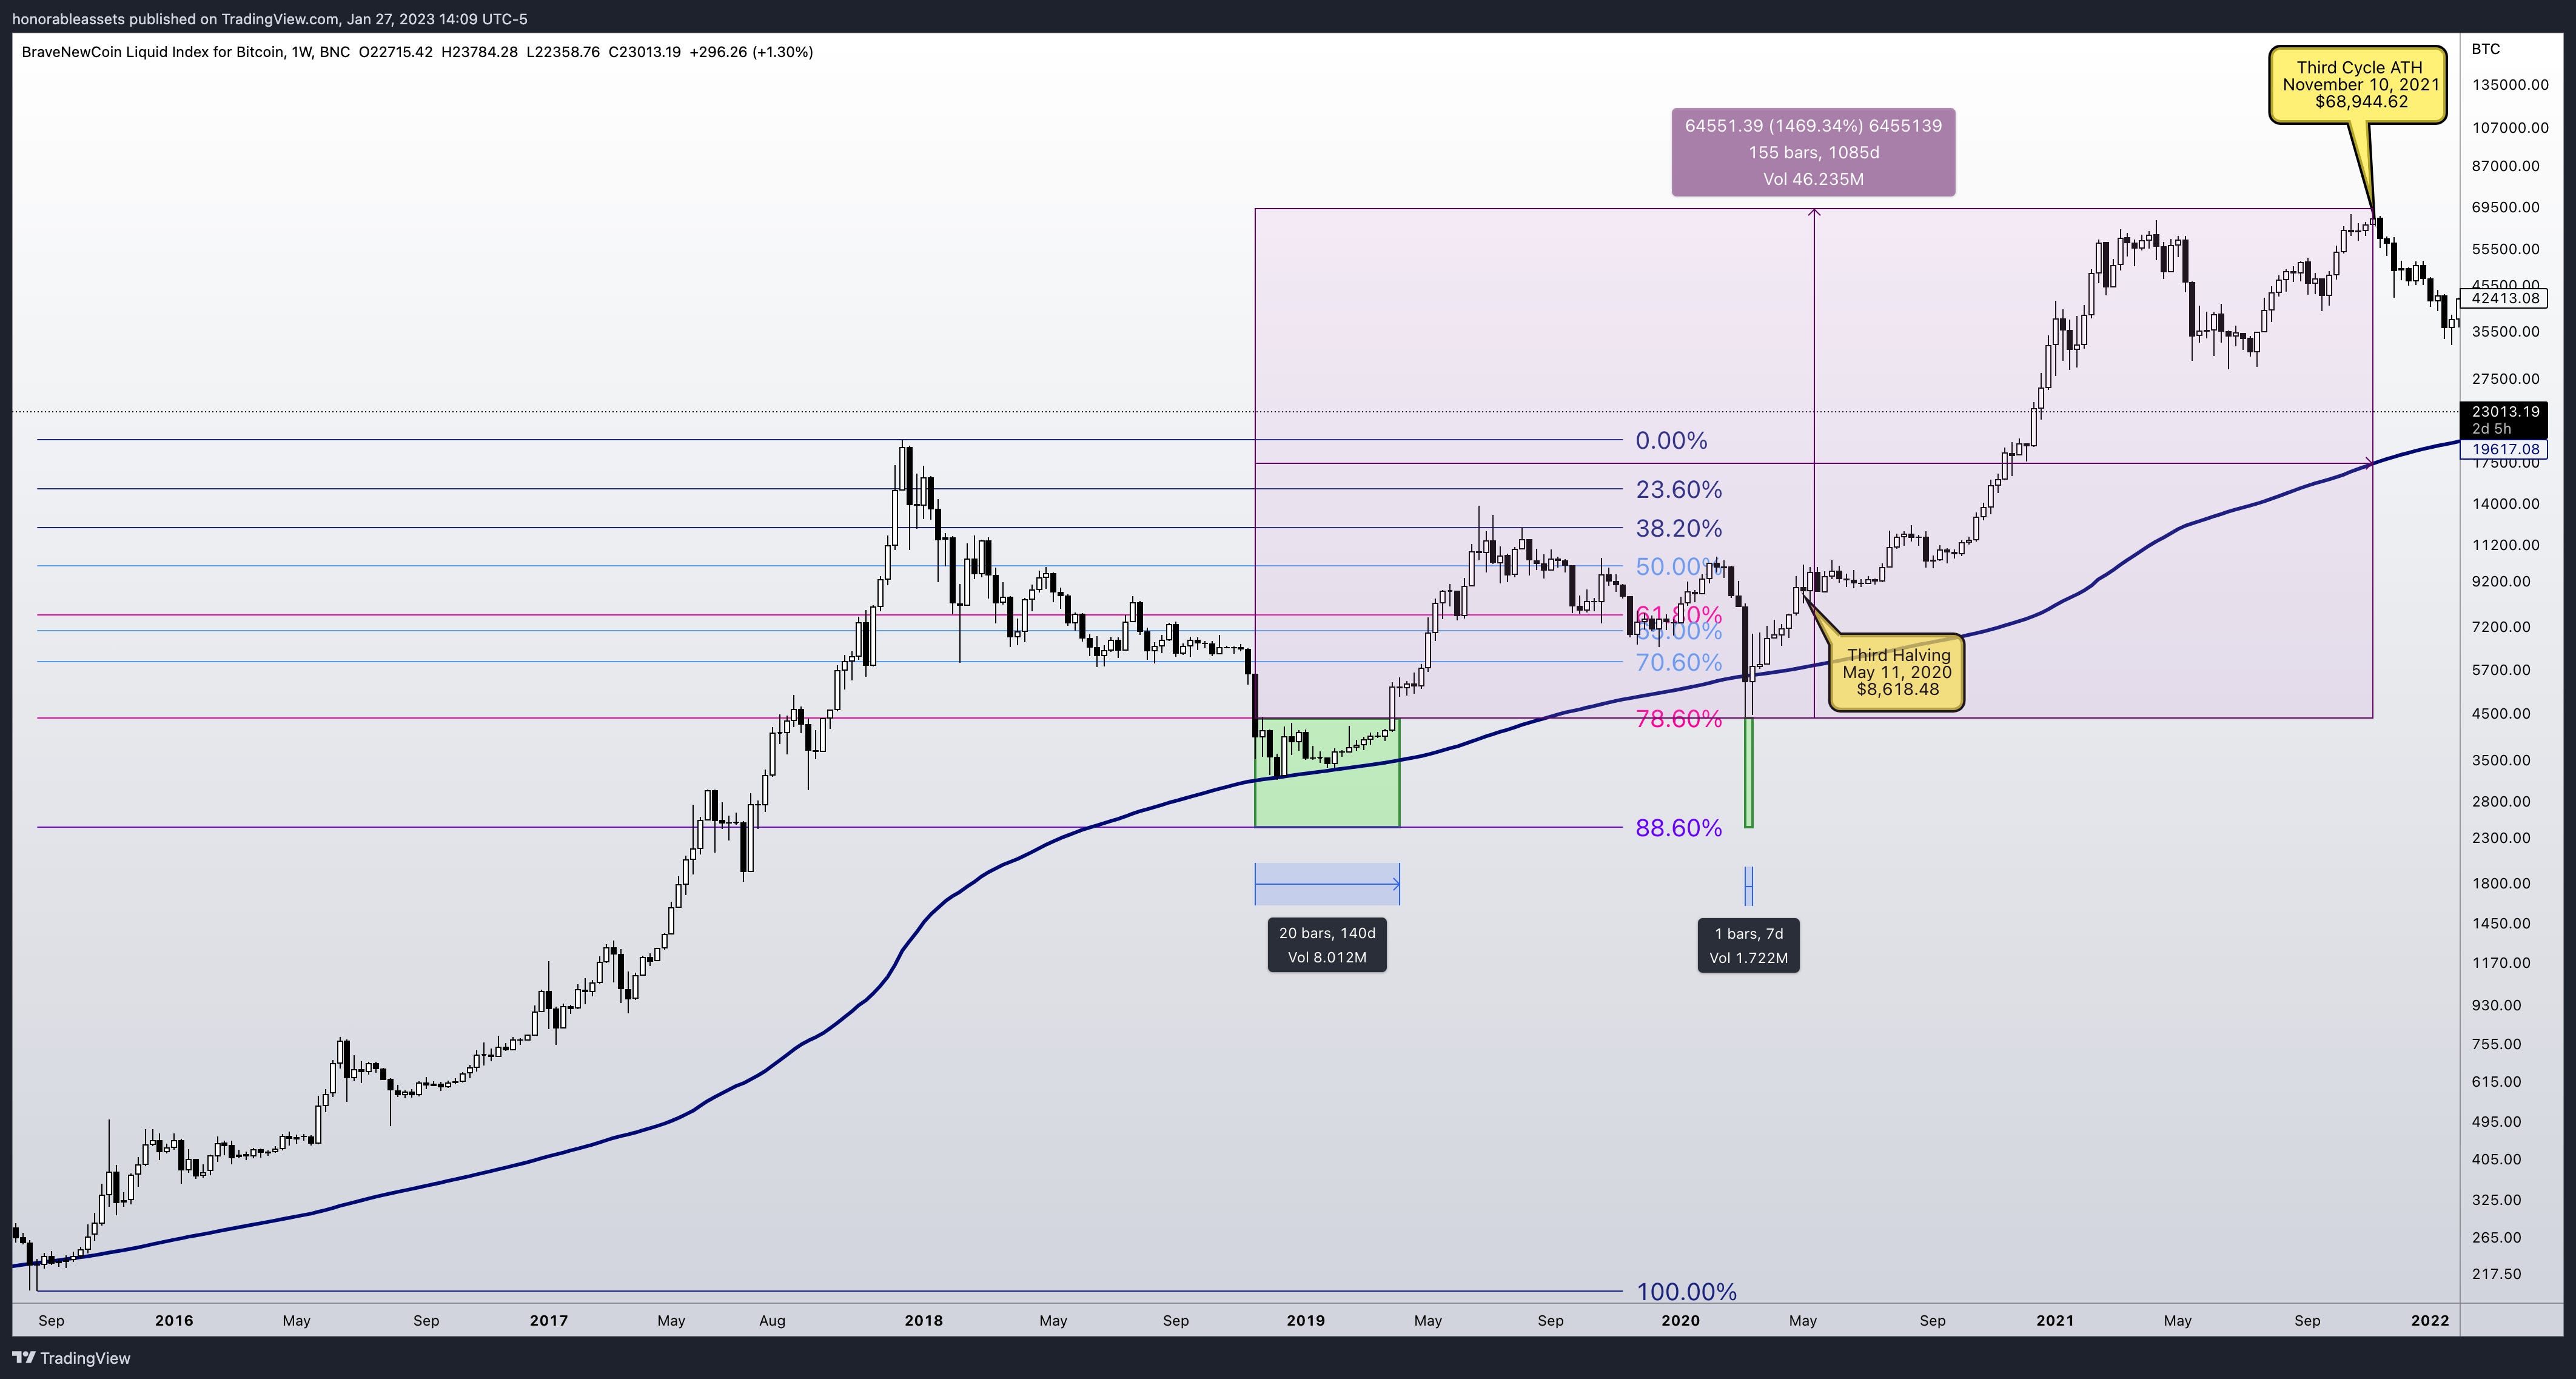
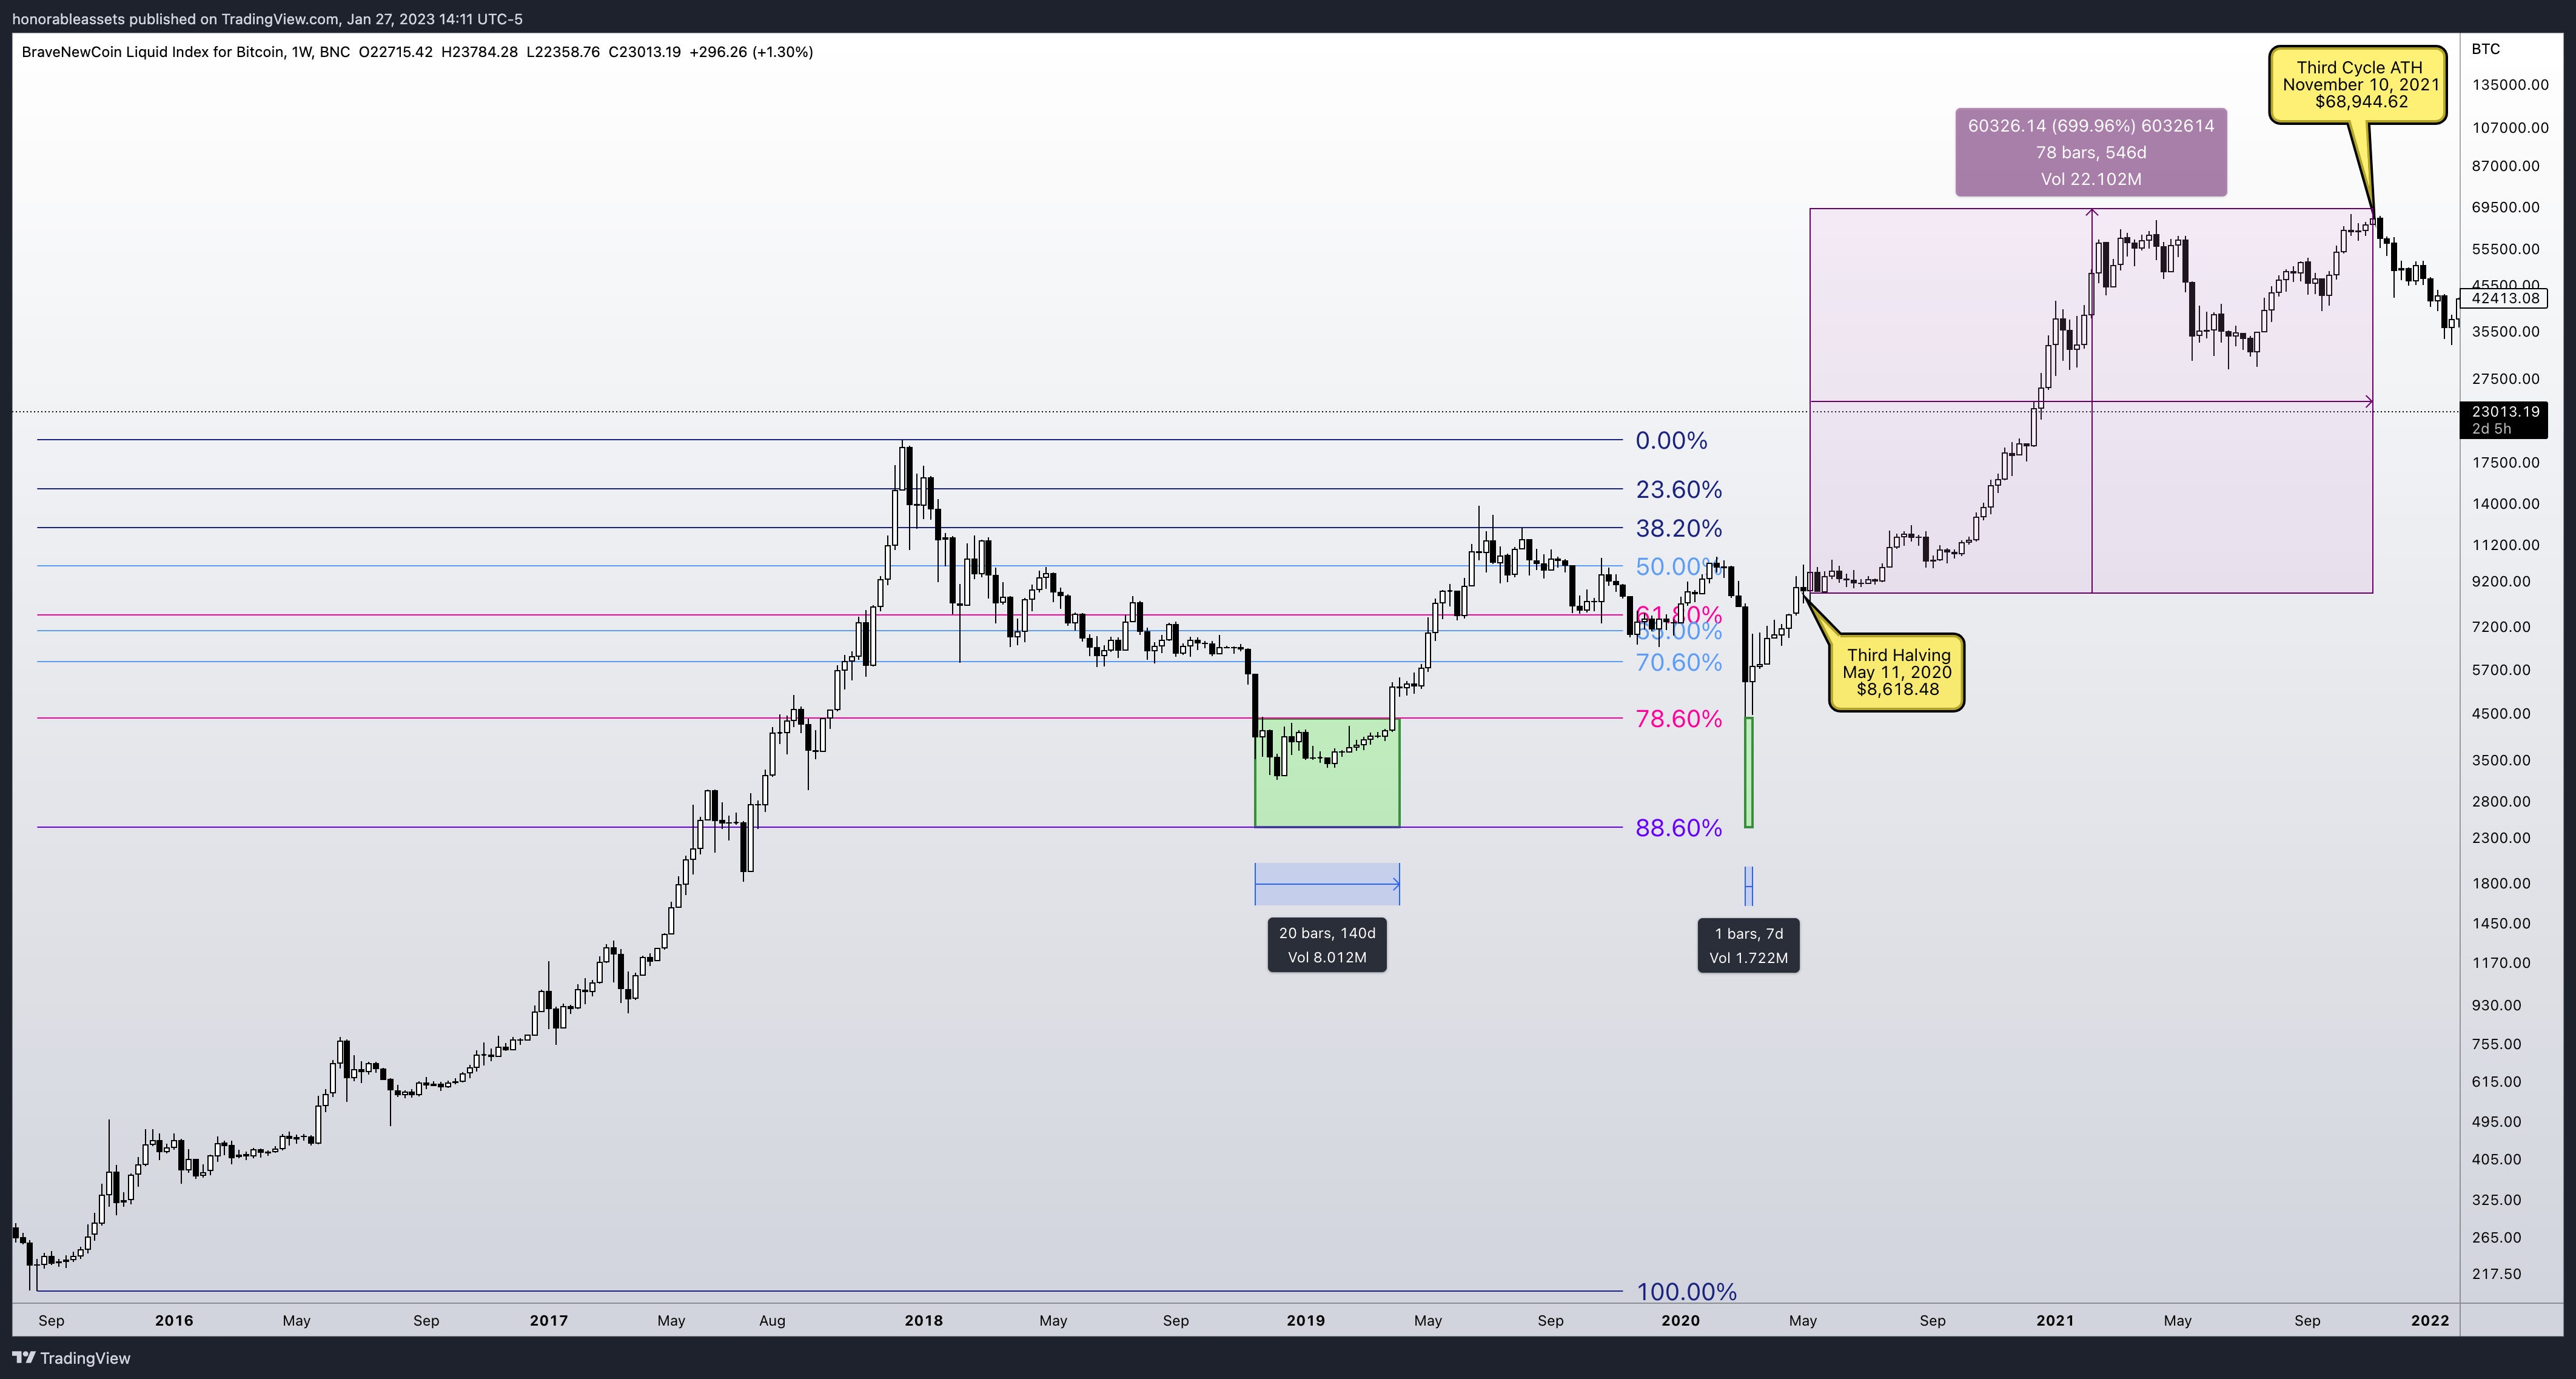
Last but not least is the data for BTC cycle number 3, which was the most recent run that took us to all-time high of $68,944.62. This run gave us a return of 1,469.34% from the moment the price went into the 88.6% zone. Unlike the previous 2 cycles, we encountered covid, which was a major global black swan event that gave us another glorious buying opportunity later in the cycle for 7 days. Even if you aren't an active everyday trader. Applying these methods and casually looking at a chart will provide you with the success you need in the long run. For example, you could set your Fibonacci tool on the low to the high and set alerts in trading view at the levels you are interested in buying to save you the worry. After all, I'm a firm believer in working smarter, not harder.
One thing to also take note of is how the returns seem to be shrinking for Bitcoin. The first cycle you were able to rack in 17,092.46% from the top of that 88.6% fib level. The second cycle brought in a 7,796% return and the third cycle had a 1,469.34% return from the top of that 88.6% level. Another observation I had over the years is that the buying opportunity window of this method shrinks as the cycles move on. I'm not saying this is a guarentee for the future but so far as the cycles have gone on, the window gets smaller and smaller. During the first cycle we had a window of 308 days to “buy the dip” at phenominal pricing. The second cycle we had 273 days and the third cycle lasted 140 days with the opportunity to take advantage for another week when covid shook the world. This reminds me of that infamous saying by Warren Buffet, “be fearful when others are greedy and greedy when others are fearful”.
So great Will, past data was fantastic, and looking back we can see where the best opportunities took place for each cycle. You may be asking how one could apply this for this 4th BTC halving at approximately the end of March 2024.
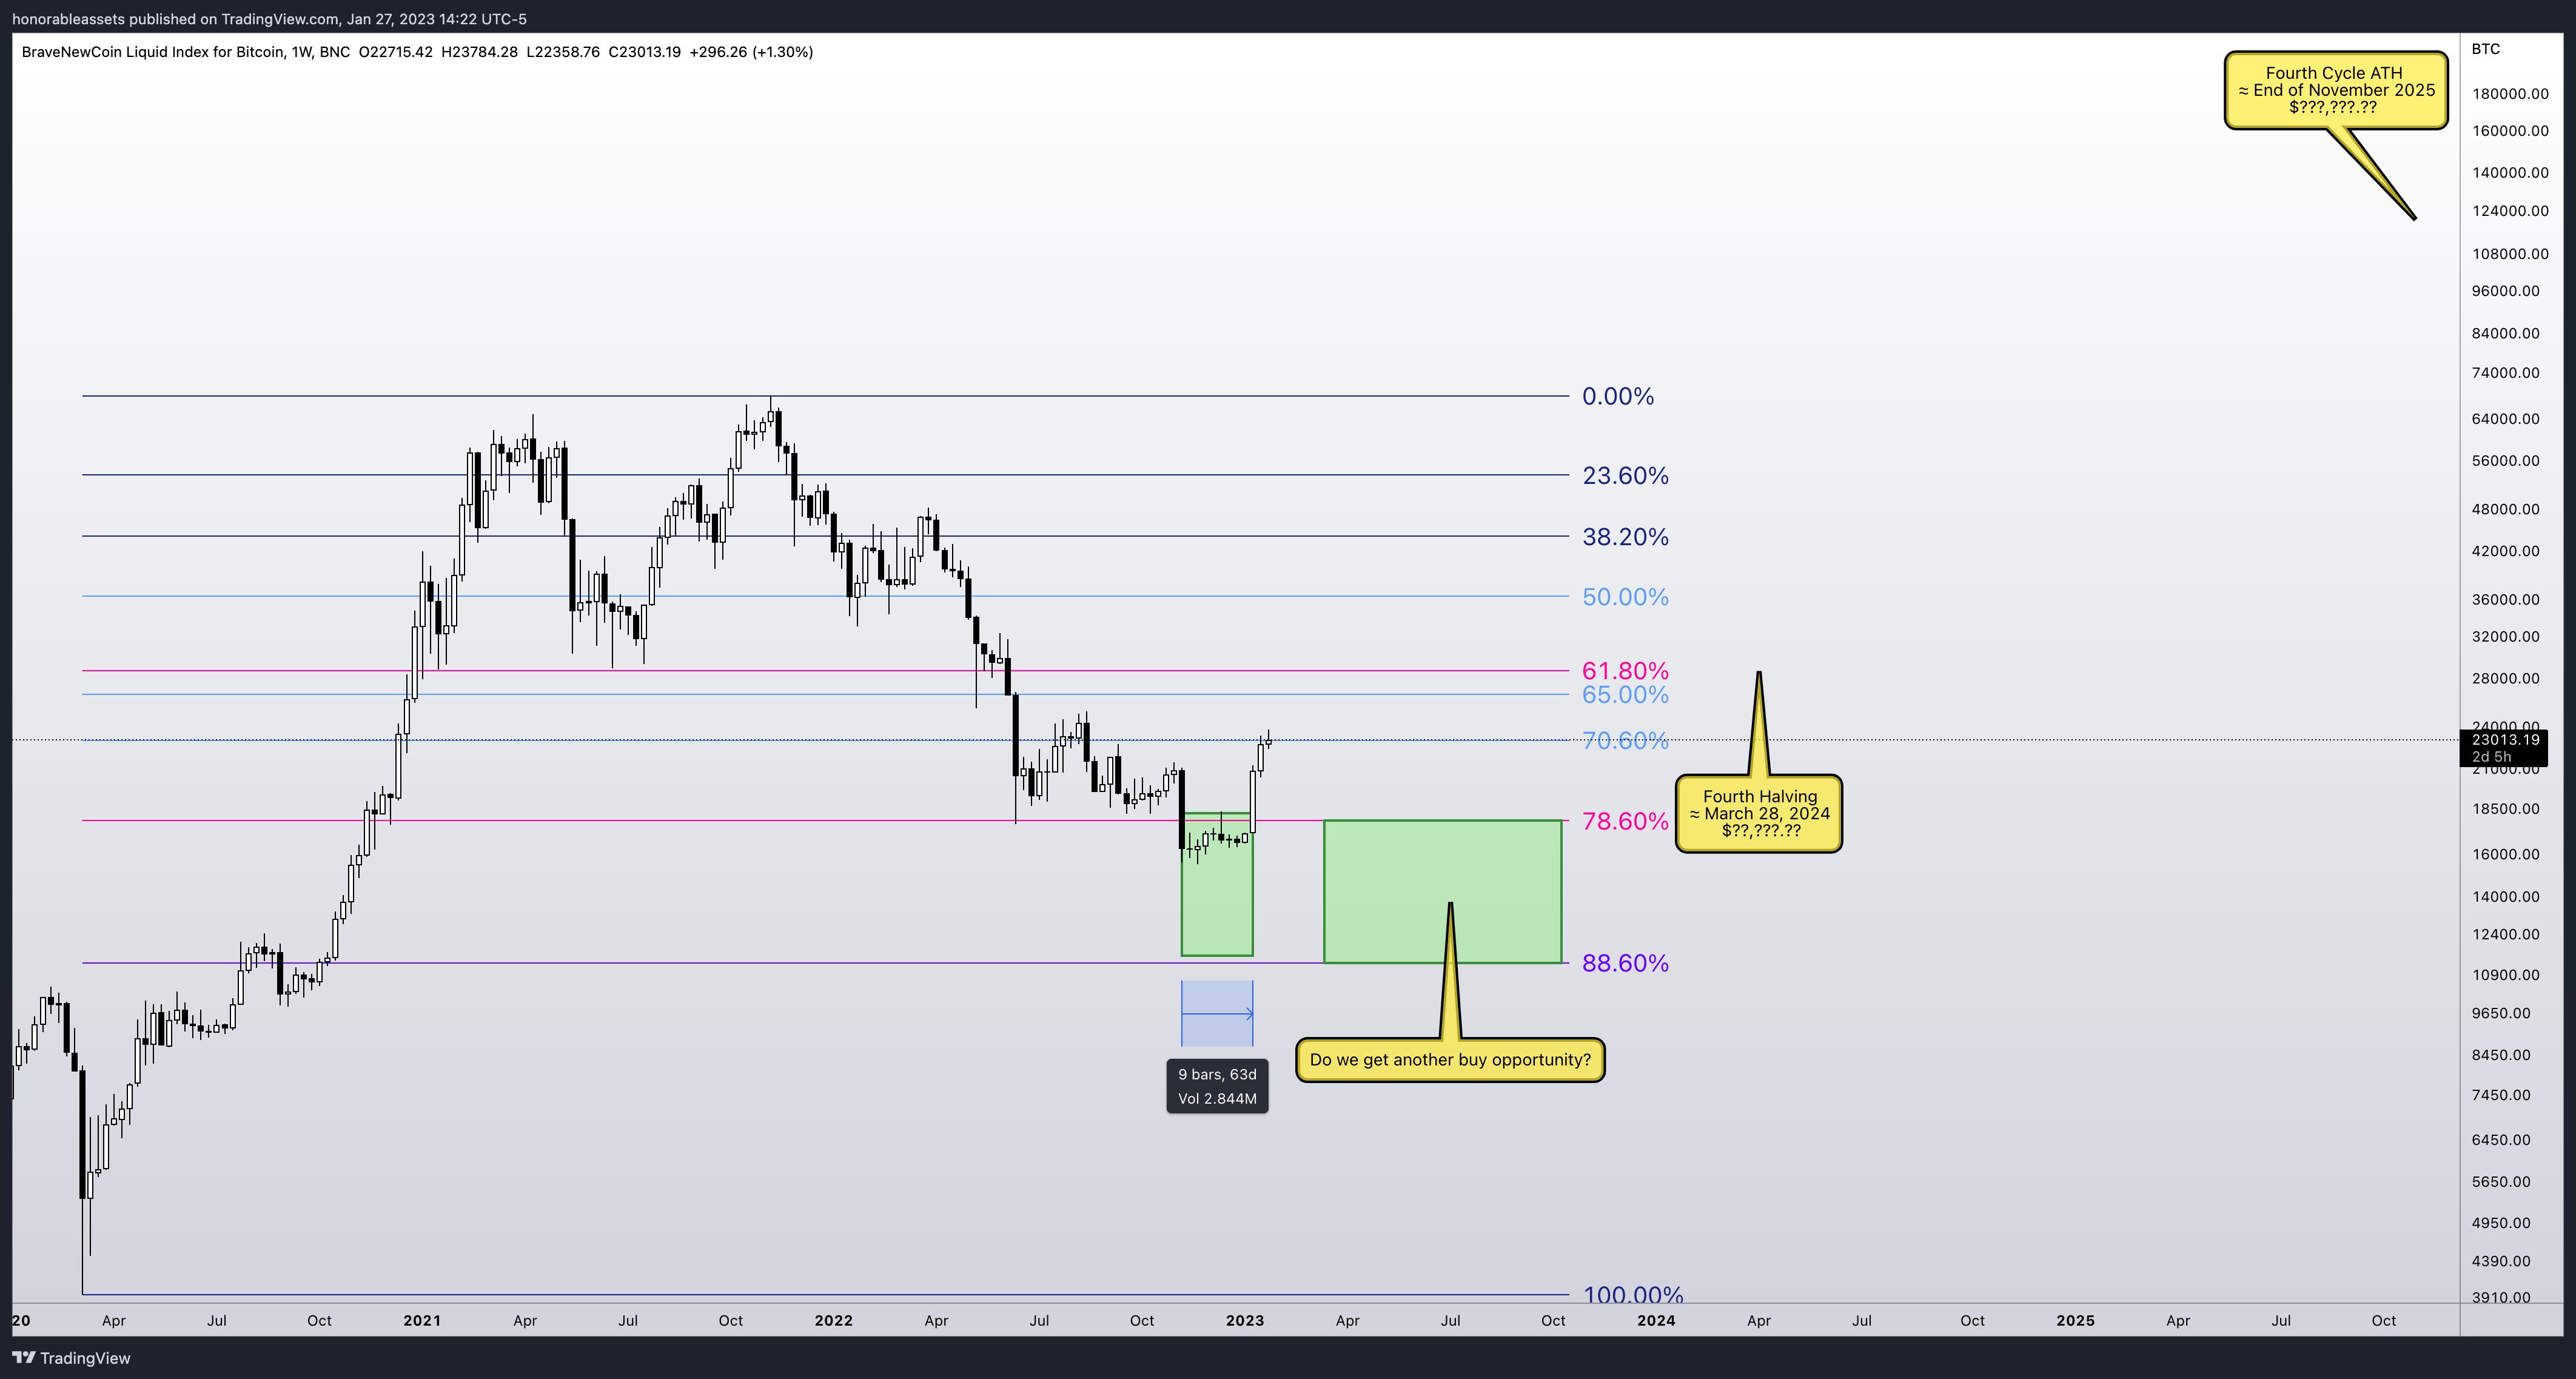
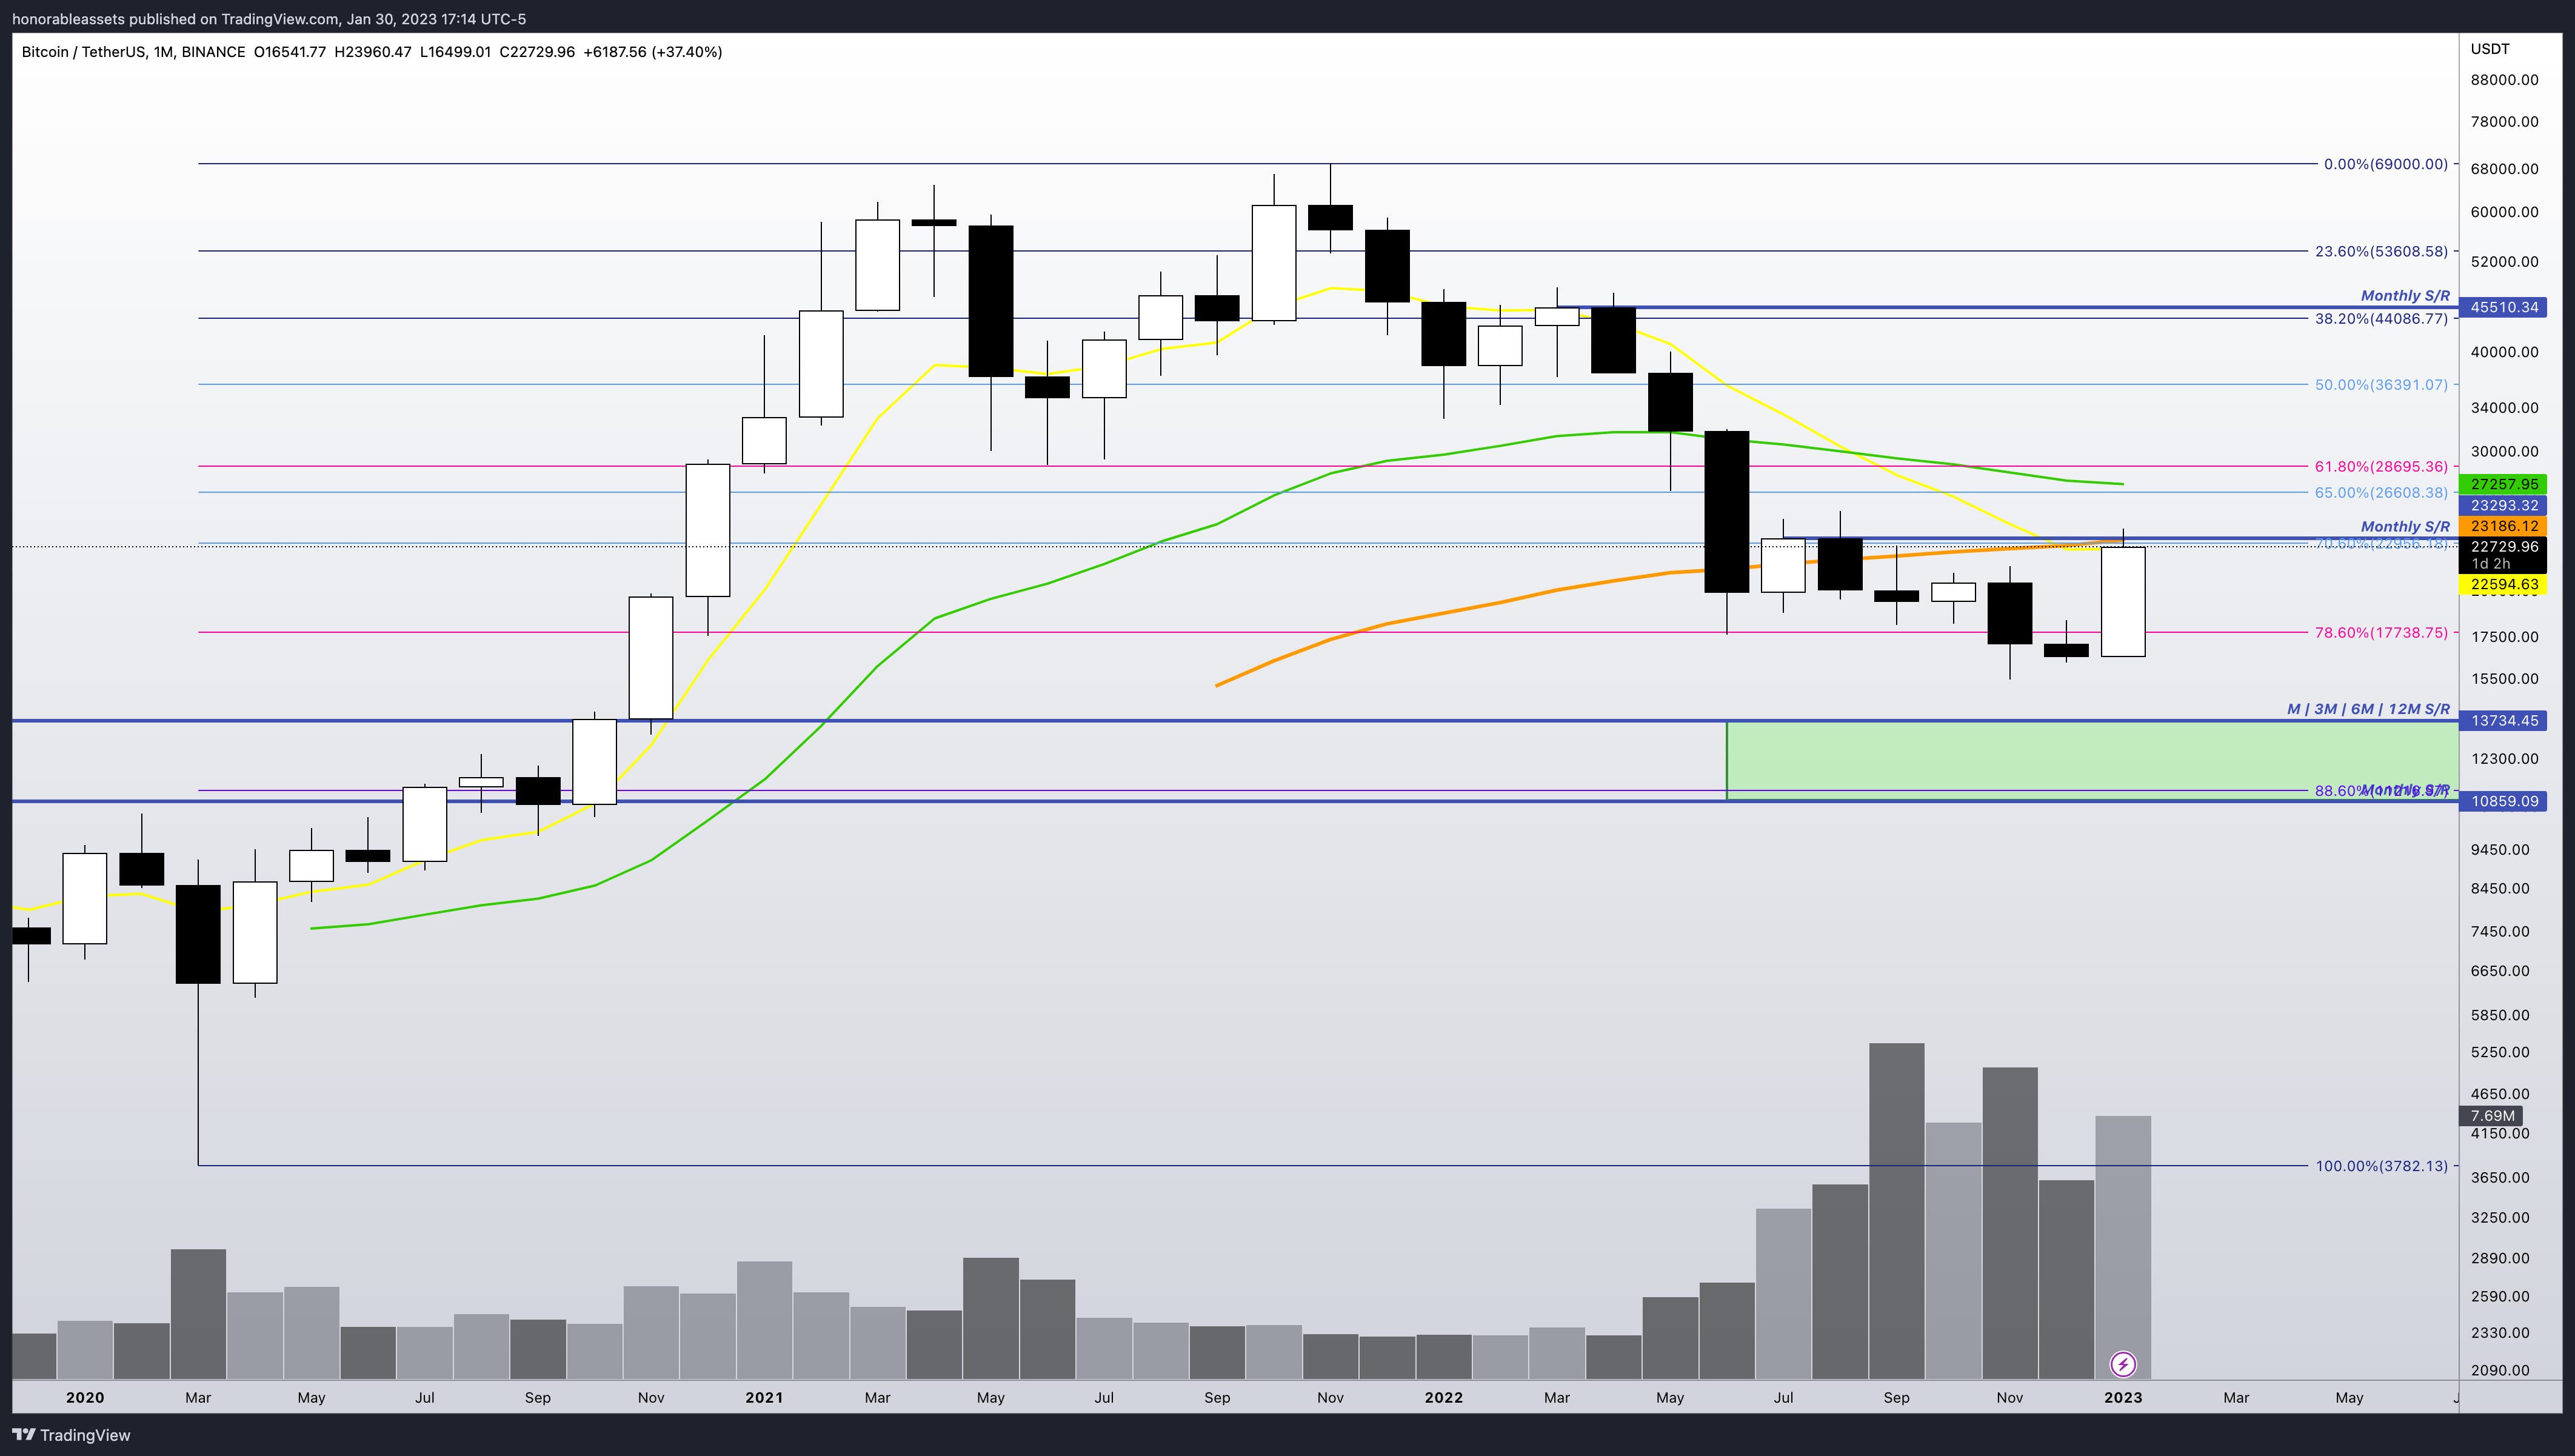
In image 4.1 you can see the overall layout for what will be cycle 4. Fibbing the low to the high you come up with the sweet spot of $10,786.97 to $17,889.77. Taken one step further and applying high time frame support and resistance we end up with a zone of $10,859.09 to $13,734.45 with the 88.6% Fibonacci level at $11,214.76 (Image 4.2). The last 2 cycles did not quite hit the 88.6% on the dot BUT these high time frame support zones just line up too well with the 88.6% and look too good of an opportunity to take advantage of. But this is why you have a zone you deploy the funds instead of one set magical number. By looking at previous data one could argue that once price hits the golden pocket of the fib, it would be a great time to start dollar cost averaging. If the price goes up? I have horses in the race. If the price breaks down? I add more horses. You are applying the best price buying opportunities instead of just throwing darts at the board blindfolded. Applying these cycle theories is a part of my favorite trading strategy “plan the trade, trade the plan.”
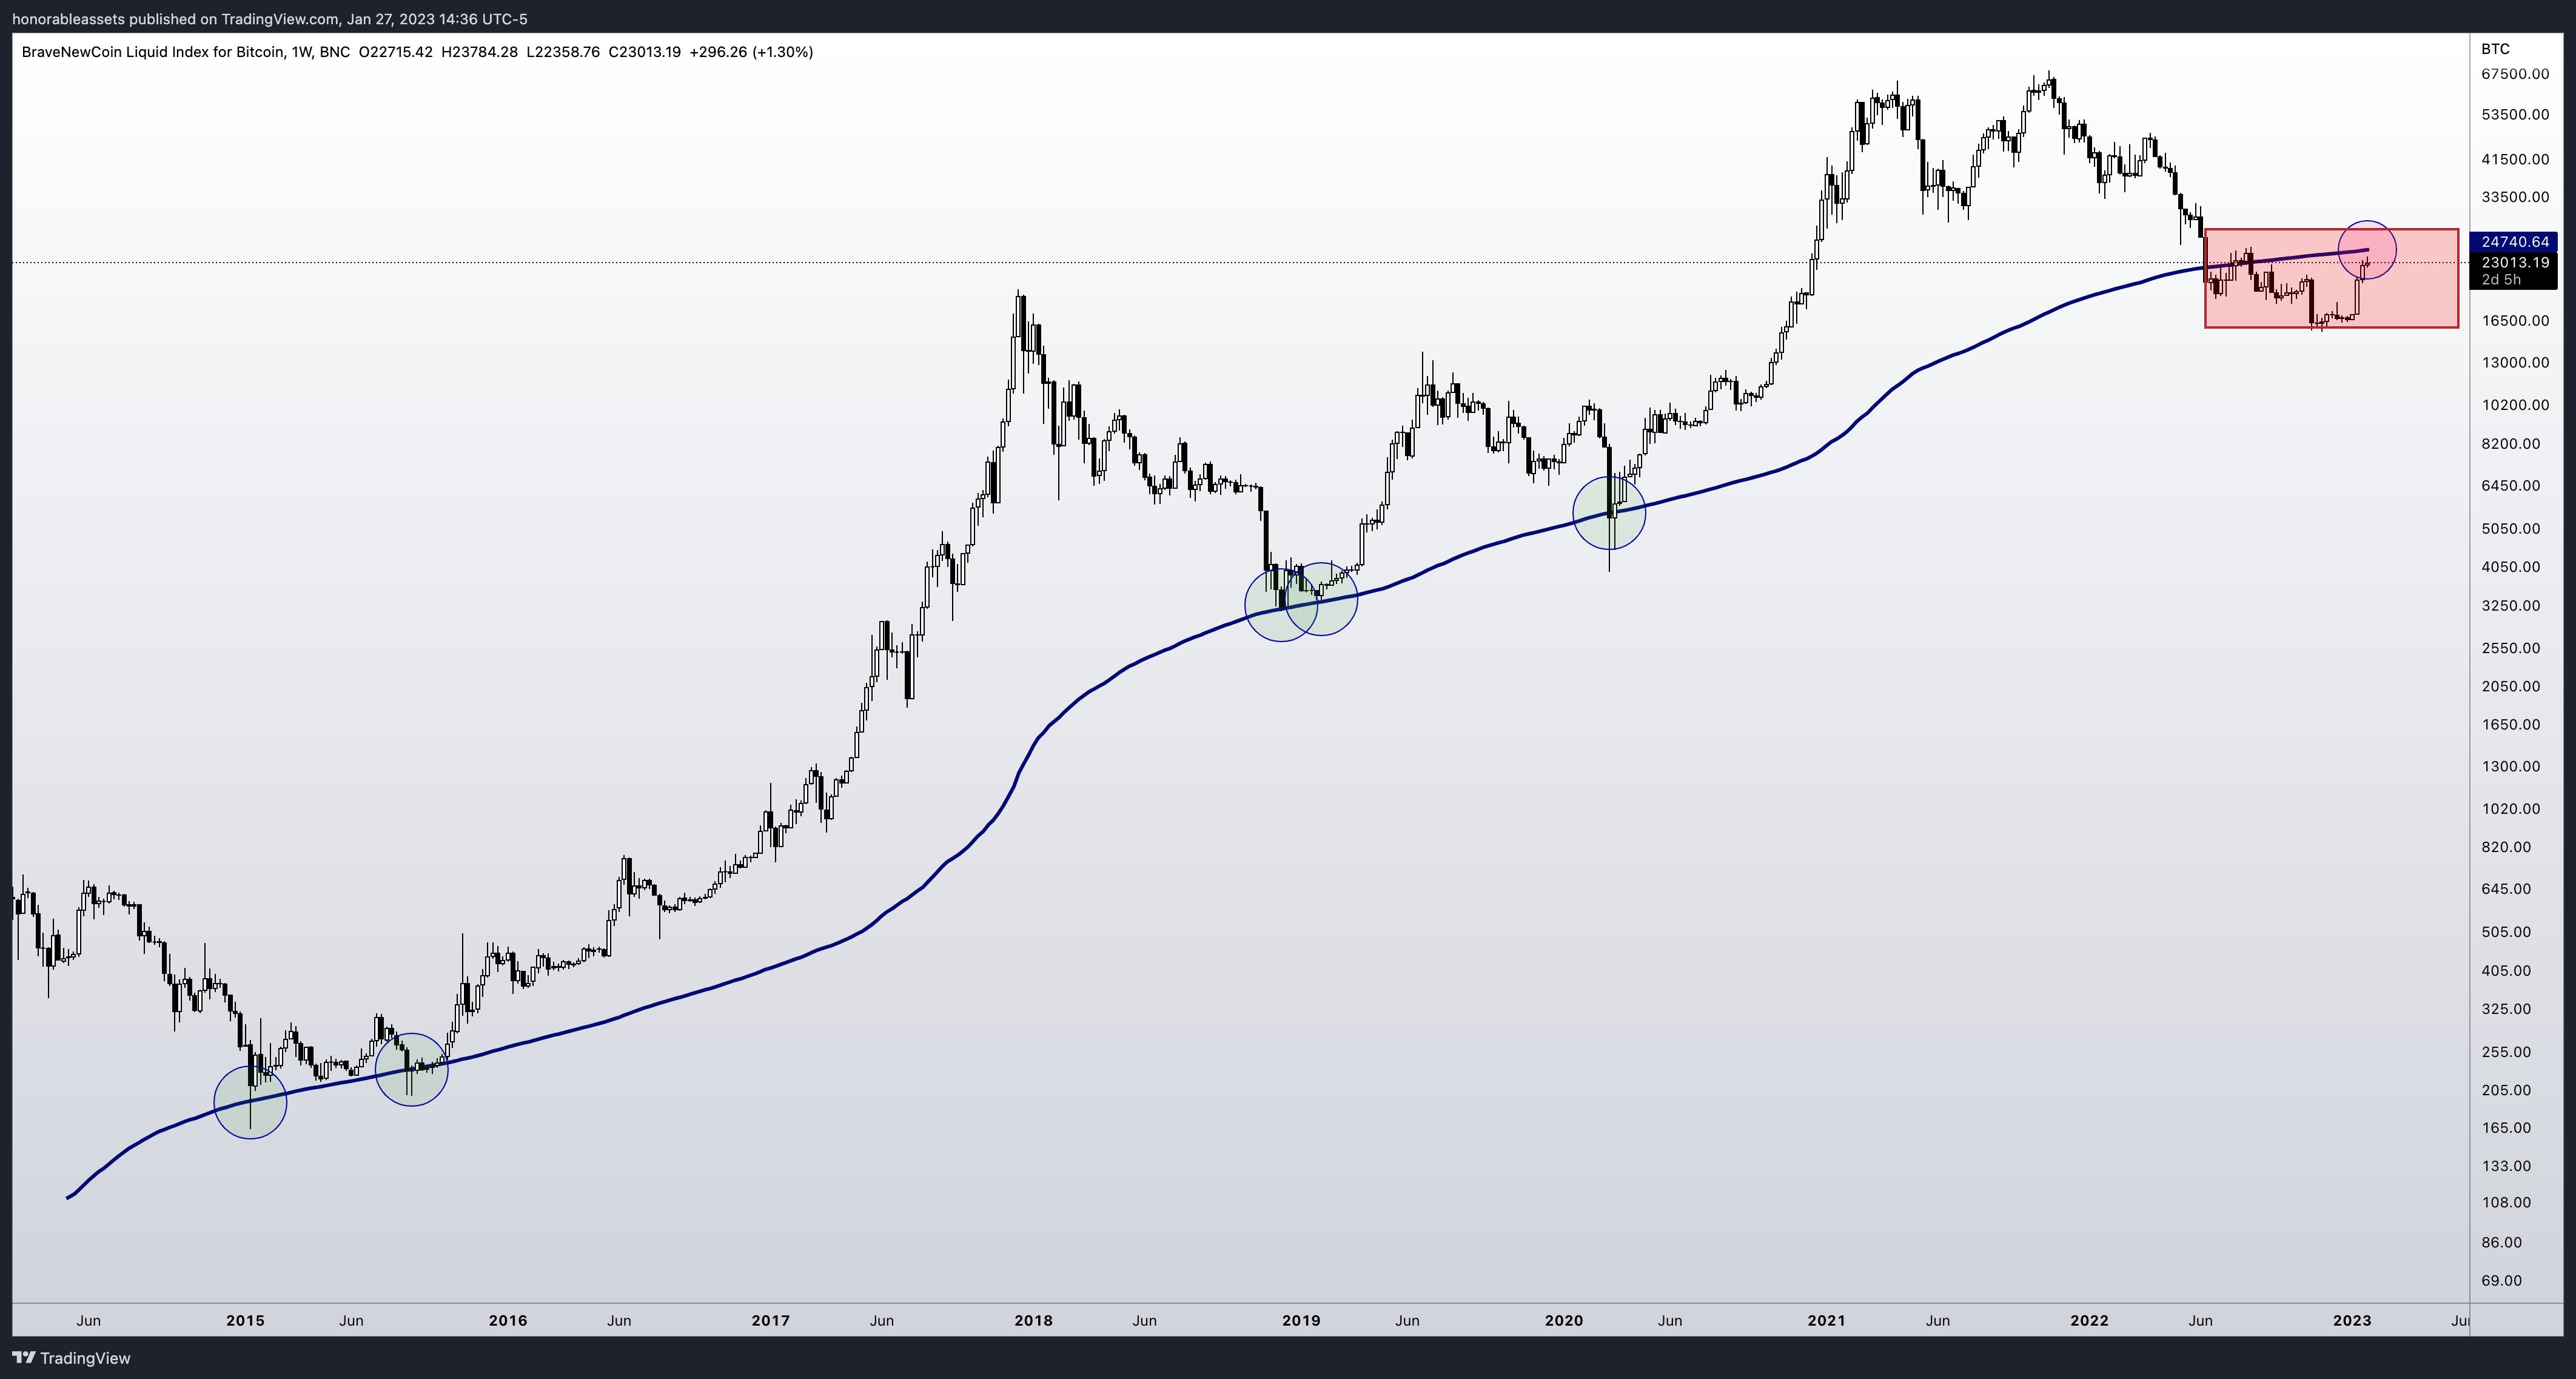
Another strategy that has historically paid off is the history of the weekly MA200 for BTC. A Moving Average (MA) is simply the average closing price of a assetover the last X amount of days, weeks, months, etc. Moving averages vary in their duration depending on the purpose they are used for by traders. MA's can be utilized as trend indicators of price behaviour over some time. This average is used to study price behaviour over the long term. In this case the last 200 weekly candle closes for Bitcoin. Below is the WMA200 for cycle 2 and cycle 3. Look at how how the MA lined up perfectly and was a hell of a buy with confluence using the 88.6% fibonacci method.
Historically a great buy, right? One problem. We're currently under it with conviction for the first time in Bitcoin's relatively young price history. Notice how during the March 2020 covid drop price sold off under the WMA200 but did not have a definitive close.
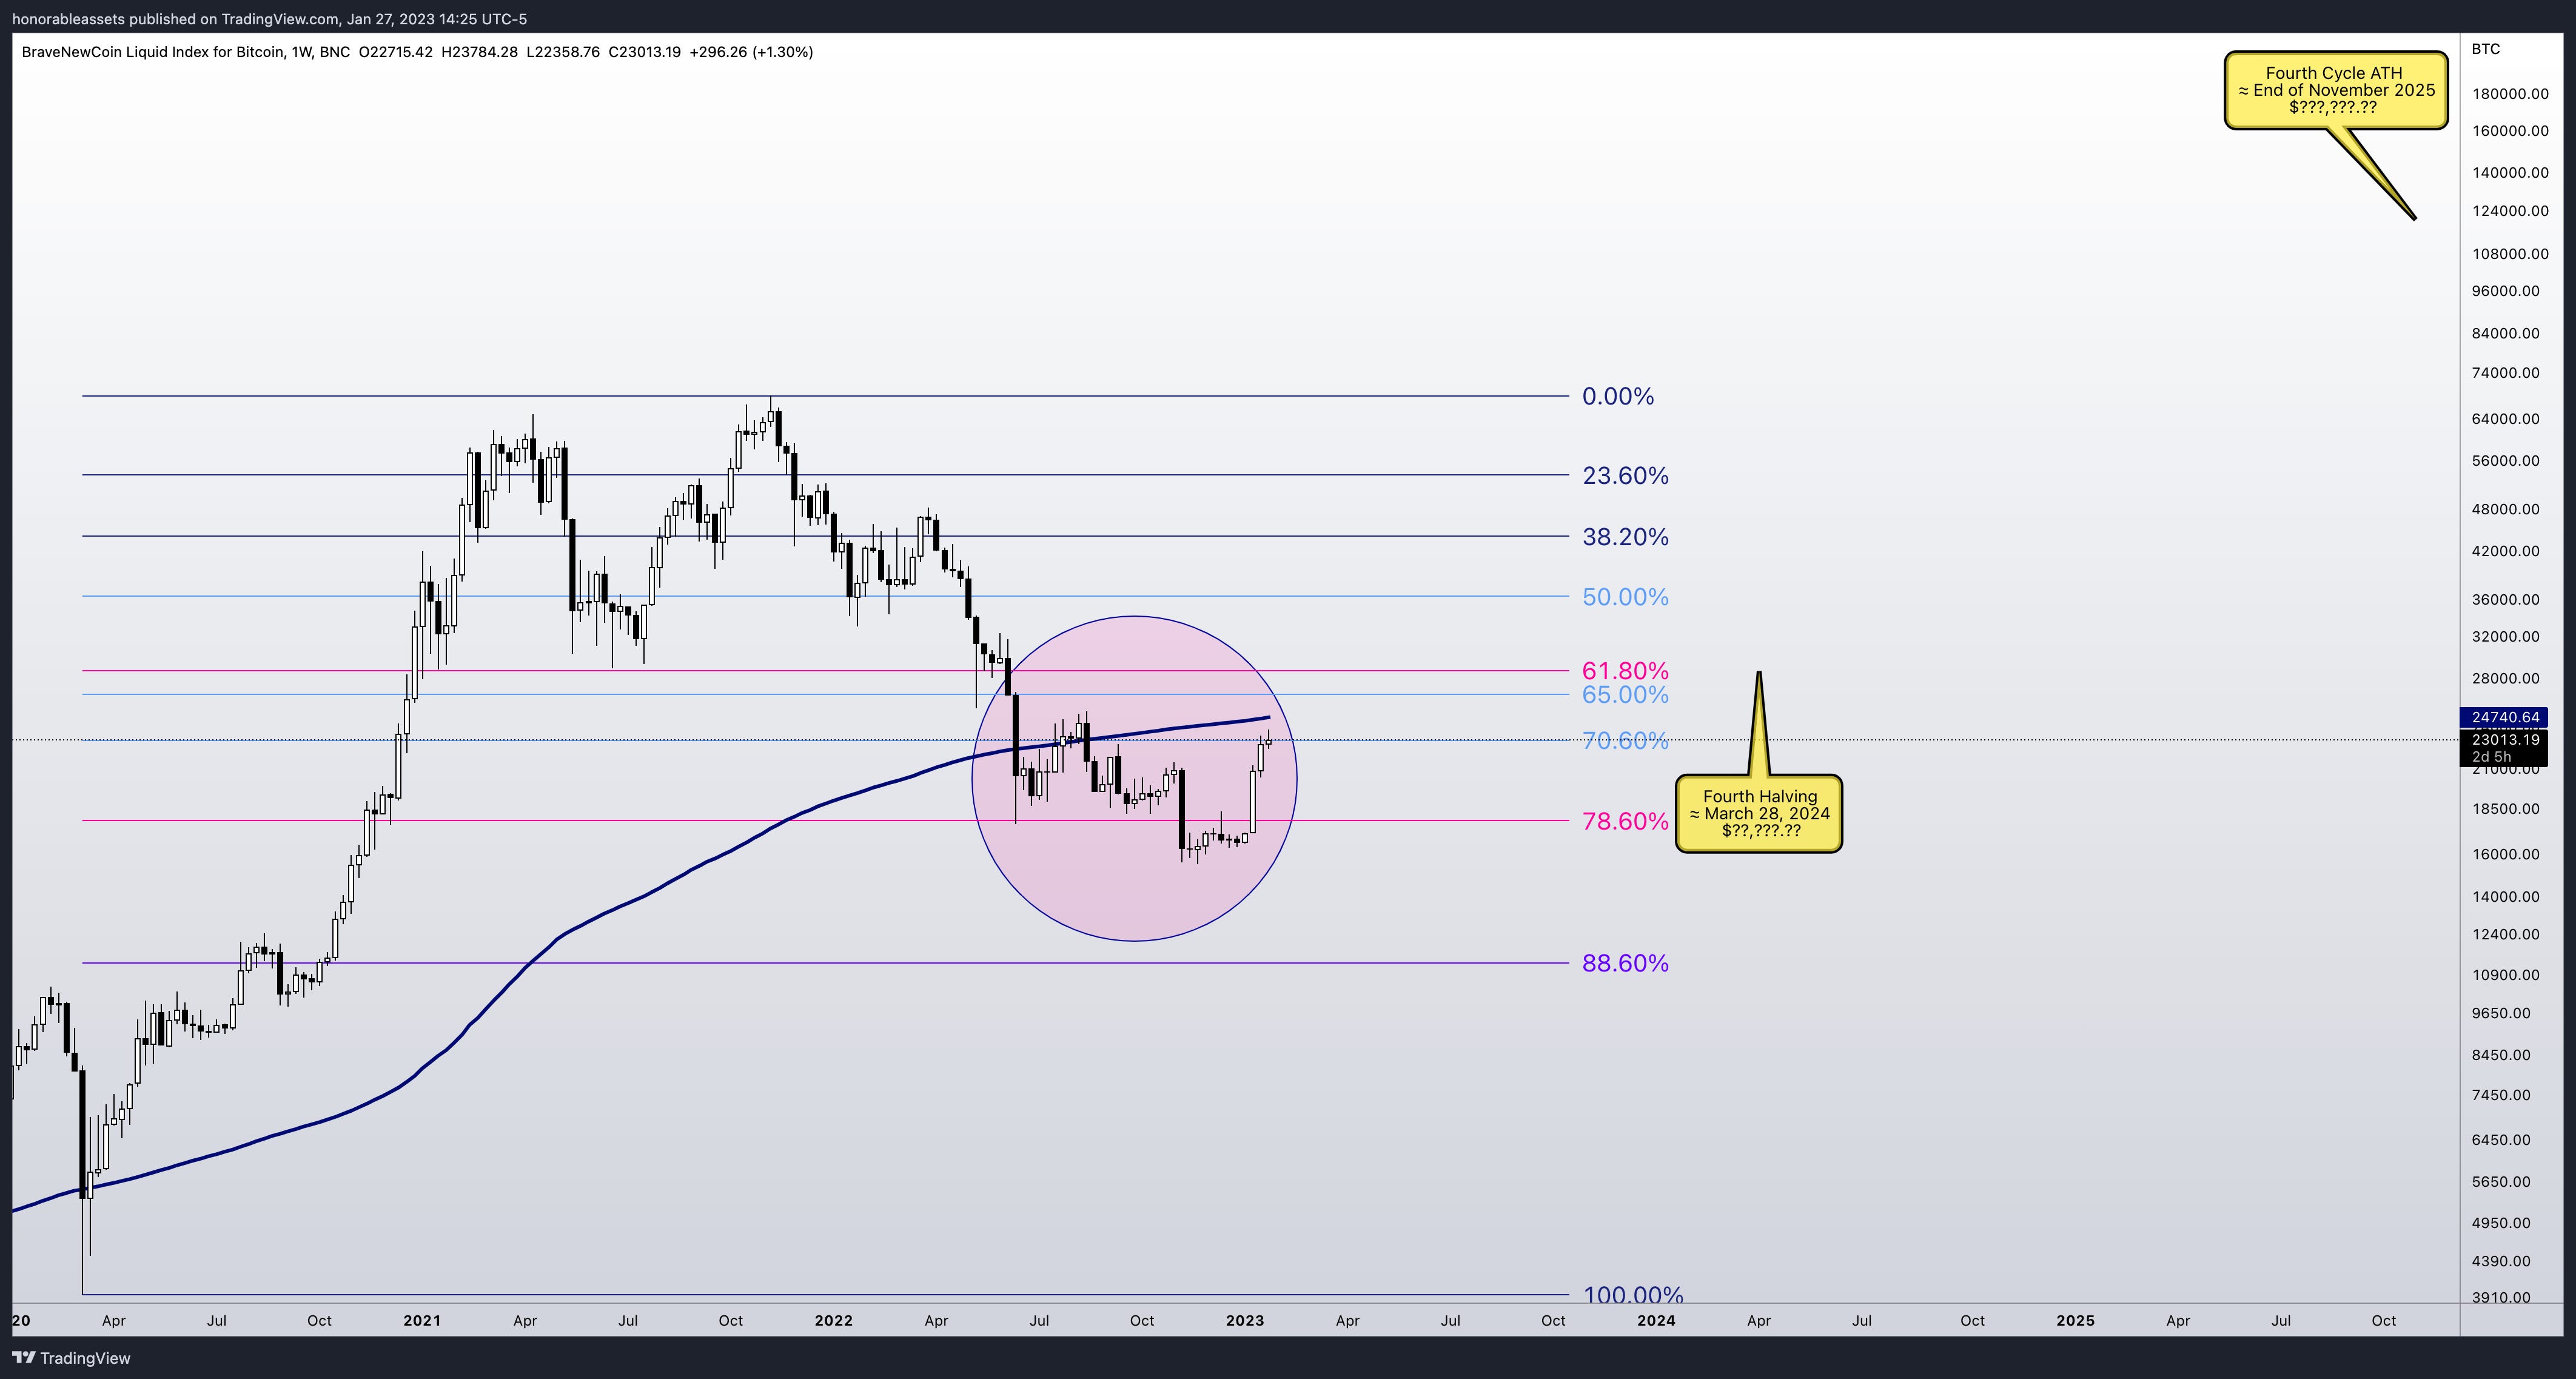
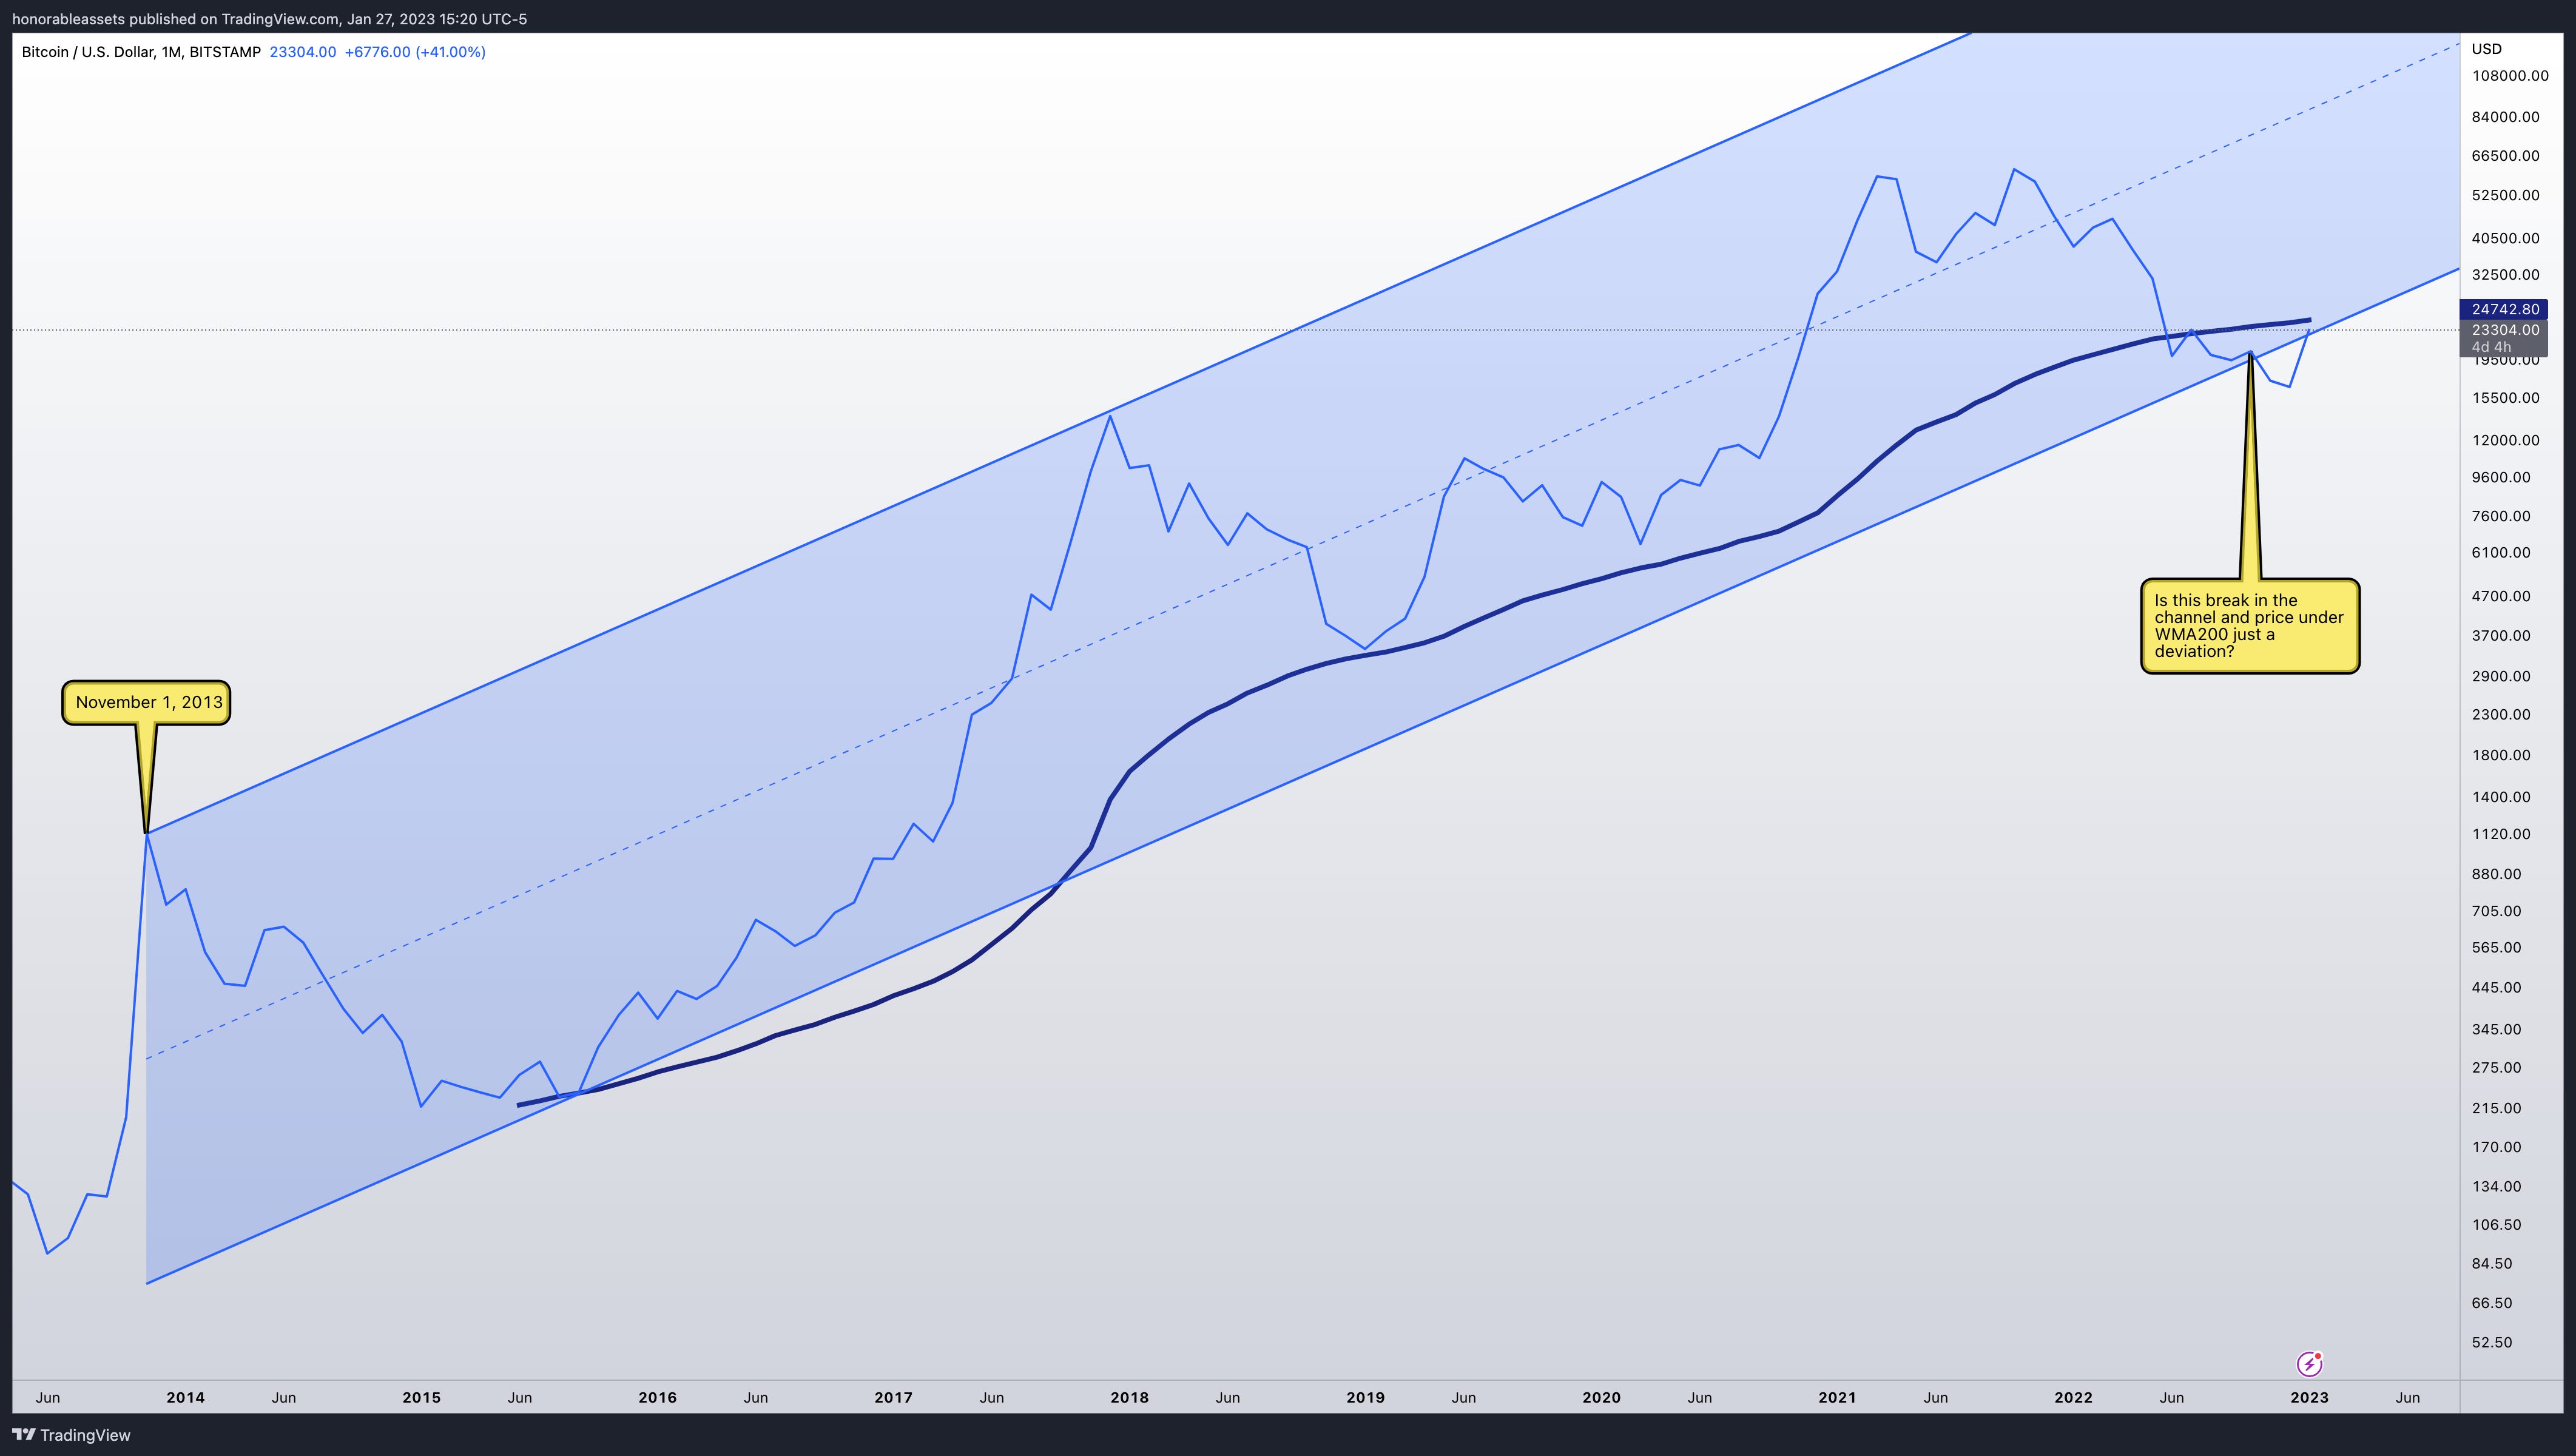
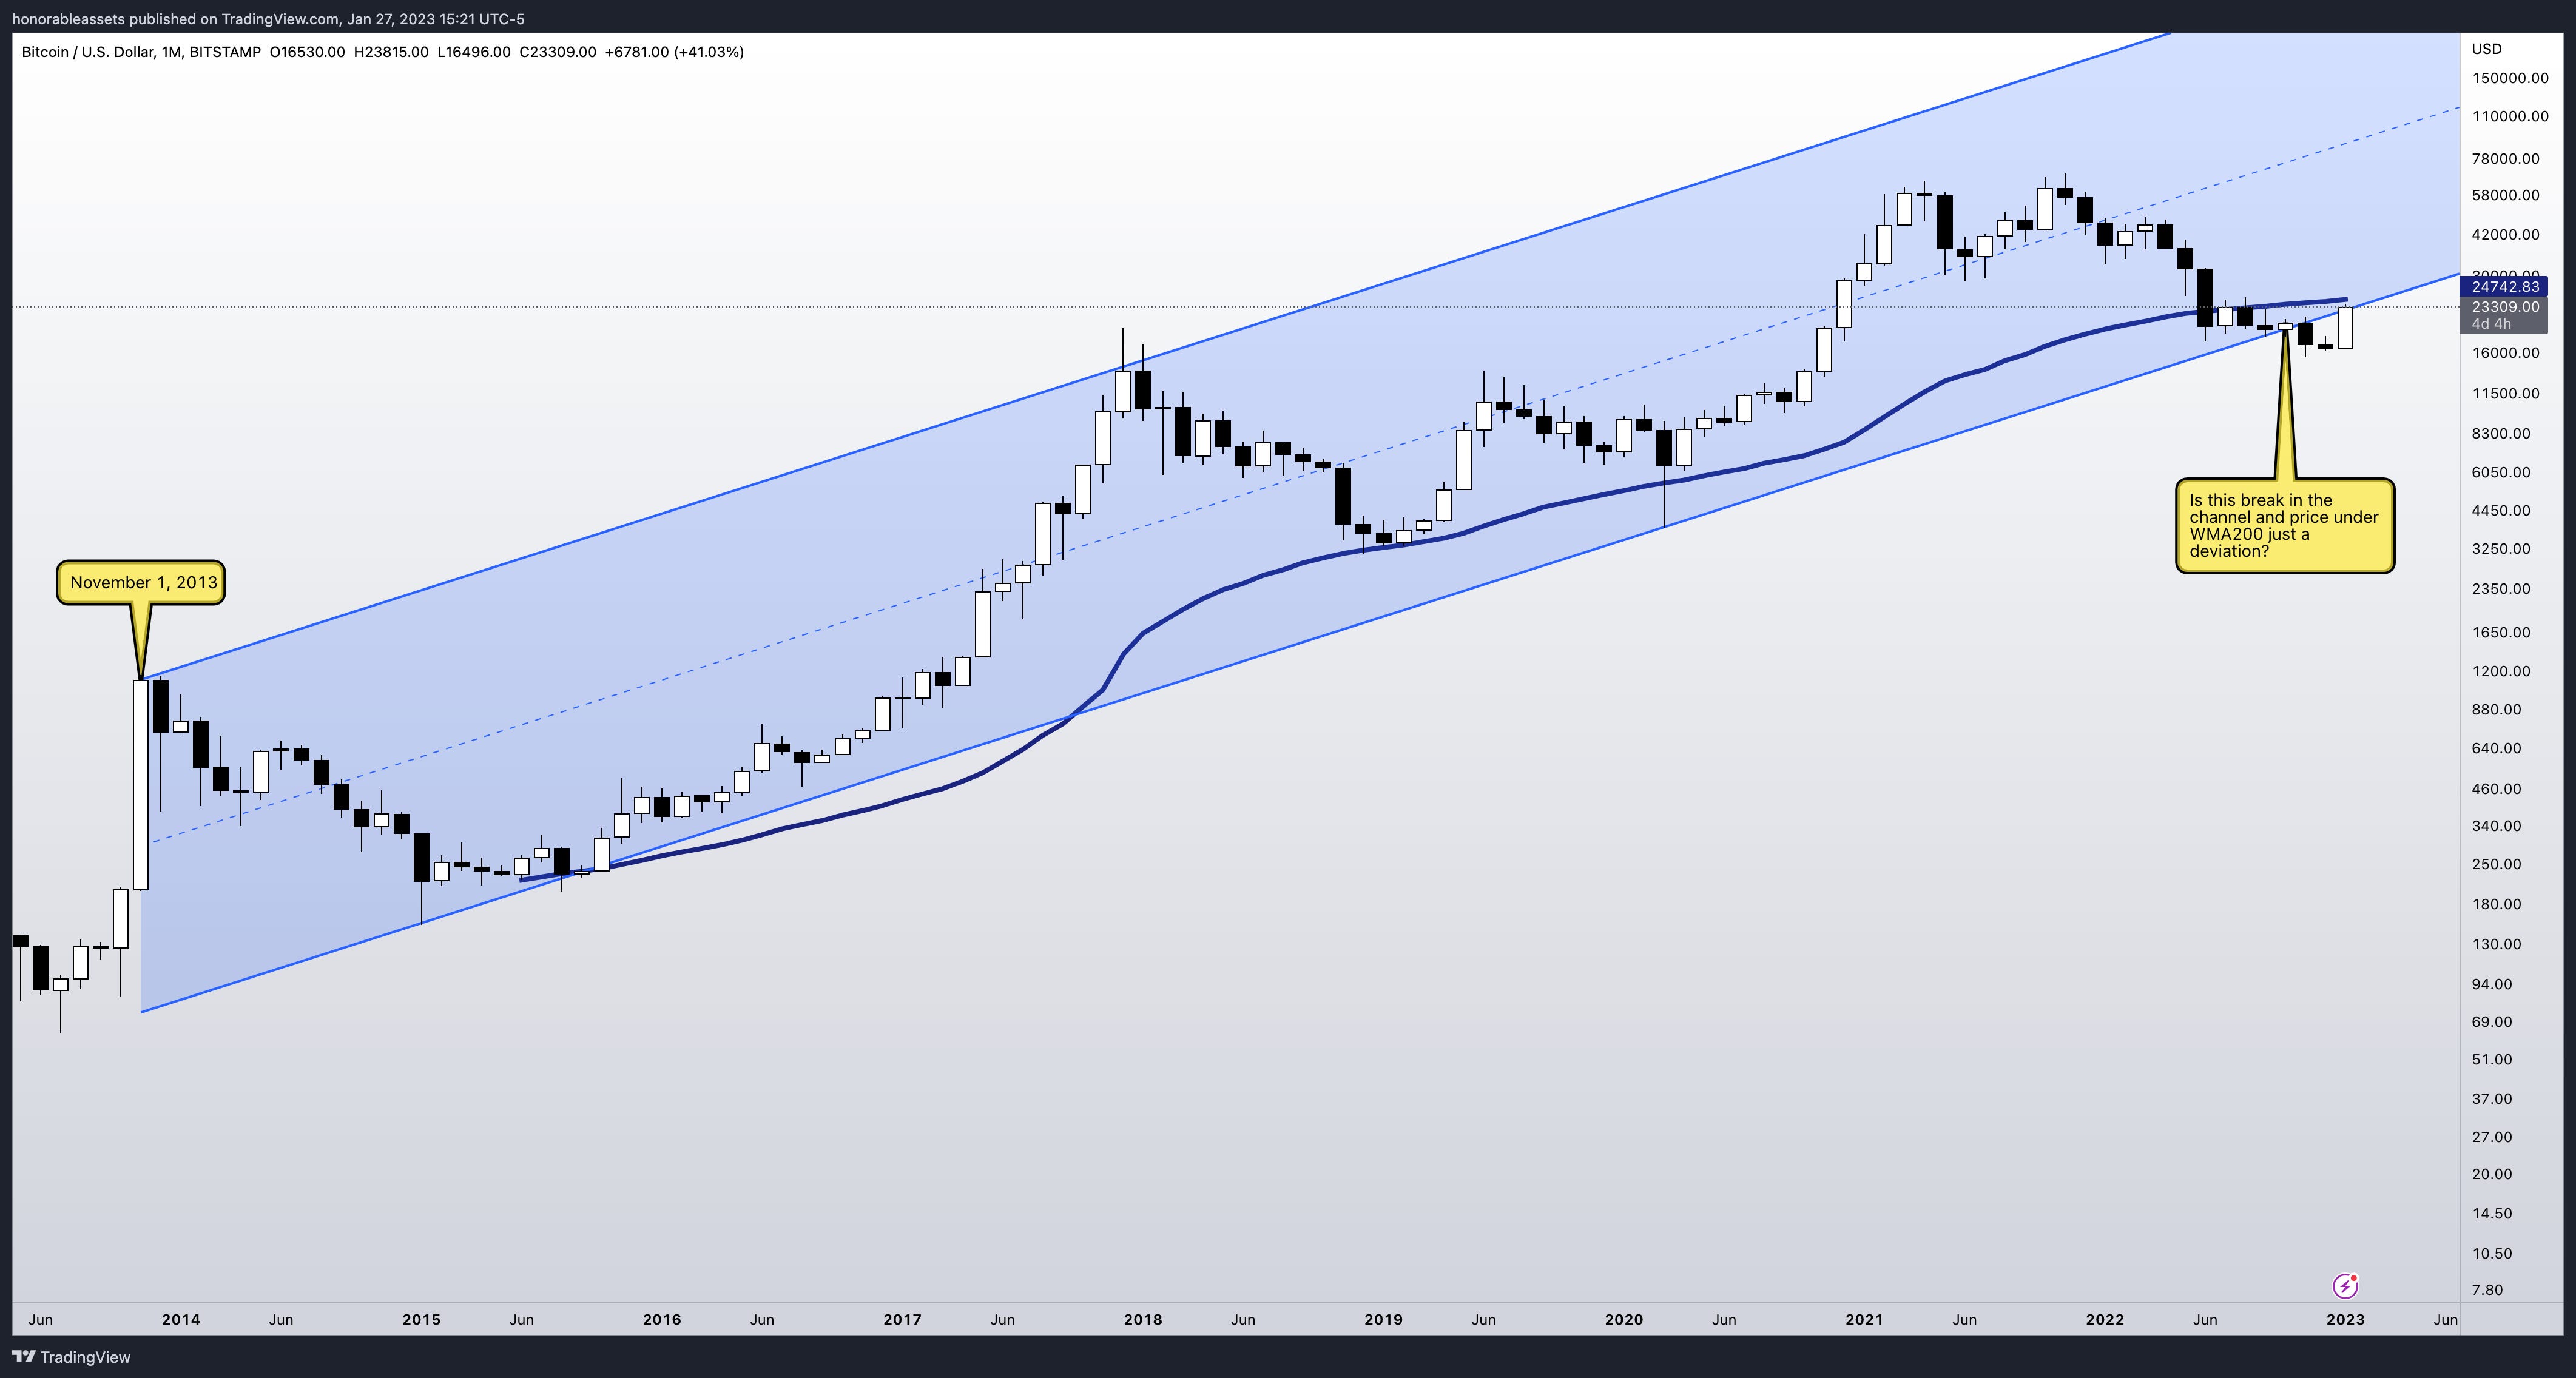
In addition, price broke down from this multi-year channel (Chart 6.1 and 6.2 below) we've been in since November 1, 2013. I would love to see a strong price reclaim the WMA200 and this channel break turn into a slight deviation to the downside or what is known in TA as a “Spring”. It is also worth noting that for the first in Bitcoin's price history we not only retested a previous cycle all time high but price broke through it.
At the time of writing this (January 28-30, 2023) a lot of people are starting to become euphoric and think the bull party is back on. Macro, I'm one of the biggest Bitcoin bulls walking on the face of the earth but I don't think we're out of the woods yet and this is why I am hesitant, from a TA perspective.
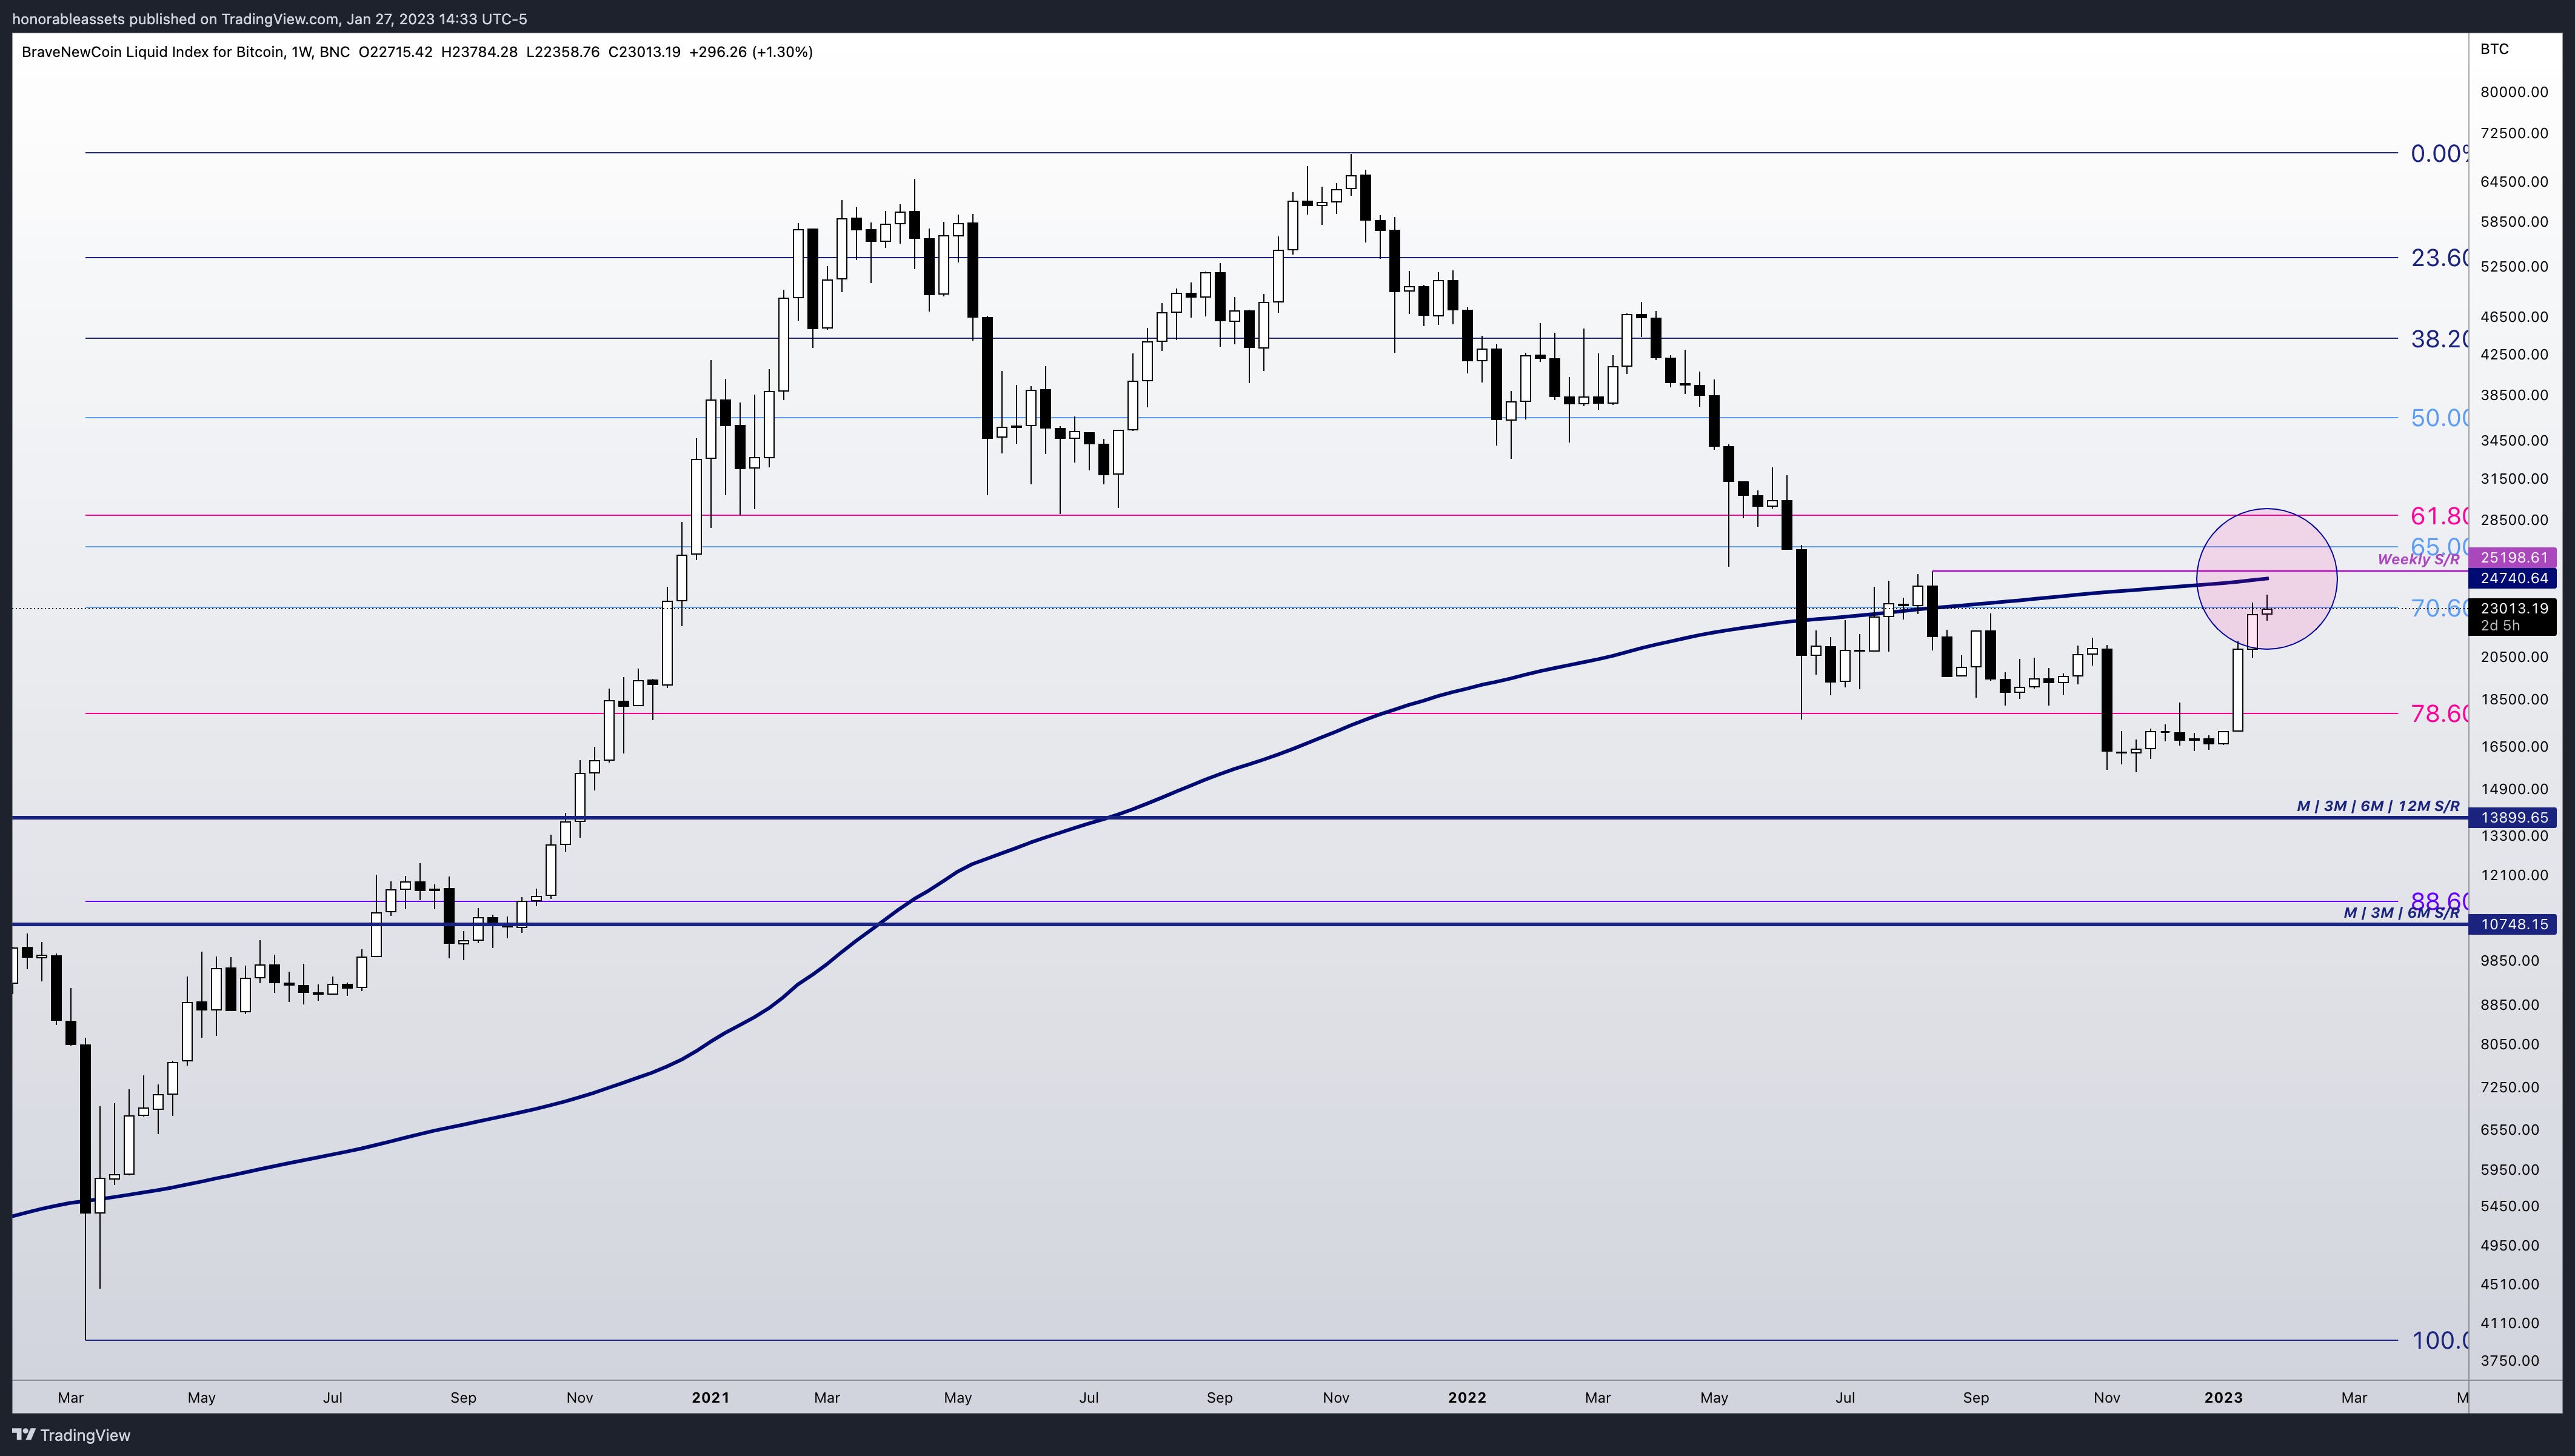
Yes, we ate up all the sell-off from the whole FTX debacle and the price has been pumping straight up. The only problem is price has been pumping straight into some hardcore resistance. In order for me to be convinced that the bull market is back I need the price to take out those highs with a strong move on some nice volume. Not only does it need to take out those highs with conviction there is also the other high time frame resistance of the WMA 200. Price also needs to avoid any bearish divergences on RSI and/or OBV.
If the bull party is on and $15,476.00 was this cycles low one would love a scenario where we see a strong relief rally turn into a dump of a modest amount and then the bull parade is on for cycle 4. Instead of setting our fib from the low to high for the bull run buy potential zone, we will flip our fibs for the sell (from high to low). This could create a nice sell zone at monthly resistance and the golden pocket in the red zone on chart 7.2 ($45,525.82 - $50,000.00). Highlighted is a green price line showing an example of how the price could play out in a scenario like this.
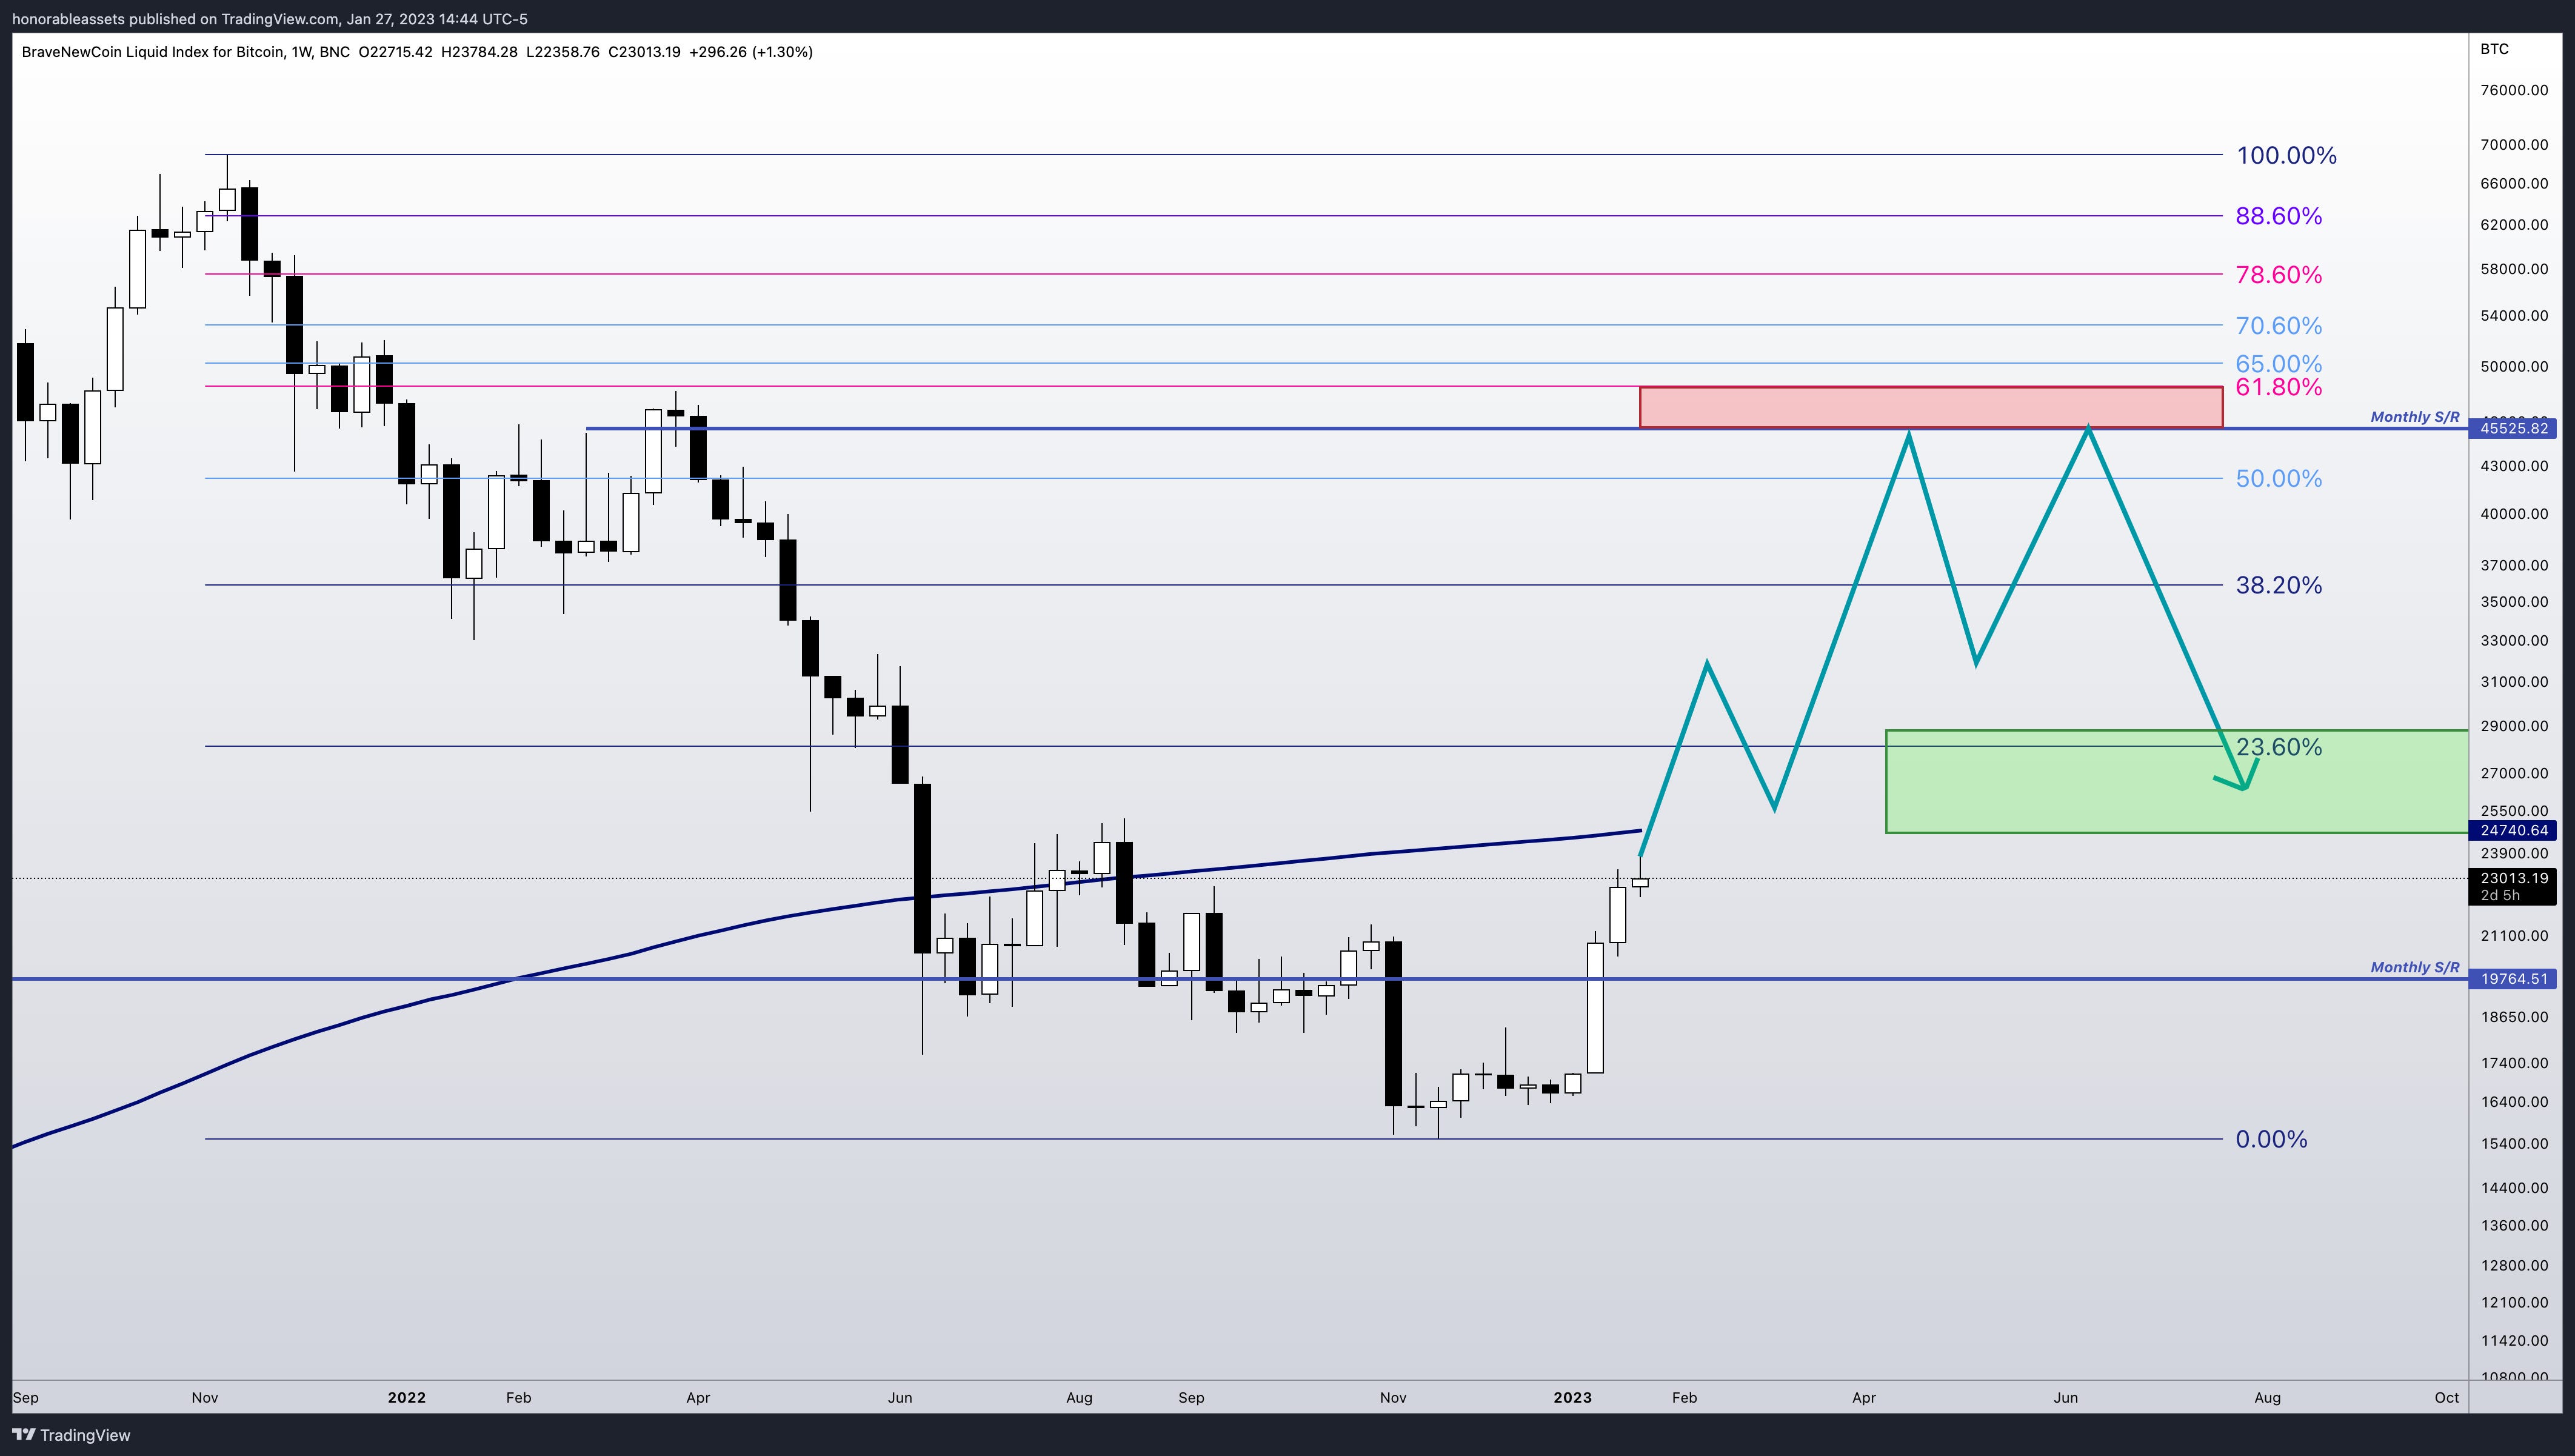
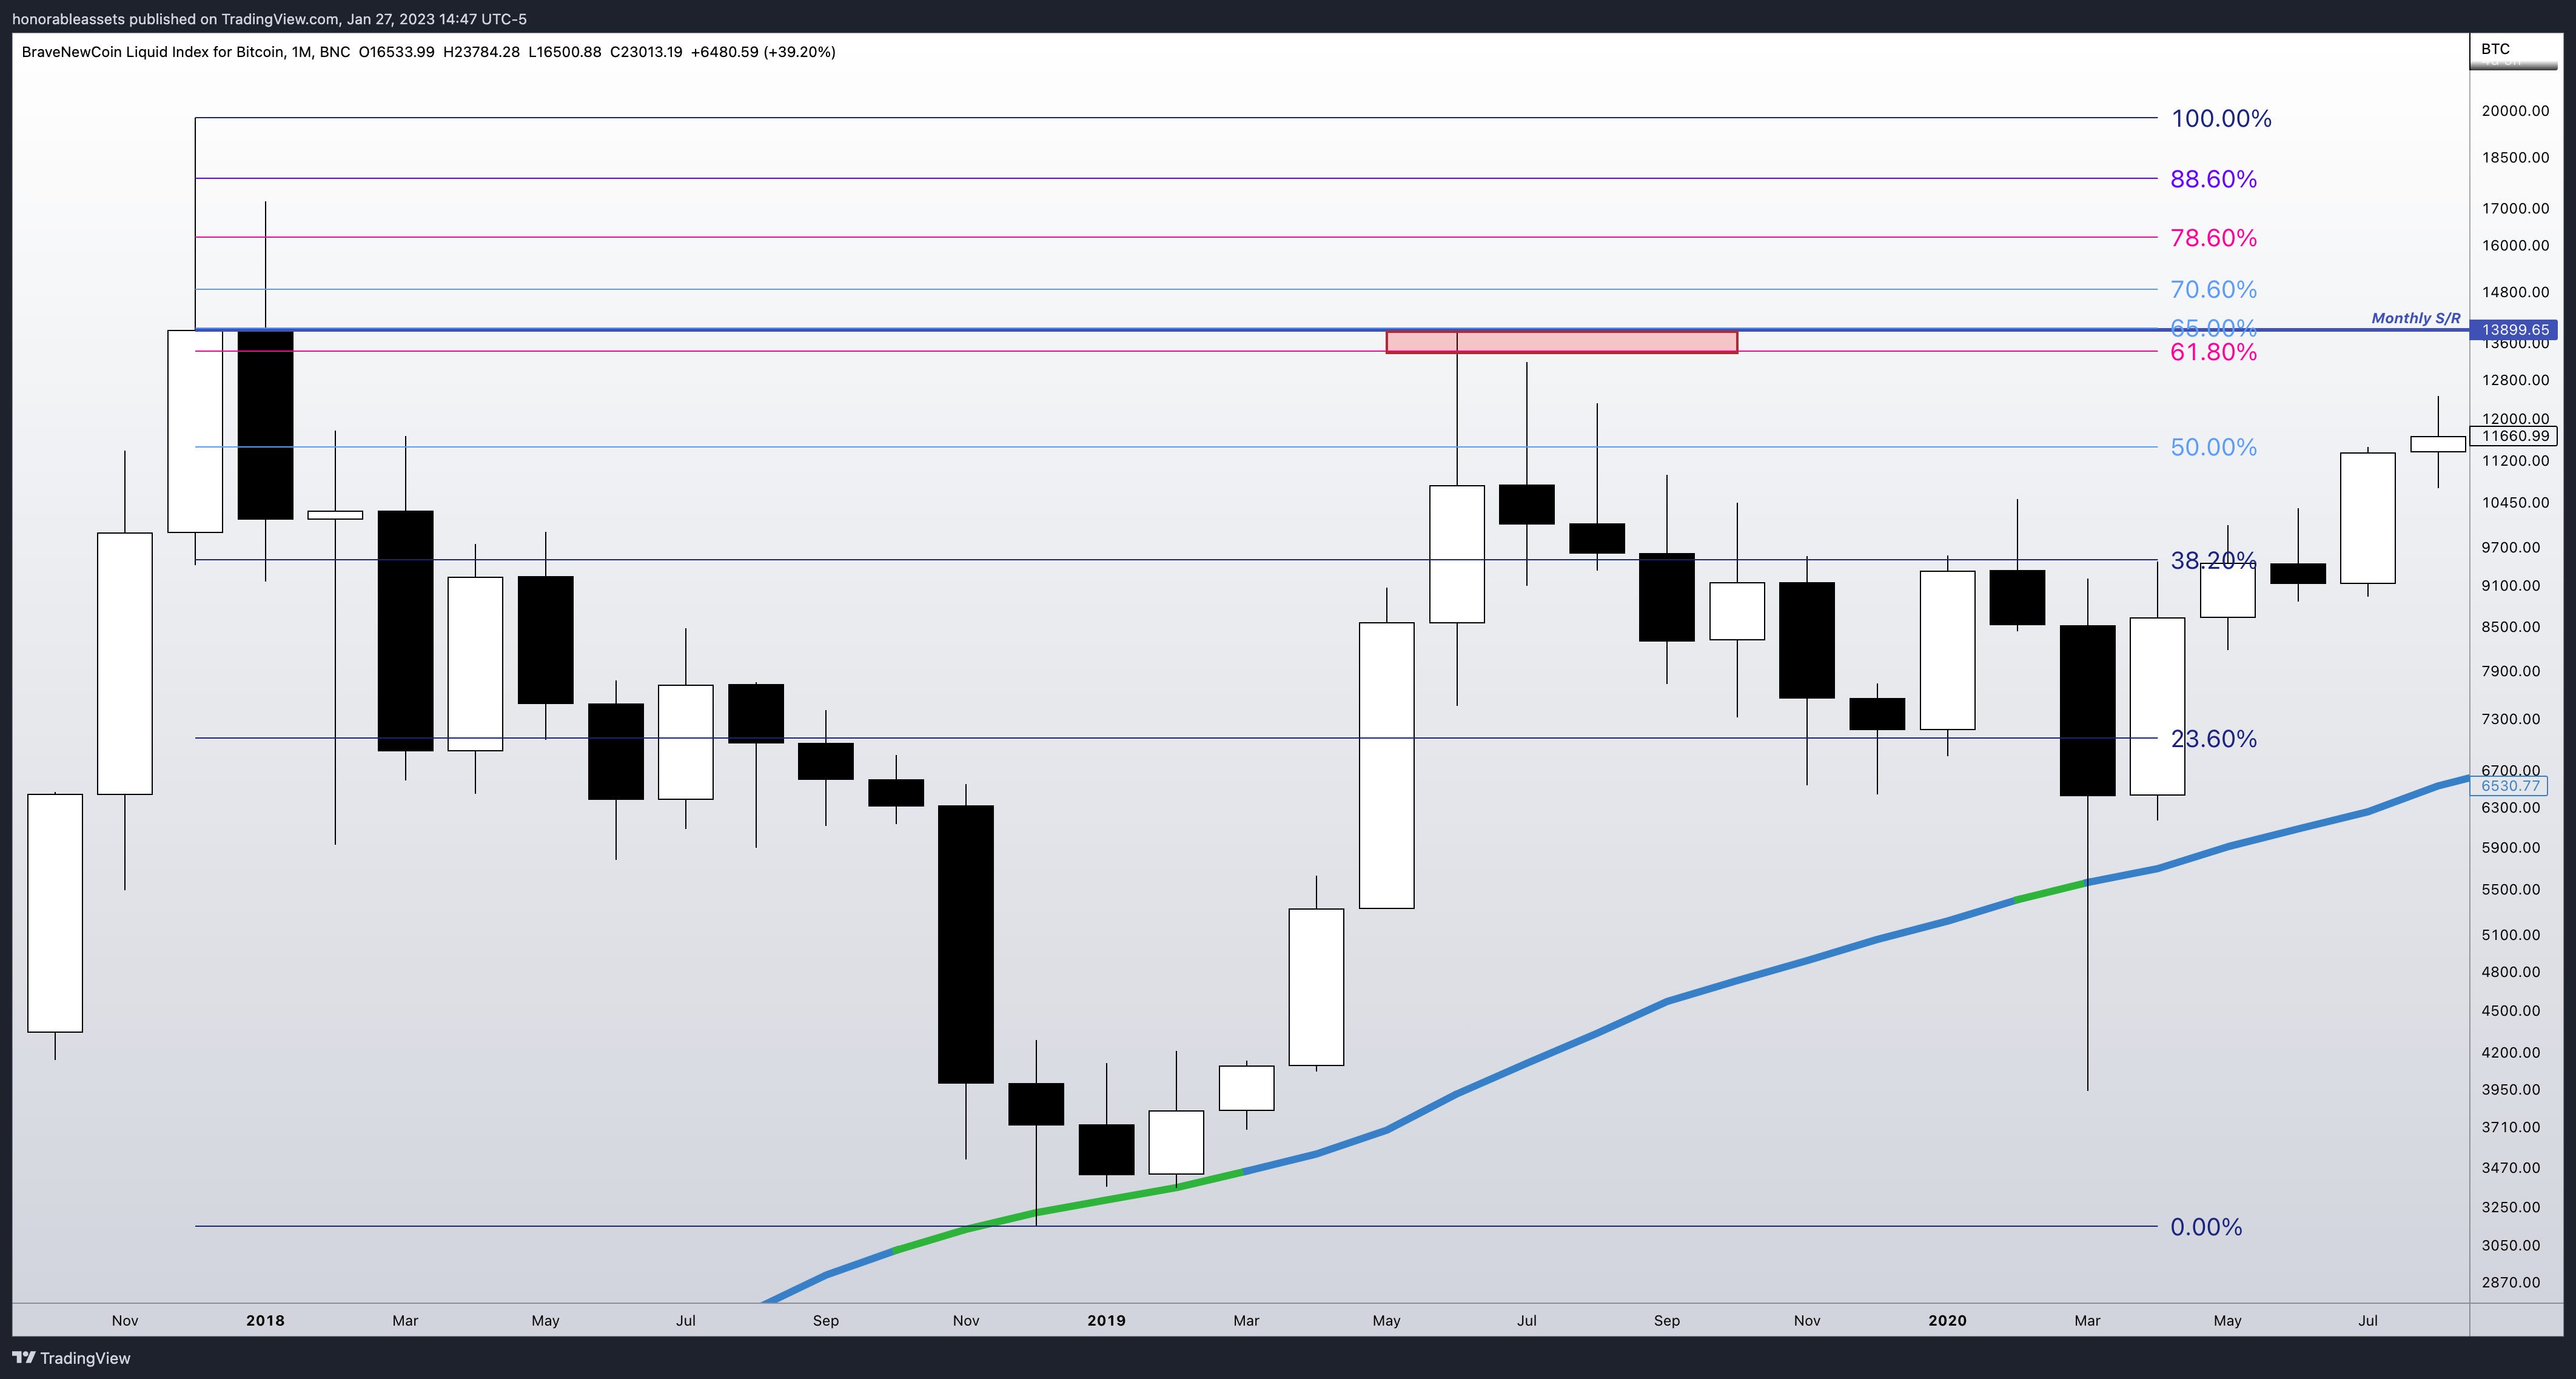
After the 2017 bull run to $20,000 we saw a relief rally that played out in a similar way. In chart 7.3 you can see the fib set from the high to the low for a high time frame sell scenario that had monthly resistance confluence at the golden pocket as well. A very similar situation to what could possibly be on the horizon for this current halving cycle.
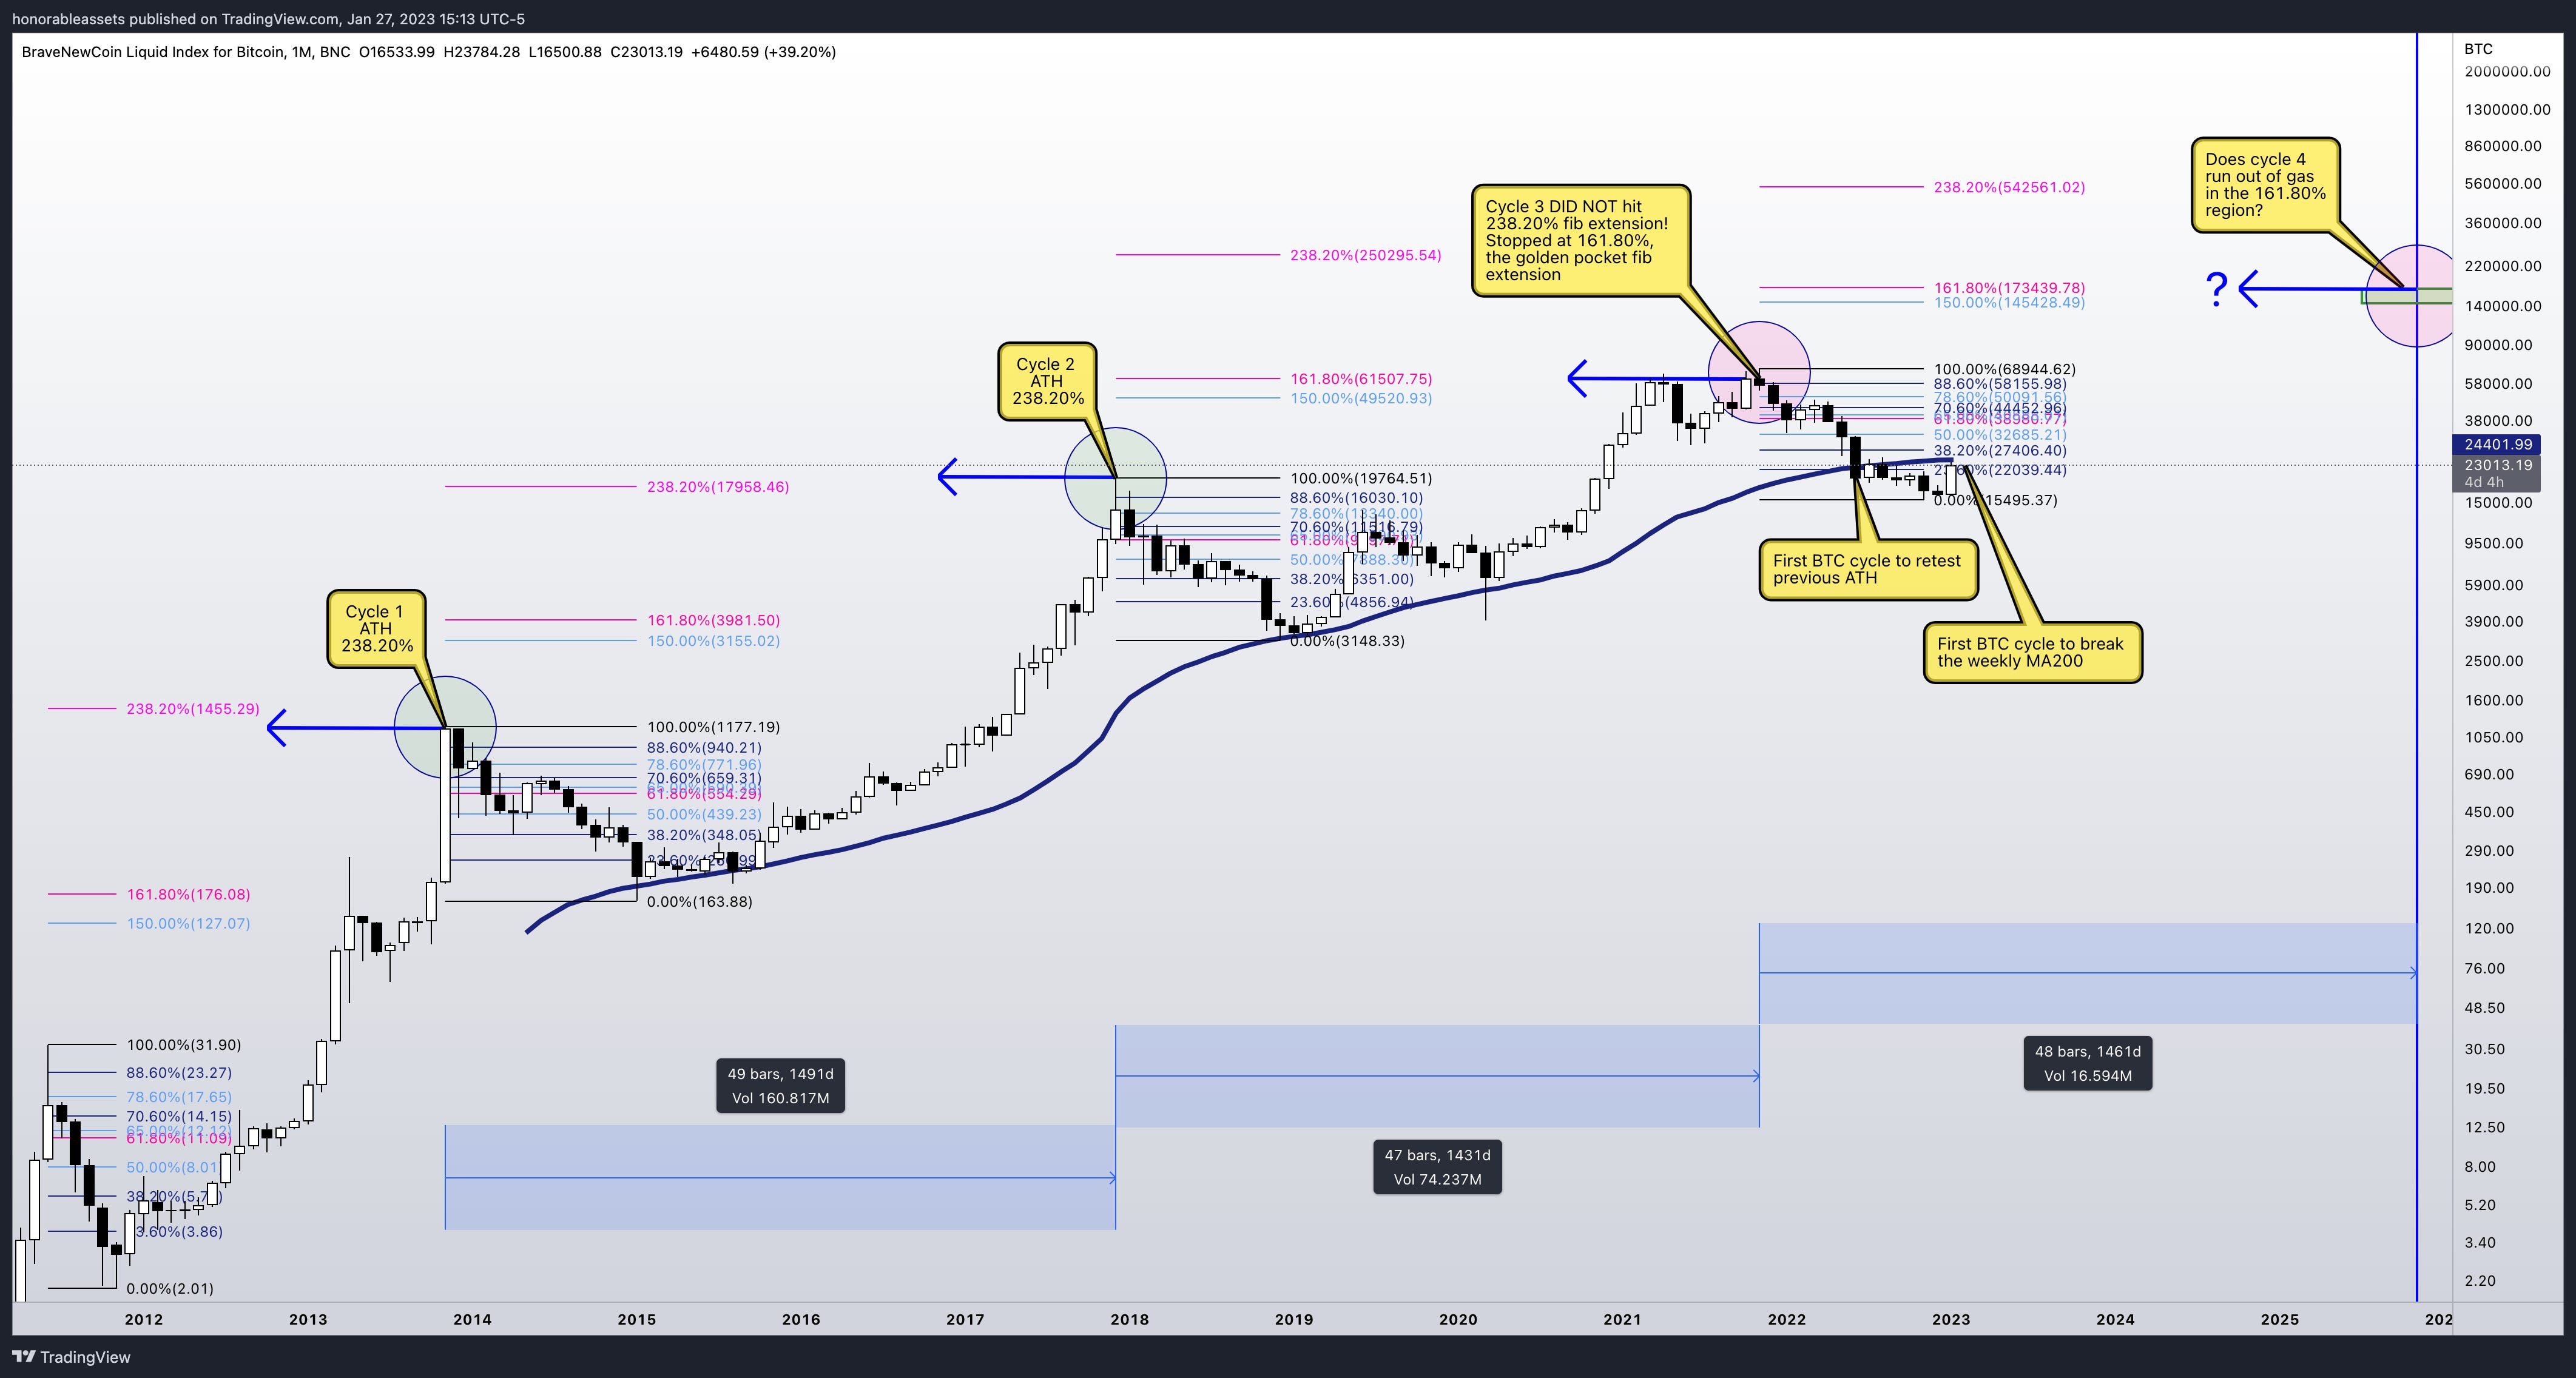
This next chart is an interesting observation; the fib extension model. In the example below we're using the 150.00%, 161.80%, and 238.20% fib levels. In cycles 1 and 2, prices peaked at the 238.20% level. Cycle 3 did not hit the 238.20% fib extension and instead ran out of gas at the 161.80%.
Does the next cycle run out at the 161.80%? Who knows, this is just an observation that stood out and caught my eye. Selling is a bit more tricky compared to buying because in my opinion more emotions are involved. My best advice is to learn TA in depth so you can spot high time frame bearish trends and patterns.
Below are bonus charts of each cycle overview and halving cycles 1, 2, and 3 with the percentage gain from the halving to all time high. Can’t go wrong with more visuals, right?
I hope you enjoyed this perspective on the best long-term investment opportunities for Bitcoin using technical analysis. Remember, nobody knows for sure where markets are going and if you hear crazy price predictions about an asset it's probably a bunch of nonsense for likes and follows. Why I used information from past cycles to show what possibilities could be on the horizon for this current halving cycle and future cycles.