

Around the Block | 10
Bitcoin‑Only Macro & Technical Recap

Bitcoin enters the new year in a markedly different phase than where it began the last expansion. What was once impulsive upside has transitioned into structured digestion across every major timeframe. The yearly chart continues to consolidate above former cycle highs, the monthly remains in a defined corrective regime, and the weekly is now shifting from downside resolution into balance and base development. Beneath the surface, network fundamentals remain firm: hashrate sits near cycle highs, miner behavior reflects resilience rather than stress, and Bitcoin continues to hold its place among the world’s largest assets despite macro tightening and volatility.
This issue breaks down where Bitcoin stands in that transition. We examine the secular structure on the yearly chart, the ongoing correction and key inflection levels on the monthly, the emerging stabilization on the weekly, and how miner economics and global asset positioning reinforce the broader picture. As always, this is a Bitcoin-only analysis focused on structure, probability, and context. No noise. No distractions.
None of this is financial advice.
Don’t trust, verify.
Let’s dive in.
TL;DR
Bitcoin remains in a secular bull trend on the yearly timeframe, consolidating above former all-time highs with no topping structure in place.
The monthly chart confirms a mid-cycle correction, with the 34 EMA near 75K acting as the primary downside magnet if weakness persists.
Weekly price action is stabilizing between 90K–94K, with rejection candles and declining volume signaling seller exhaustion rather than breakdown.
Hashrate continues to stair-step higher near cycle highs, confirming strong miner conviction despite compressed margins.
Average mining costs remain above spot, but stress has stabilized as price recovery narrows the gap and no miner capitulation is evident.
Bitcoin holds its position as a top-ten global asset near a $1.9T market cap, reinforcing its maturity and resilience during consolidation.
The Technicals
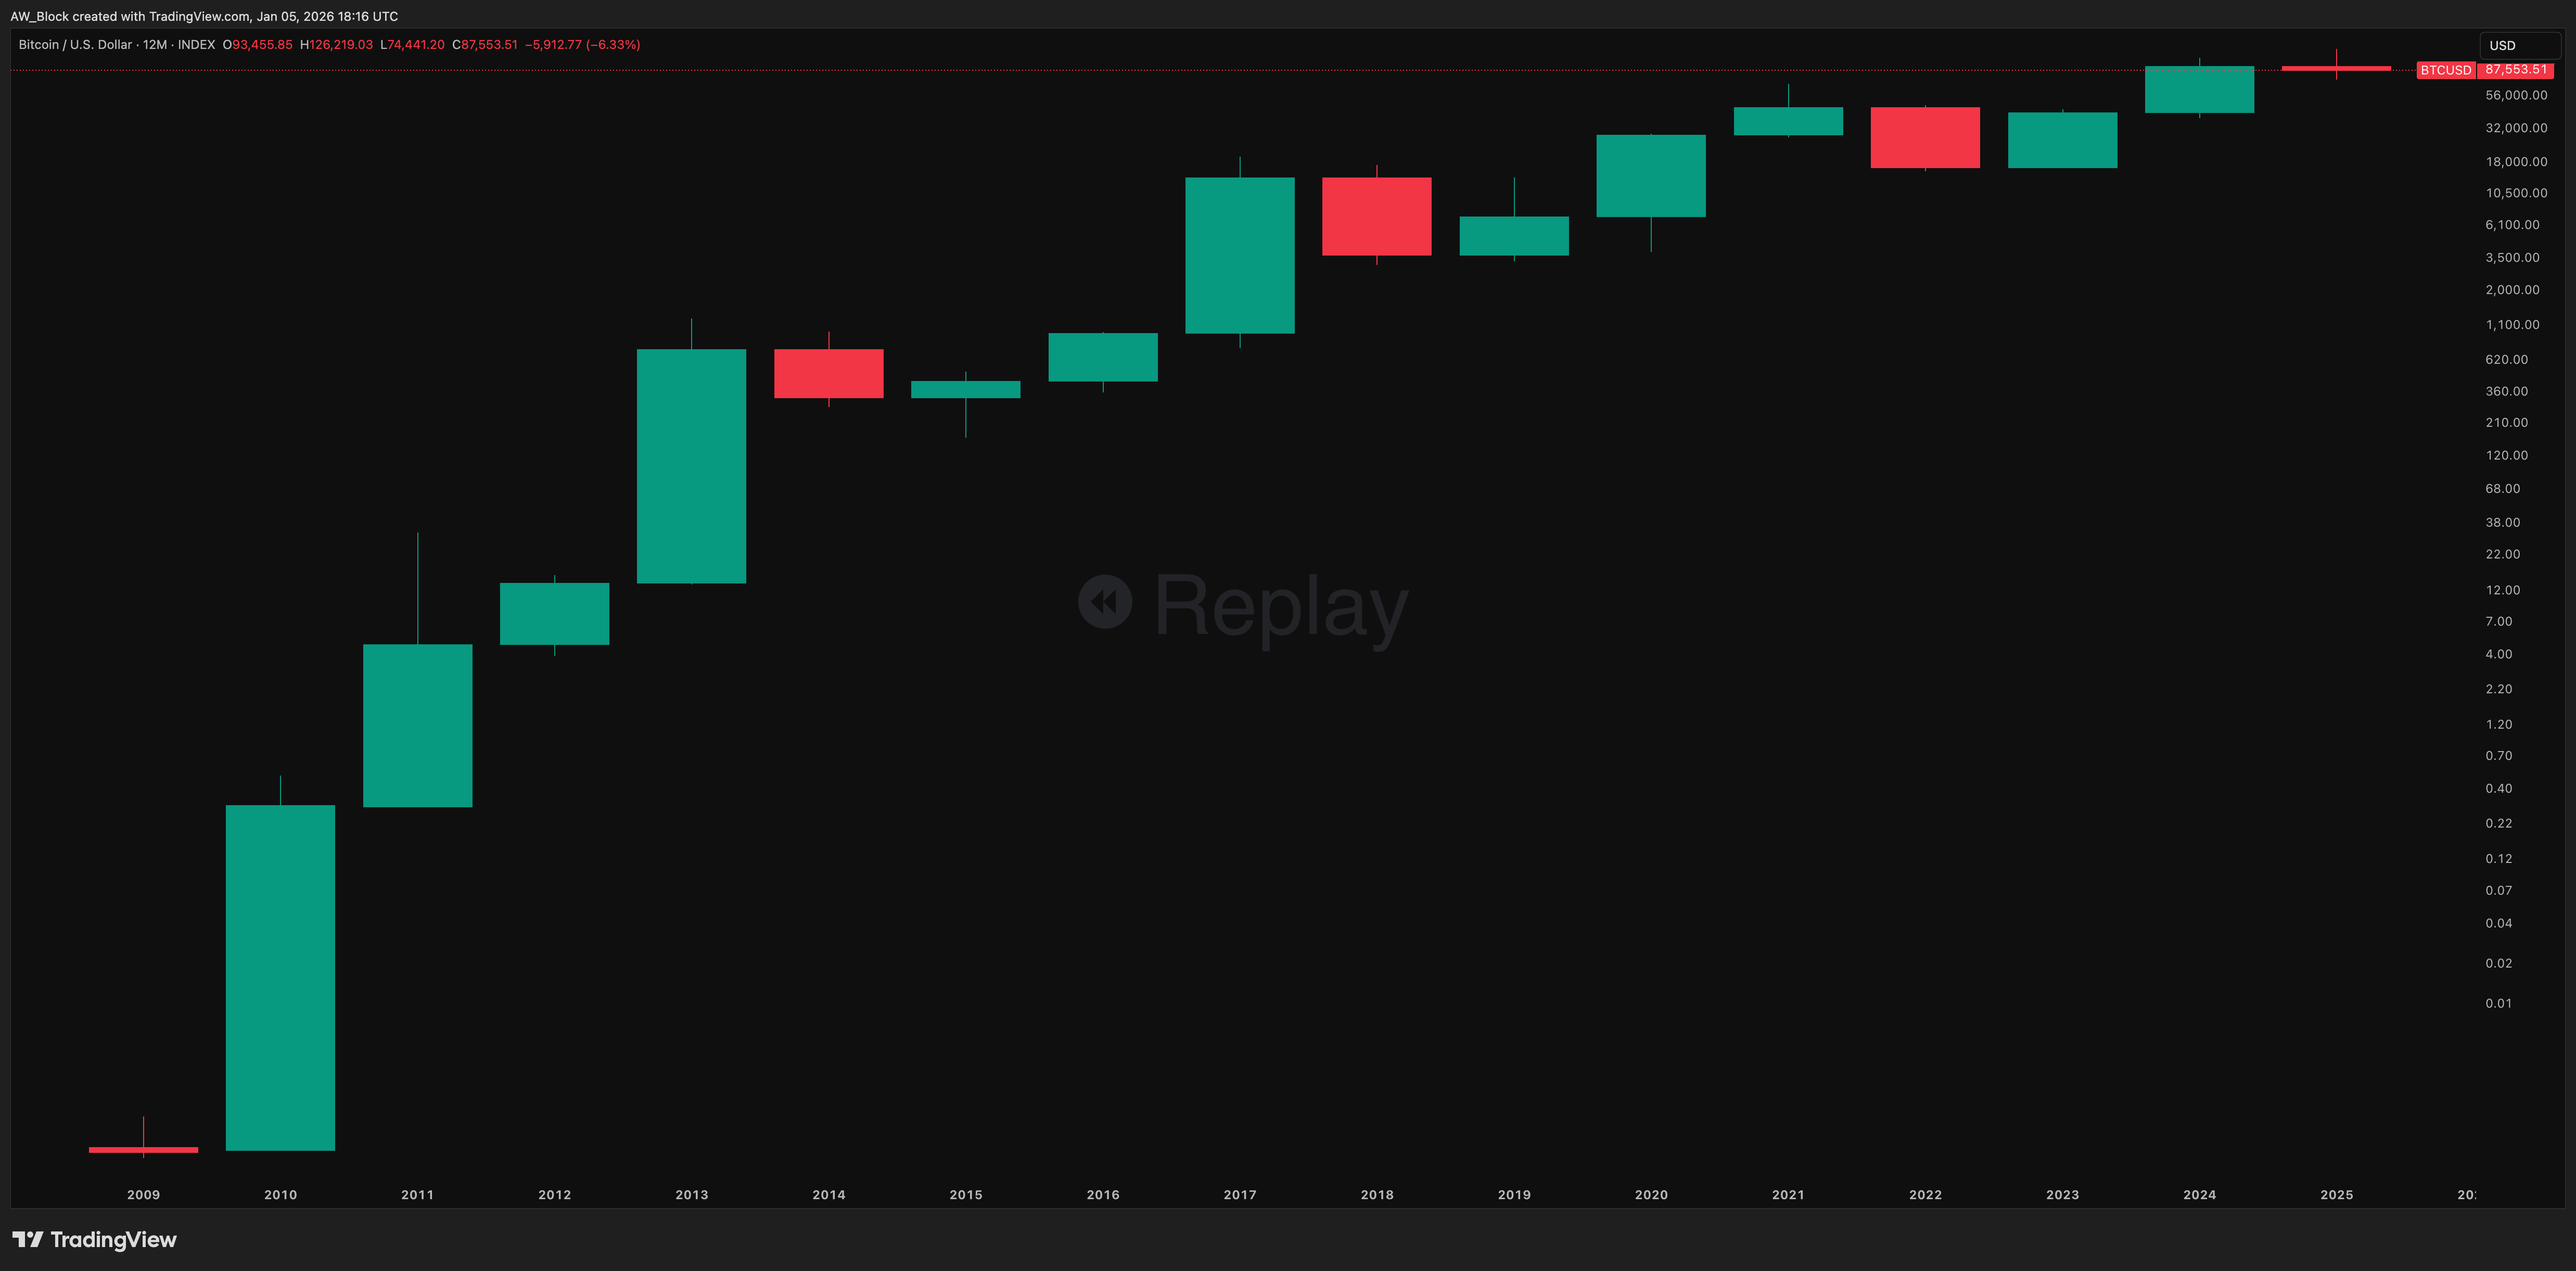
Yearly
Open: ~93.4K
High: ~126.2K
Low: ~74.4K
Close: ~87.5K
Key Levels
Y S/R (Mid): ~$46K–$69K → Former breakout region; current consolidation band
Yearly Trend EMA: ~$50K → Rising and currently below price, acting as long-term dynamic support
Structure
Bitcoin’s yearly structure remains secularly bullish, defined by uninterrupted higher highs and higher lows across cycles. Each major corrective phase has resolved above the prior cycle’s breakout zone, preserving long-term polarity.
The closing year reflects consolidation above former all-time highs, consistent with historical post-expansion digestion phases rather than distribution.
Candlestick Behavior
The most recent yearly candle qualifies as a High Wave Spinning Top:
Small real body relative to total range
Long upper wick indicating supply interaction near highs
No decisive downside follow-through
Within Nison’s framework, this signals indecision and equilibrium at elevated prices, not reversal. Contextually, it appears after a strong expansion year, reinforcing its interpretation as a pause rather than exhaustion.
Trend & Technical Alignment
Price remains above the rising yearly trend EMA.
No yearly close has occurred below long-term dynamic support.
Volatility has contracted relative to nominal price growth, reflecting structural maturation.
Trend integrity remains intact.
Yearly Summary
The yearly chart continues to reflect consolidation at altitude within an intact secular uptrend. The current candle represents digestion, not reversal. As long as price holds above long-term trend support and prior breakout levels, the dominant bullish structure remains unchanged.
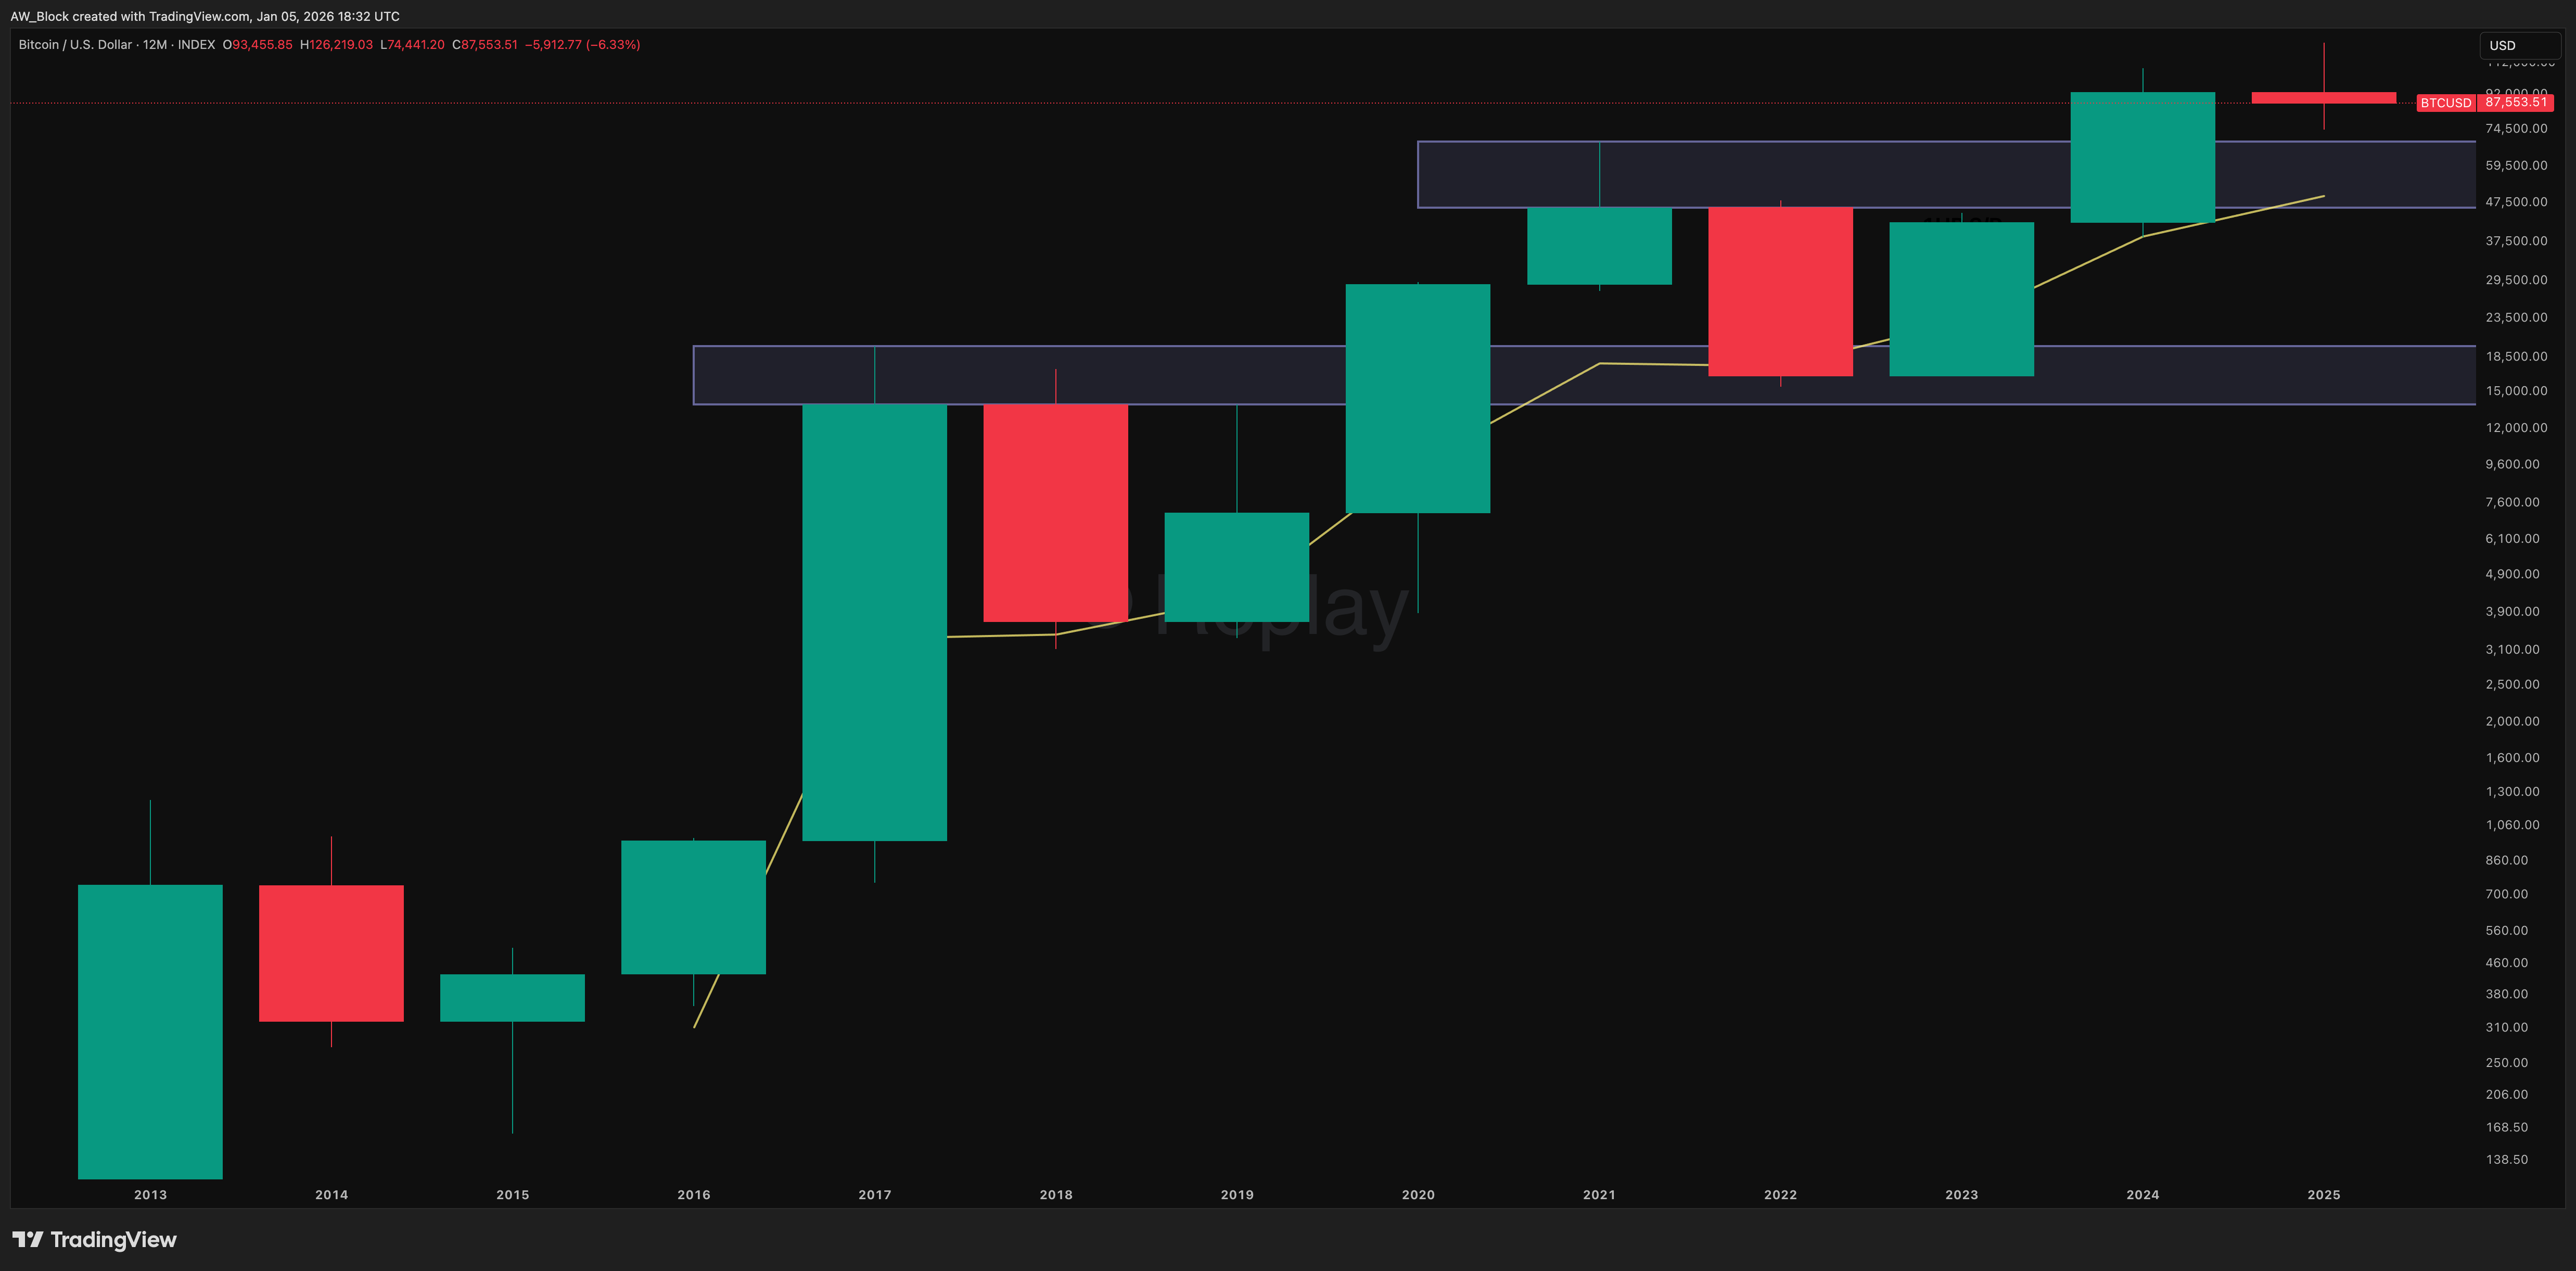
Monthly
Open: ~90.4K
High: ~94.7K
Low: ~83.9K
Close: ~87.5K
Key Levels
M S/R (Upper Block): ~$102K–$109K → Prior support turned resistance; failed reclaim
M S/R (Lower Block): ~$59K–$74K → Next major structural demand
8 EMA: ~98.5K → Decisively broken; now dynamic resistance
34 EMA: ~75.4K → Rising mid-trend equilibrium and primary downside magnet
50 MA: ~56K → Long-term structural anchor
Structure
Monthly structure has transitioned from impulsive expansion to a confirmed corrective phase. Despite the weakness, higher-timeframe structure remains intact. This is a correction within a secular uptrend, not a macro breakdown.
Candlestick Behavior
The current monthly candle extends the prior sequence of bearish follow-through:
October: Bearish rejection near highs
November: Large bearish continuation candle
Current month: Further downside extension with limited lower wick
Psychology:
Sellers remain in short-term control below the 8 EMA.
Buyers are not yet showing aggressive defense, suggesting the market is still seeking equilibrium lower.
This is not capitulation behavior; it is controlled, methodical selling consistent with a mid-cycle correction.
Pattern Context
Price action since the highs continues to respect a descending consolidation / rectangle:
Flat-to-slightly rising support now weakening
Lower highs pressing price downward
Trend & Moving Averages
8 EMA: Broken and sloping down → confirms corrective regime
34 EMA: Rising → defines healthy trend structure and likely reversion target
50 MA: Rising steadily → confirms macro trend remains bullish
Trend state: Correction / mean reversion, not reversal.
Volume Analysis
Volume expanded on the initial breakdown and has since moderated. This supports:
Validity of the move
Absence of panic selling
Behavior aligns with distribution resolving into reaccumulation lower, not trend failure.
Outlook
Bullish Continuation:
Conditions: Hold above ~$70K–$75K and stabilize near the 34 EMA
Expectation: Base-building before renewed expansion
Neutral / Retest Scenario:
Conditions: Continued trade below below the 8 EMA
Expectation: Sideways-to-down grind toward the 34 EMA
Bearish Extension:
Conditions: Monthly close decisively below ~$70K
Expectation: Deeper structural test, still within long-term uptrend
Monthly Summary
The monthly chart confirms Bitcoin is in a defined corrective phase following a major expansion. Loss of the 8 EMA and failure to reclaim former support signal ongoing downside risk toward the rising 34 EMA, which remains the most important structural level below. Until buyers reclaim the $102K–$109K region, the path of least resistance remains lower, within an intact macro bullish trend.
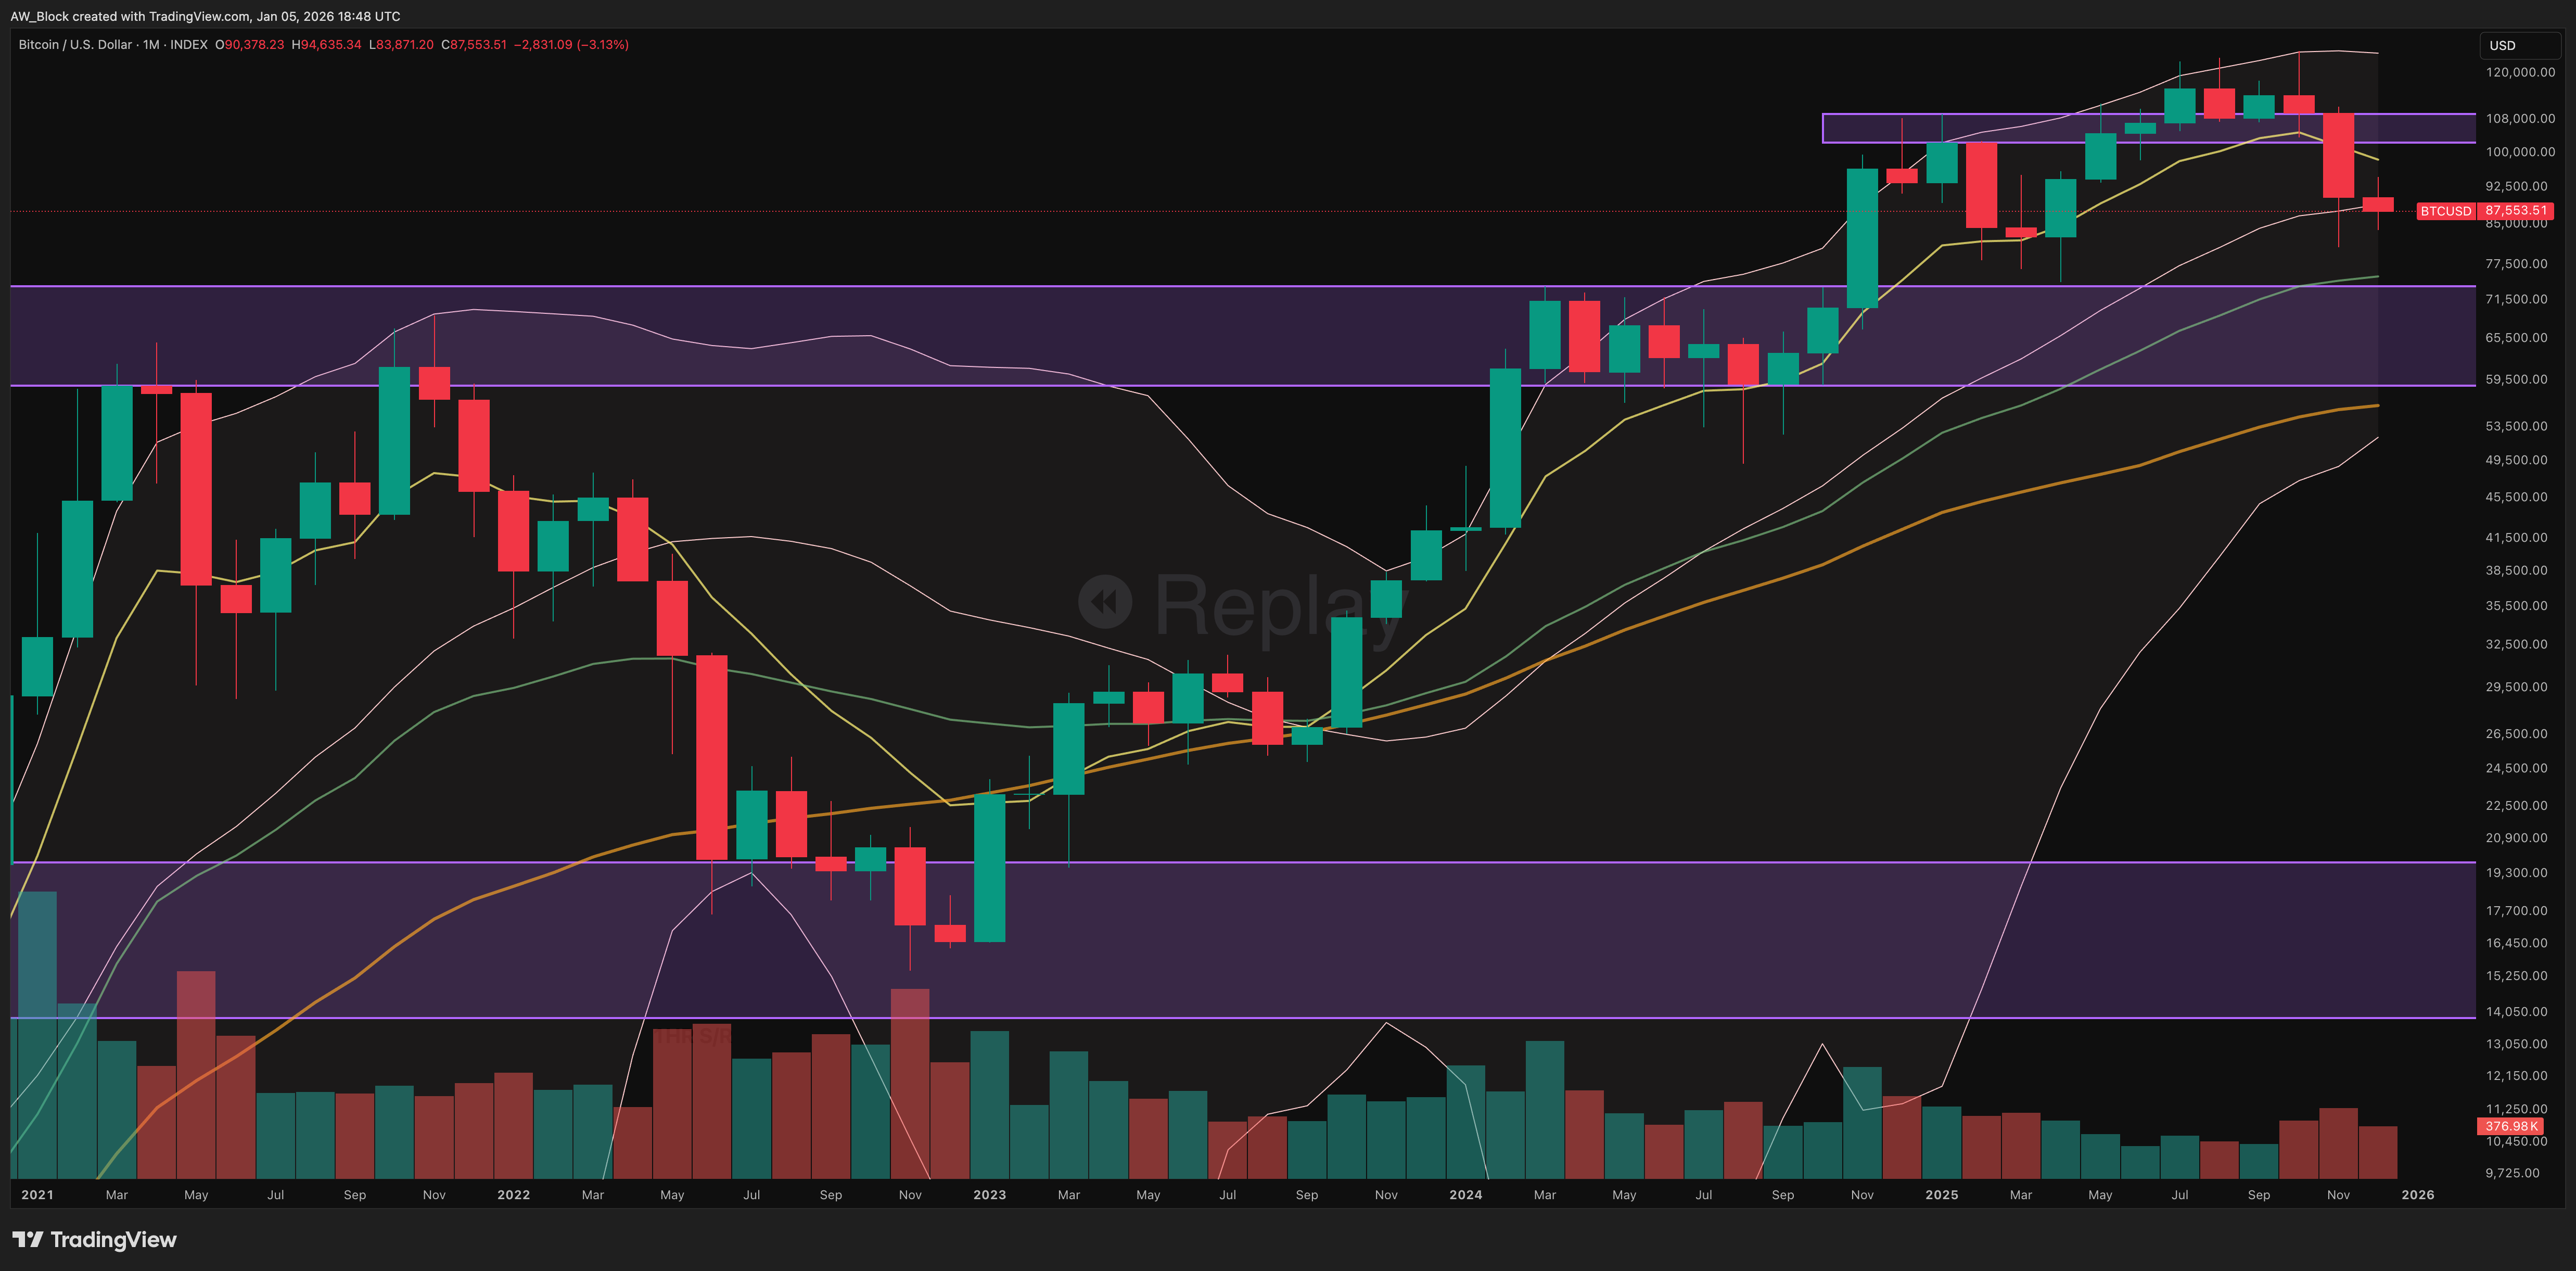
Weekly
Open: ~87.9K
High: ~91.7K
Low: ~86.7K
Close: $91.4K
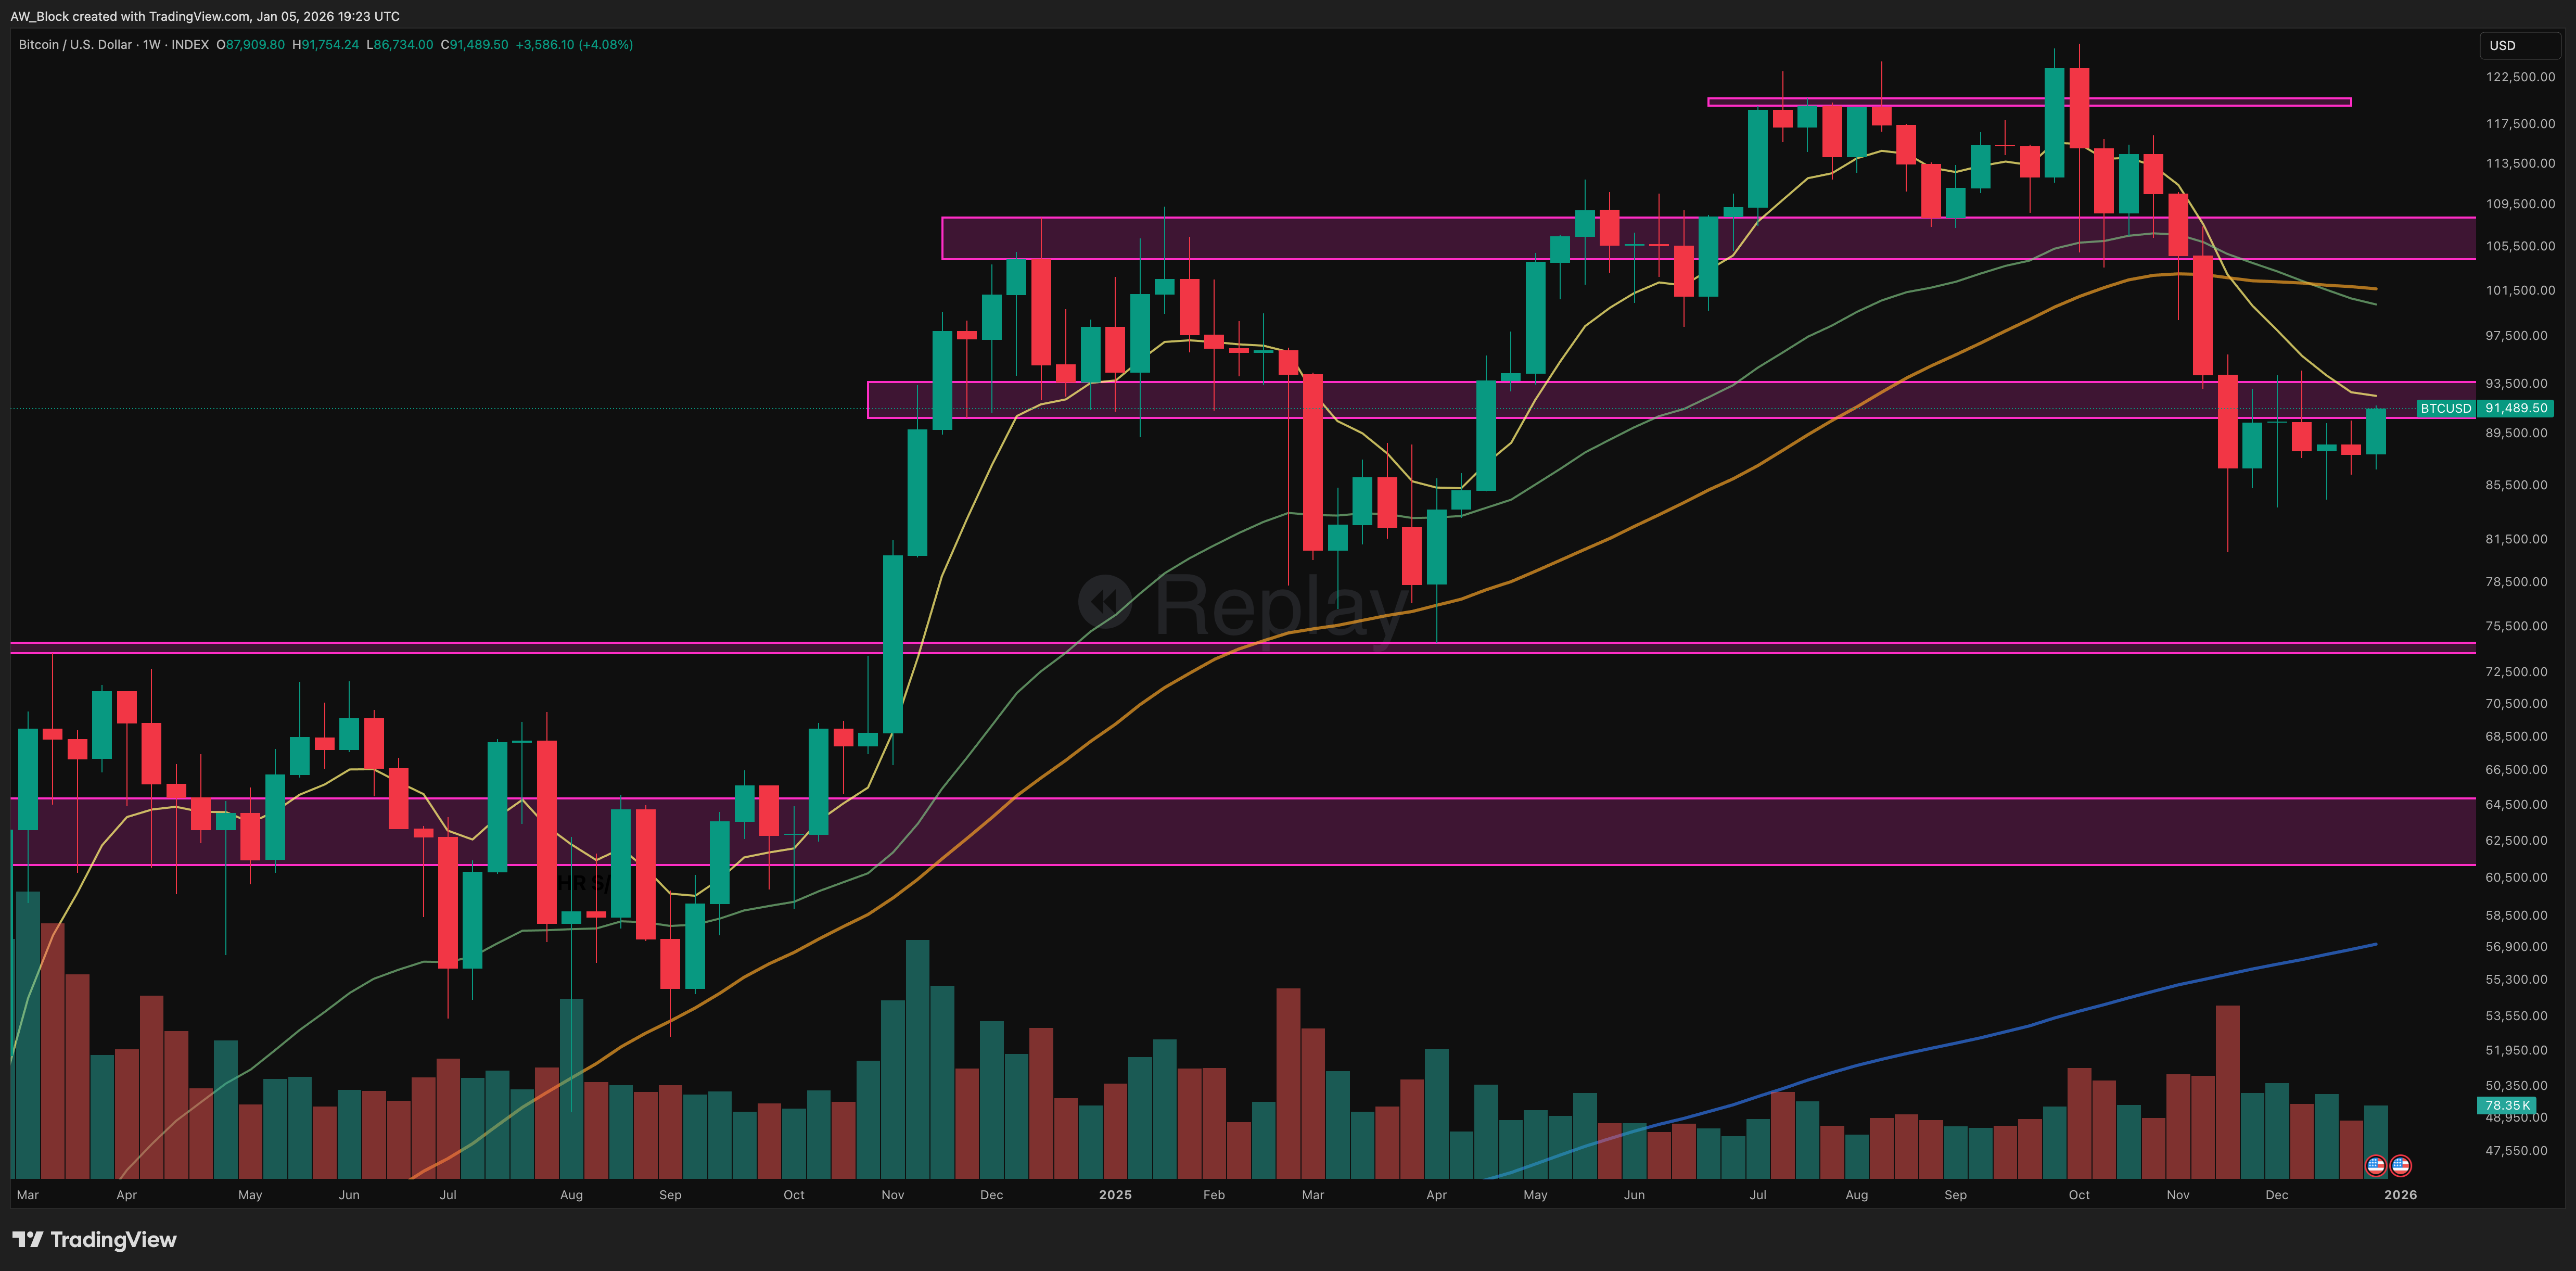
Key Levels
W S/R: ~$119K–$120K → Cycle rejection zone.
W S/R: ~$104K–$108K → Firm resistance after breakdown.
W S/R: ~$91K–$94K → Current battleground.
W S/R: ~$73K–$75K → Macro structural higher-low
8 EMA: ~92.5K → Down-sloped, immediate resistance
34 EMA: ~100.3K → Declining, mid-trend resistance
50 MA: ~101.7K → Untouched, long-term structural guide
200 MA: ~57K → continues to confirm that the macro bull cycle remains structurally intact.
Structure & S/R Zones
Bitcoin remains in a corrective sequence, now trading fully inside the $91K–$94K weekly S/R band.
This confirms:
Mid-trend structure is broken
Macro structure remains intact
$90K–$94K is the active decision zone
Candlestick Patterns
This week printed a rejection-type candle:
Large real body
Long lower shadow
Close in the upper half of the range
This reflects demand absorption, not a continuation-style selloff.
It is not a spinning top, hammer, or doji. Nison would classify this as a testing bar — a deep probe into support followed by recovery into the close.
Key implications:
Selling pressure was absorbed
Buyers reappeared below $90K
No capitulation signature present
“When the market sells off sharply but closes well off the lows, buyers have quietly regained footing beneath the surface.” — Steve Nison
Chart Patterns
The failed rectangle between ~$105K–$125K has fully unwound into its statistical retracement zone.
Bulkowski statistics:
Failed rectangles inside uptrends typically retrace 10–25% before stabilizing. Bitcoin has now retraced approximately 25%, satisfying this expectation.
Schabacker framework:
This remains a secondary reaction within a primary trend, not a primary reversal. The structure resembles an emerging descending corrective channel, which historically resolves upward more than 60% of the time inside bull trends.
Volume Analysis
Volume remains elevated but is declining relative to the capitulation spike, indicating diminishing selling pressure. The presence of a long lower shadow on reduced volume supports supply exhaustion, not panic. Buyer absorption is evident in the $90K–$92K zone. If volume contracts further while price holds this region, conditions favor early accumulation.
Psychological & Probabilistic Context
The rejection from ~$104K–$108K triggered emotional selling, but under Douglas’ framework this represents a probabilistic structural test, not a trend failure.
Professional focus remains on:
Structural pivots
Supply absorption
Probability shifts
“Consistent traders think in probabilities, not absolutes.” — Mark Douglas
Macro structure remains bullish until $73K is broken.
Primary Scenario — Stabilization ($90K–$94K)
Condition: Weekly closes inside range
Implication: Base development below $100K
Invalidation: Weekly close below $89K
Recovery Scenario
Condition: Reclaim 8 EMA and 34 EMA ($92.5K–$100.3K)
Continuation Risk
Condition: Close below $89K on expanding volume
Implication: Unwind toward $73K macro higher-low
Weekly Summary
Bitcoin remains in an extended corrective phase, but macro structure is unbroken.
The weekly rejection candle, volume behavior, and Bollinger Band overshoot all point to seller exhaustion, not cycle failure.
Bitcoin / Gold
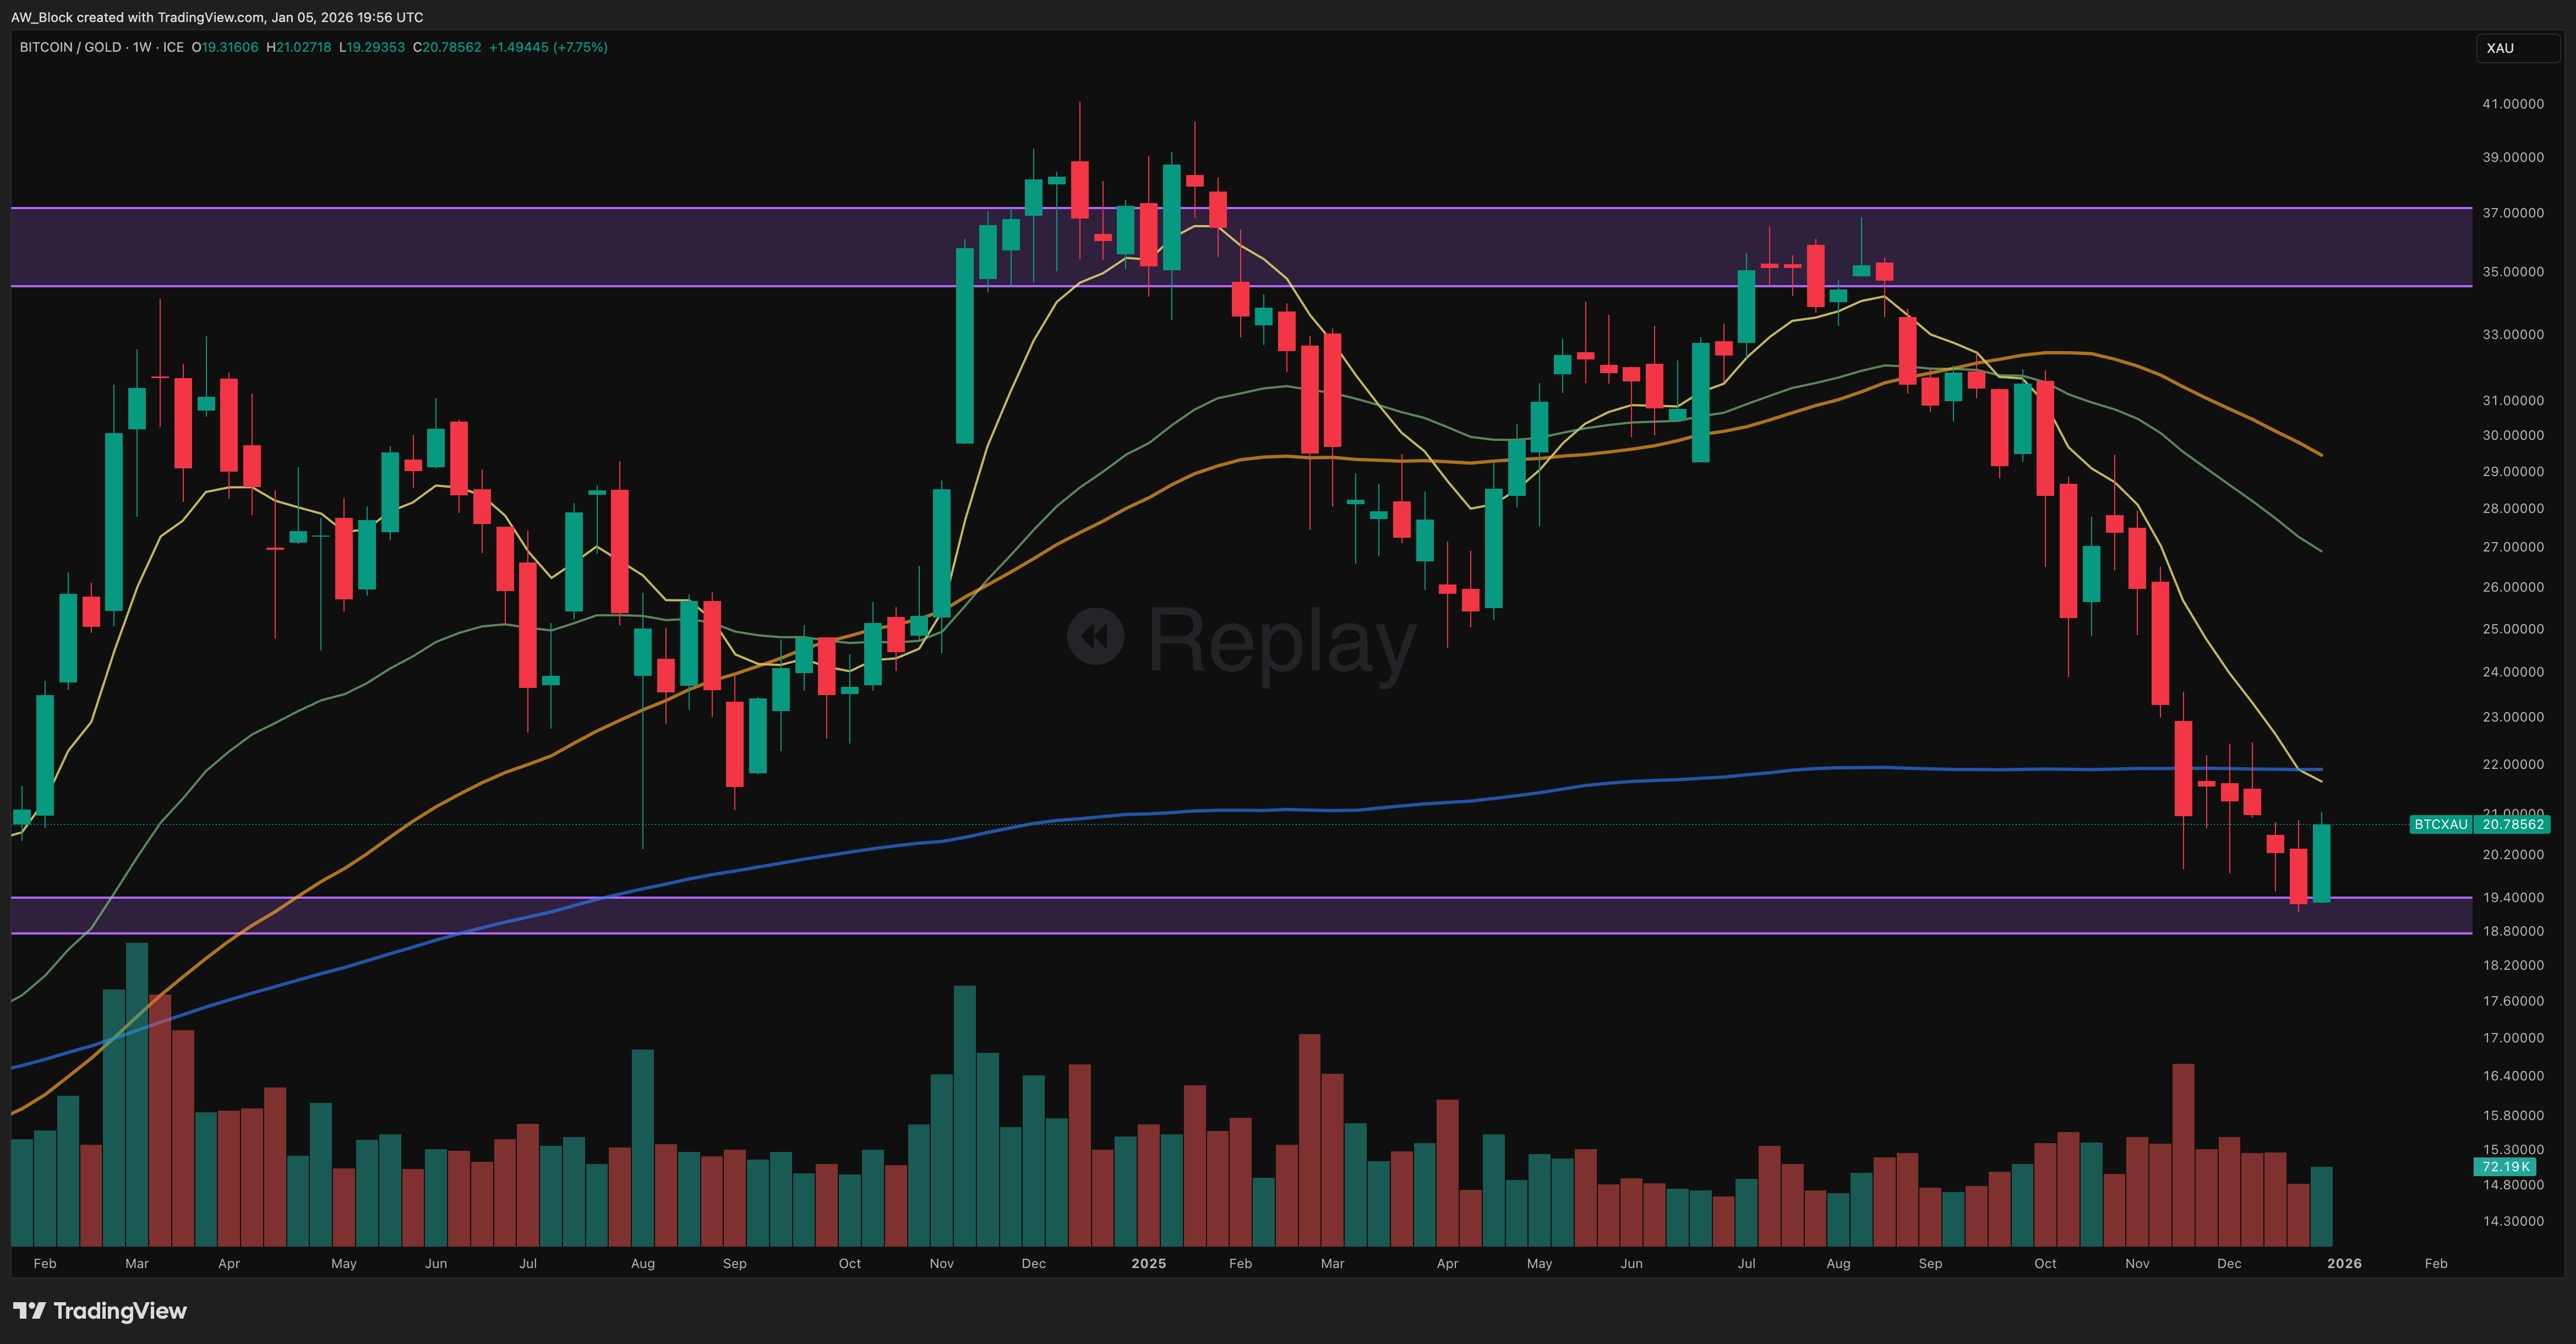
BTC/XAU has completed its downside objective and is now testing the lowest-probability zone for trend continuation. While the weekly trend remains bearish, the market is no longer in an optimal position for aggressive downside bets. The next few weekly closes will determine whether this level becomes a base or merely a pause before further weakness.
The Fundamentals
Hashrate
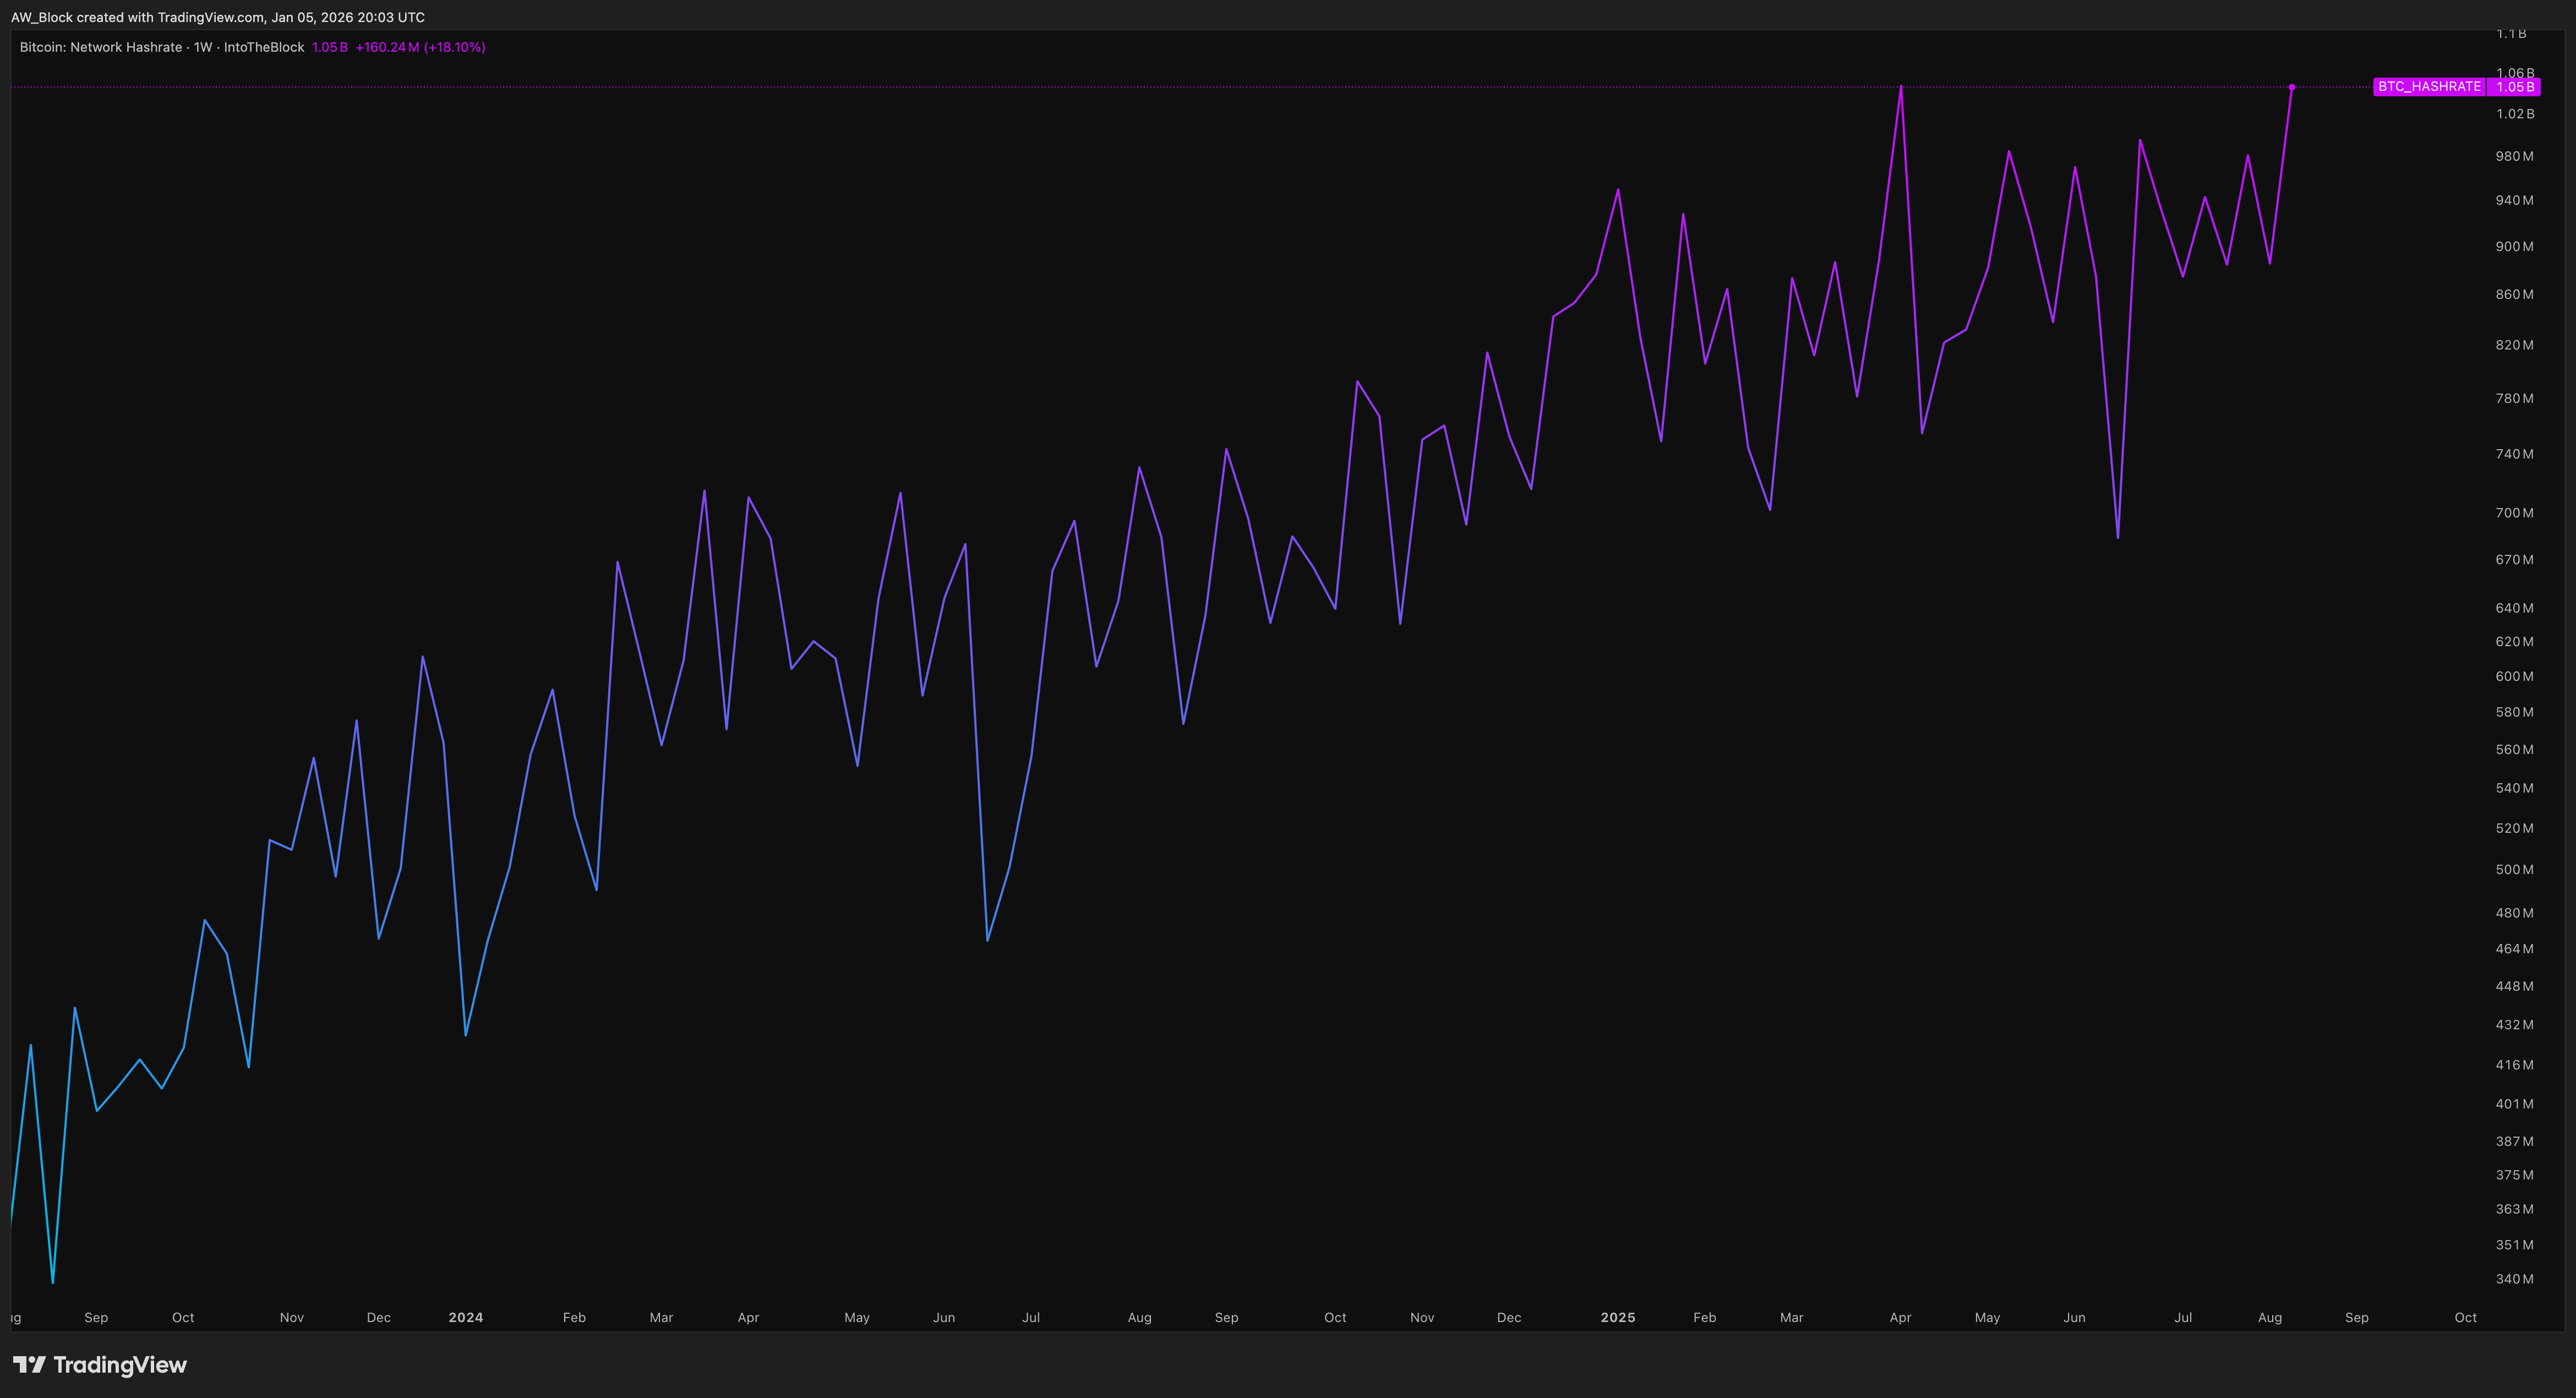
Bitcoin’s network hashrate has continued to press higher, holding near cycle highs around 1.05 billion TH/s despite extended price consolidation. The broader structure remains defined by higher lows, with recent drawdowns proving shallow and short-lived relative to the prevailing uptrend in computational power.
What stands out is persistence. Hashrate strength is being maintained even as price remains well below recent highs and miner margins stay compressed. This confirms that the marginal miner exiting the network has largely already occurred. Remaining participants are efficient, well-capitalized, and operating with a longer-term horizon.
From a cycle perspective, this behavior is consistent with mid-cycle consolidation rather than stress. Hashrate is no longer accelerating vertically, but it is not rolling over either. Instead, it is stair-stepping higher, signaling steady capital deployment and ongoing infrastructure expansion.
In short, network security continues to strengthen while price digests prior gains. Miner conviction remains intact, and hashrate is once again leading price rather than reacting to it, reinforcing the view that the current phase is consolidation, not deterioration.
Average Mining Cost
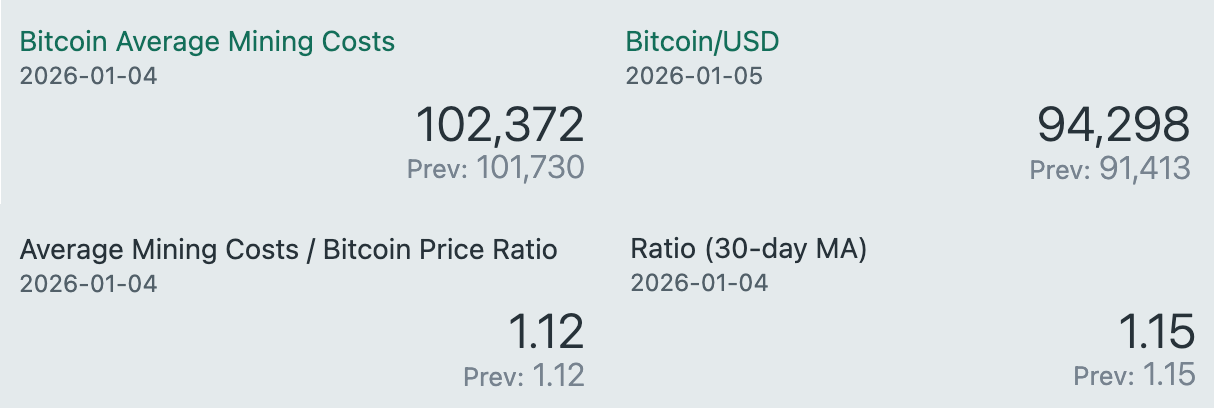
As of early January 2026, the average cost to mine one Bitcoin is estimated at $102,372, modestly higher than last month’s $101,730. With Bitcoin trading near $94,300, the mining cost-to-price ratio has eased to approximately 1.12, while the 30-day moving average of the ratio sits at 1.15, largely unchanged from the prior period.
This represents a subtle but important shift from December’s conditions. While miners remain operating below equilibrium, the gap between production cost and spot price has narrowed slightly as price has recovered faster than costs. The result is continued margin compression, but no longer an accelerating one. Stress remains present, yet it is stabilizing rather than intensifying.
The modest rise in average mining cost suggests operational inputs have plateaued after prior easing from difficulty adjustments and efficiency gains. At the same time, price recovery has reduced immediate pressure on miner balance sheets. Higher-cost operators remain constrained, while efficient miners continue to consolidate share, reinforcing the ongoing bifurcation within the mining landscape.
Crucially, there are still no signs of miner capitulation. Hashrate remains near cycle highs, block production is stable, and network participation has not meaningfully declined. This mirrors prior mid-cycle periods where Bitcoin traded below average production cost without triggering structural stress, instead forming equilibrium zones ahead of longer-term realignment.
Historically, sustained periods where price hovers near or modestly below production cost tend to resolve through price recovery rather than miner retreat. As long as Bitcoin remains within this band, miner resilience and network confidence remain intact, supporting the view that current conditions reflect consolidation, not systemic weakness.
Top Assets By Market Cap
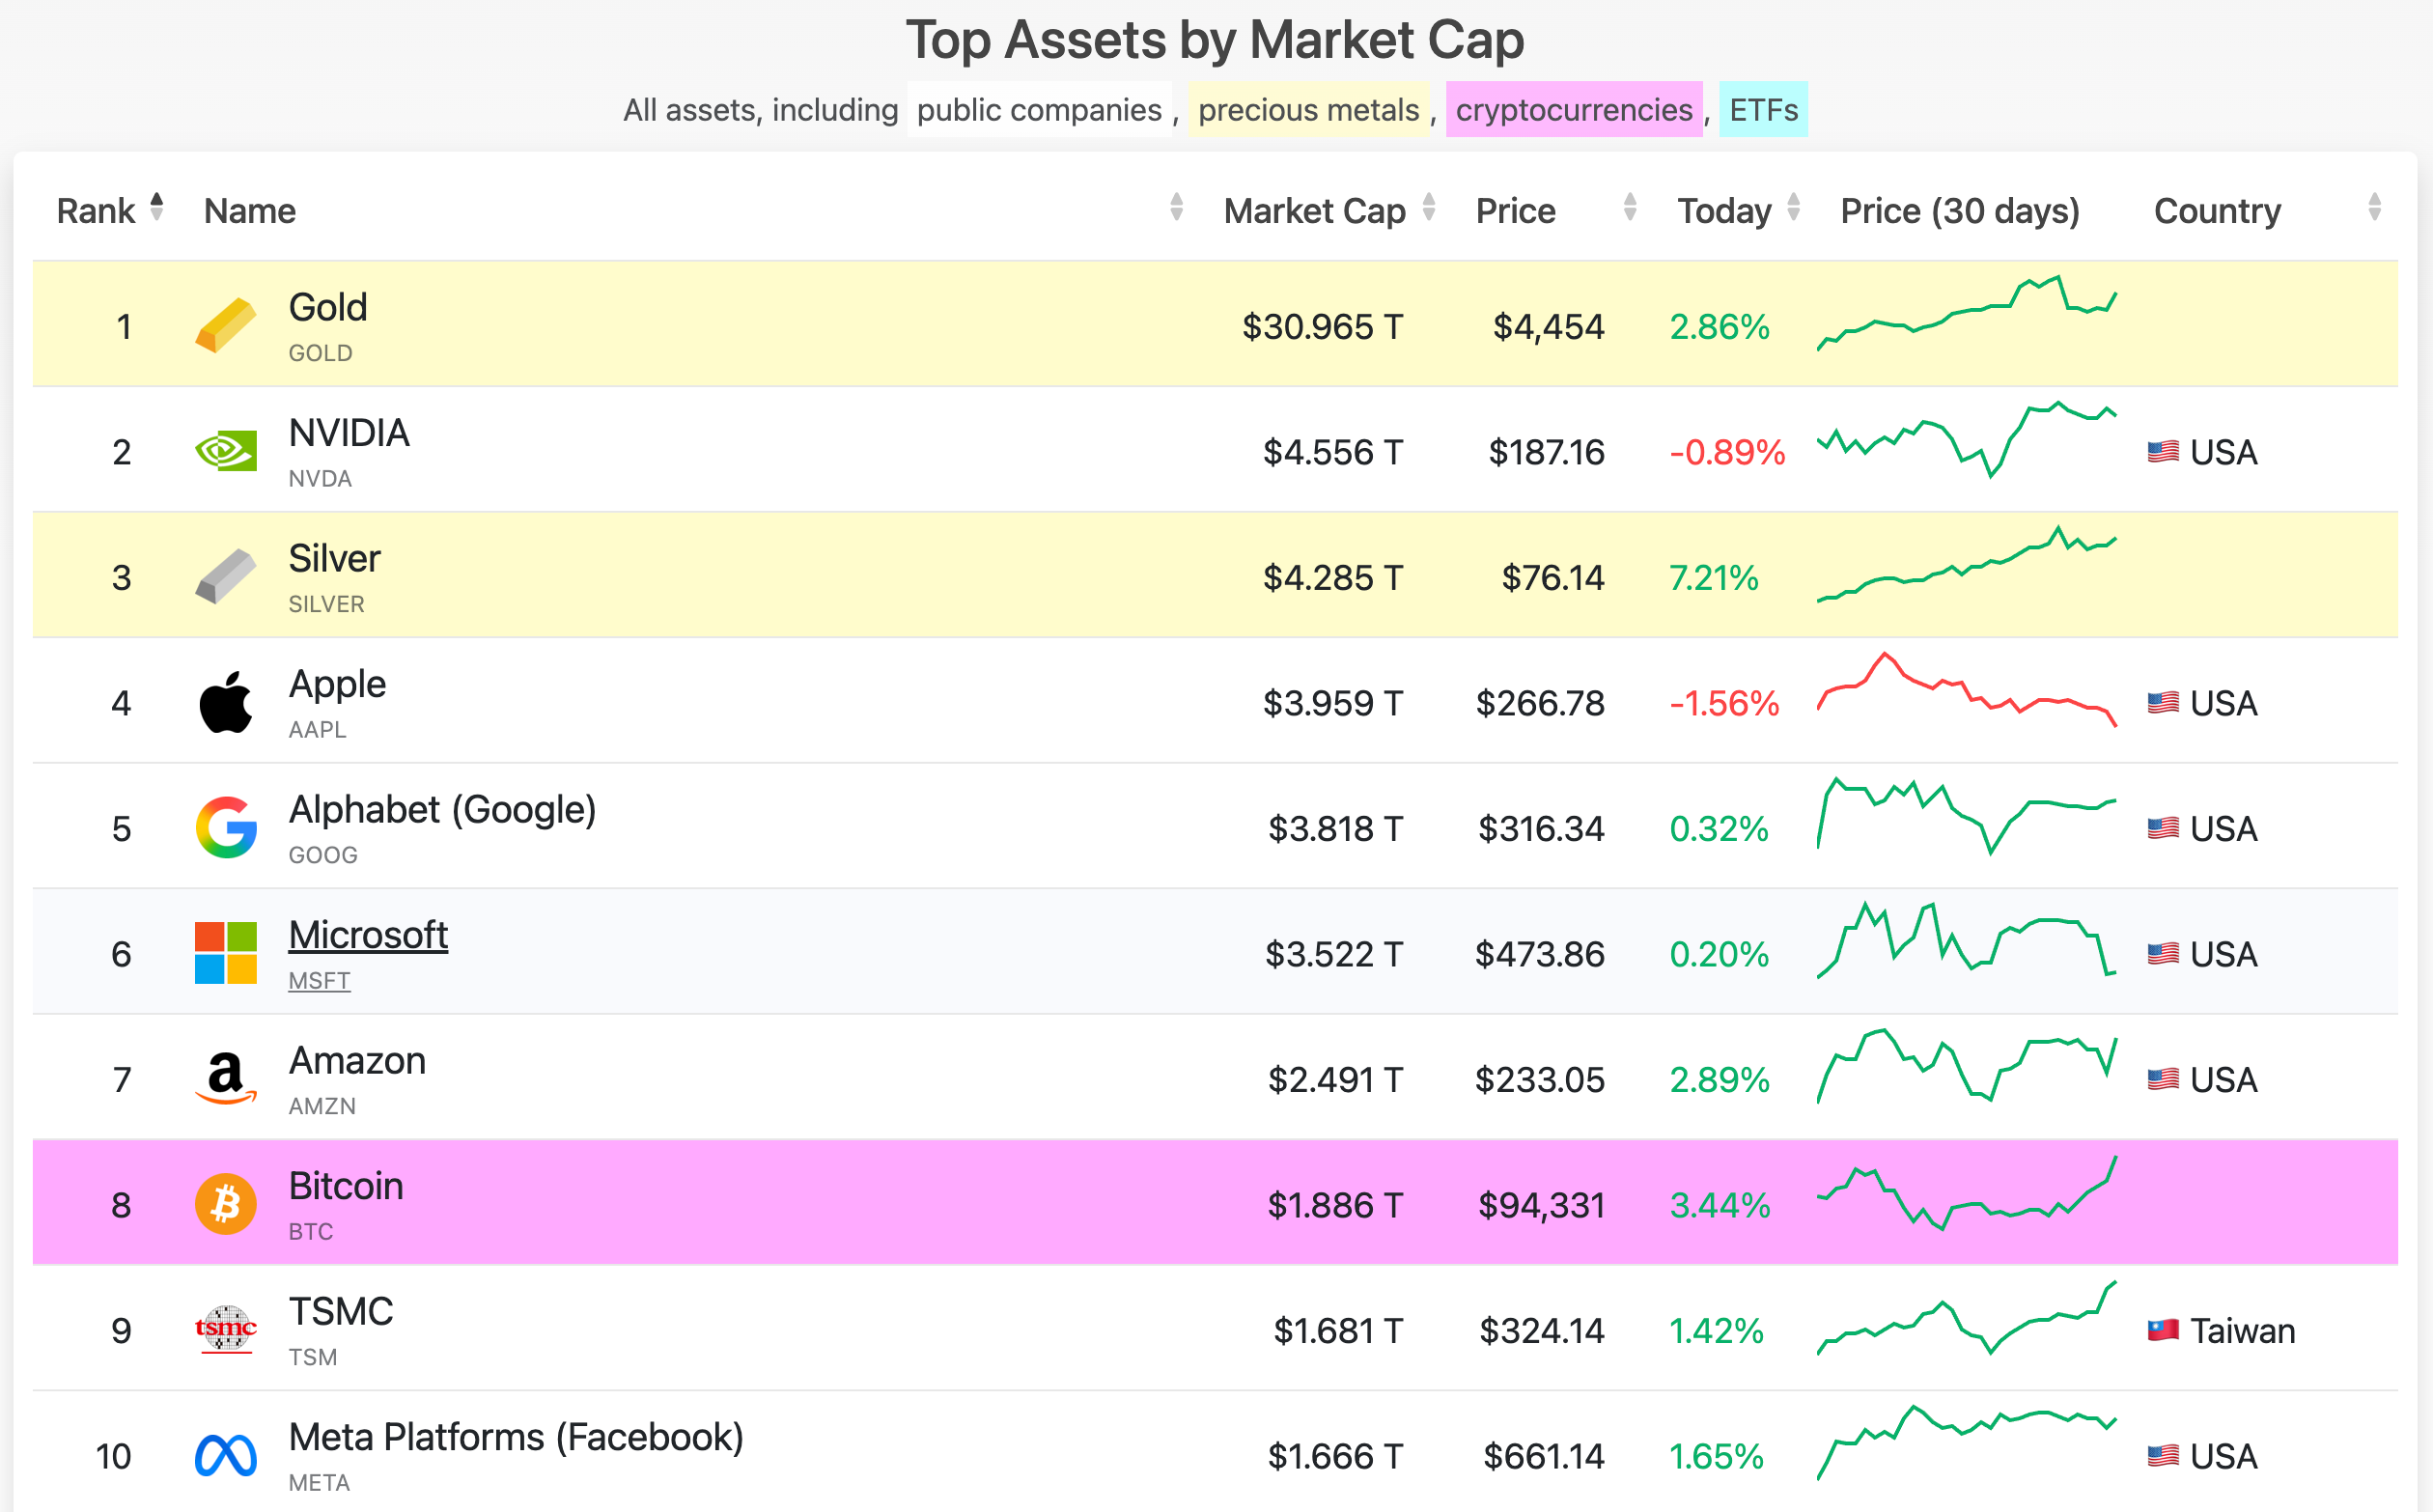
As of early January 2026, Bitcoin’s market capitalization has rebounded to approximately $1.89 trillion, maintaining its position at #8 globally among the world’s largest assets. This marks a modest recovery from the December lows near $1.83 trillion, reflecting stabilization alongside the ongoing price consolidation in the low-to-mid $90K range.
Bitcoin remains positioned below Amazon and above TSMC and Meta Platforms, firmly anchored within the global top ten. While it has not yet reclaimed the #7 ranking, the ability to hold a near-$2 trillion valuation through a corrective phase reinforces Bitcoin’s status as a mature, tier-one macro asset rather than a speculative outlier.
The broader leaderboard highlights a familiar divergence. Gold continues to dominate the store-of-value category at over $30 trillion, while equities such as NVIDIA, Apple, Microsoft, and Alphabet retain elevated valuations driven by equity-specific capital flows. Silver has pushed higher as well, reflecting renewed interest in hard assets during macro uncertainty.
Bitcoin’s relative positioning reflects cycle mechanics rather than structural weakness. After a strong expansion phase earlier in the cycle, the current rotation lower represents consolidation, not loss of relevance. Maintaining top-ten status during periods of tightening liquidity, elevated rates, and heightened volatility underscores Bitcoin’s durability as a global monetary asset.
In short, Bitcoin continues to consolidate rank rather than surrender it. Holding a trillion-dollar-plus valuation during a corrective regime confirms structural maturity and leaves Bitcoin well positioned for relative strength once broader market conditions normalize and the next expansion phase emerges.
Bitcoin News
Highlights from the month of December
World’s Second Largest Asset Manager Vanguard Opens Its Platform to Bitcoin and Crypto ETFs: Bloomberg
Bank of America Backs 4% Crypto Allocation for Wealth Clients as Wall Street Embraces Bitcoin
BlackRock CEO Larry Fink Says He Was Wrong About Bitcoin, Reveals a ‘Big Shift’ in His View
If you have any suggestions, feel free to reach out to me on X. I’m always looking to improve and add value in ways others might enjoy—just keep it Bitcoin only.
Live free and stack sats,
Will
“Bitcoin is a device for transferring wealth from the impatient to the patient.” — Stephan Livera
What is A.W. Block?
We’re a Bitcoin consulting firm helping clients navigate the complexities of the digital asset world with clarity and confidence. Whether it’s recovering lost funds, developing a long-term Bitcoin accumulation strategy, or mastering market cycles through advanced charting education—we’re here to make your crypto journey seamless, secure, and strategic.
If you’re ready to level up your understanding, protect your wealth, or take control of your Bitcoin future, let’s talk.
awblock.io