

Around the Block | 17
Macro price action, on-chain data, and market structure. No noise.

May 4, 2026 | By William Sanchez Jr., Founder of A.W. Block
April closed the argument. Bitcoin printed a $76,318 monthly close above the 2024 cycle base, confirmed the corrective low, and followed it with a textbook hammer retest of the $74K polarity line on the weekly. The markdown phase is no longer the operative structural read.
The lens this issue is confirmation. Price repaired. Structure validated. The question now is whether the recovery has the participation to extend toward the $84K 200 MA test — or whether the weekly digestion becomes distribution. Hashrate is under pressure, miner margins remain marginal, and volume has not yet expanded to match the price thesis. The levels are defined. The evidence is mixed where it needs to be honest.
None of this is financial advice.
Don’t trust, verify.
Let’s dive in.
TL;DR — KEY TAKEAWAYS
Monthly structure: Macro bull cycle intact. April closed at $76,318 — decisively above the $73K polarity line — confirming a successful retest of the 2024 cycle base and ending the active markdown classification. The corrective phase has likely registered its meaningful low. The 8 EMA at $82K is the next overhead test.
Weekly structure: Breakout confirmed, retest held. Price wicked to $74,931 and closed at $78,559 on a textbook hammer-character candle — the polarity line defended on the close. Transitional structure is now structurally validated. The 34 EMA at $84K and $90K–$94K weekly S/R define the overhead sequence from here.
BTC/Gold: Recovery intact, regime change unconfirmed. The ratio holds at 17 oz/BTC following the February cycle low at 12.60 — short-term momentum is bullish but the ratio remains below all major declining moving averages. Reclaim of 19.50–20.00 is the first structural test. Gold dominance persists until that zone is cleared.
Hashrate: Early stress characterization maintained. The partial recovery off the 830 EH/s low has stalled and reversed. The current weekly print at 890 EH/s — down 11% on the week — returns hashrate to the lower end of the 2026 band and 28% below the late-2024 all-time high. Proof-of-work moat intact; mining environment has not normalized.
Mining cost vs. price: Most significant margin improvement since the corrective phase began. Cost-to-price ratio compressed from 1.20 to 1.04 — driven by price recovery, not cost reduction. The environment remains structurally marginal. A sustained hold above $82K–$84K is the condition that converts marginal into viable.
Market cap / rank: Bitcoin holds #11 globally at $1.578 trillion. The gap to Saudi Aramco at #10 is approximately $195 billion. Bitcoin outperformed both gold and silver on the session — the second documented instance of this behavioral pattern. The rank was earned, not inherited.
Primary scenario: Weekly digests the retest hold and extends toward the $82K–$86K 34 EMA confluence — the rectangle measured-move target zone. Volume expansion on approach to $84K is required to validate a clean reclaim of the daily 200 MA and convert short-term repair into medium-term trend recovery. The level to watch is $84,732.
The Technicals
Monthly

OHLC Data
Open: $68,225.88
High: $79,498.80
Low: $65,692.29
Close: $76,318.70 (+11.86%)
Key Levels
$118K–$124K: Cycle peak / distribution origin; macro overhead resistance
$103K–$108K: Monthly S/R / broken demand turned supply; major structural overhead — the level that defined the topping structure
~$82,000: 8 EMA monthly; declining dynamic resistance
~$75,000: Upper boundary of major monthly support block; 34 EMA confluence; reclaimed polarity line
$59,500–$73,500: Major monthly S/R block — the 2024 consolidation base, now reclaimed structural support
~$58,000: 50 MA monthly; rising; macro support floor
Structure
Monthly structure is in post-distribution corrective phase with a completed successful retest of the prior cycle base. Per Schabacker, the most structurally significant test in any cycle is the first retest of the prior expansion’s breakout zone — and the February–April 2026 sequence delivered exactly that. Price descended into the $59K–$73K monthly support block (the 2024 consolidation that originally launched the late-2024 / 2025 expansion), wicked the lower boundary at $65,692, and closed April back above the upper boundary at $73K–$74K. The cycle structure remains intact: no monthly close registered beneath the $58K macro line; the 50 MA monthly continues to rise; the prior base tested as support and held. The macro bull cycle is under stress but not invalidated.
Candlestick Behavior
The April 2026 monthly candle is a long-bodied bullish candle (Nison: long white candle) with proportional shadows on both ends — open $68,225, close $76,318, real body $8,092 bullish, upper shadow $3,180, lower shadow $2,533. Body comprises 59% of the total range; shadows are present on both ends but neither dominates. Per Nison, this is a strong-bodied directional candle showing buyer control of the session with both extremes tested but neither defended by the opposing side. The upper shadow signals supply was met at $79,498; the lower shadow signals demand absorbed the $65,692 probe; the body close at $76,318 — well into the upper third of the range — confirms buyers controlled the close. Not a reversal candle. Not a hammer. A continuation/expansion candle with body dominance, structurally consistent with a corrective phase producing its first conviction-character bullish month.
Structural read unchanged — close above the $73K polarity line is what matters, and that remains valid. The candle’s character is conviction expansion, not reversal indecision.
Chart Patterns
The monthly action since November 2025 reads as a distribution top followed by an A-B-C corrective sequence into the prior cycle base — a classic post-expansion correction structure per Schabacker. The $59K–$73K block has functioned as a successful retest zone, holding the deepest probe and producing a reactionary reclaim. The April monthly close establishes the first credible higher-low candidate above the prior cycle base; confirmation requires a subsequent monthly close that does not invalidate the lower shadow defense.
Trend & Momentum
8 EMA (~$82,000): Declining; price below; first overhead resistance on the monthly frame.
34 EMA (~$75,000): Flattening at the upper boundary of major support; confluence with the polarity line — most structurally important MA on this chart.
50 MA (~$58,000): Rising; well below price; macro trend support intact.
Trend state: Macro bullish, medium-term corrective, short-term reclaiming — transitional macro tape consistent with mid-cycle correction rather than cycle reversal.
Volume
Monthly volume during the corrective phase has been moderate and contracting — consistent with absorption and base re-validation rather than panic distribution. The dominant high-volume monthly bars on this chart remain the late-2024 / early-2025 expansion candles. April’s reclaim volume is participatory but not climactic — the move is price-confirmed but participation-light at the macro frame.
Psychological & Probabilistic Context
The macro sentiment environment is post-distribution capitulation transitioning to disbelief recovery. Behavioral context is defined by long-cycle holders — 2024 base accumulators saw their structural support tested and held; $108K–$122K distribution participants are pressed by the corrective sequence. The macro Layer 7 backdrop (Iran transit toll, Morgan Stanley/Goldman ETF expansion, Japan FIEA legitimization, Pakistan banking access) constructs a demand environment that did not exist during prior cycle corrections — a structural difference informing probability without overriding price structure.
Monthly Outlook
Primary: May closes above $73,500 preserving the reclaim and higher-low structure; subsequent months consolidate in the $73K–$85K zone testing the declining 8 EMA as next overhead reference. Cycle correction continues with structure intact.
Stabilization: Monthly close above $85K reclaims the 8 EMA on the macro frame; opens the $101K–$108K monthly S/R as the first major structural overhead test. Cycle transitioning from corrective to structural recovery.
Structural Repair: Monthly closes and holds above $108K with reclaim of the broken demand zone; full cycle correction resolved and conditions for continuation toward $122K cycle peak retest established. Macro bullish trend re-confirmed in full.
Final Assessment
The monthly trend remains macro bullish in cycle structure with the corrective phase showing a completed successful retest of the prior cycle base. April closed at $76,318 above the upper boundary of the $59K–$73K monthly support block, with meaningful lower shadow defense of the $65K probe. Cycle structure is intact and the corrective phase has likely registered its meaningful low.
What confirms continuation: a May monthly close above the 8 EMA at ~$84K — first reclaim of declining momentum on the macro frame and the trigger toward the $101K–$108K structural overhead test.
What signals a change: a May monthly close back beneath $73,000 — invalidating the April reclaim and re-opening the major support block for a deeper test, with the $58K 50 MA as the structural floor.
Prior Journal Reference
The prior monthly entry analyzed the April 2026 candle as a partial / in-progress reading — captured at OHLC O $66,993 / H $76,008 / L $64,960 / C $68,226 mid-month. At that point structure was framed as “active markdown phase” with the partial close beneath $71,000 reading as continuation, and the explicit position that “the April monthly close relative to $71,000 is the only number that matters right now.”
How the completed candle resolved the prior framework:
The “$71,000 close test” — RESOLVED BULLISH. Final April close came in at $76,318, $5,318 above the $71,000 line and $3,318 above the $73,000 reclaim level the prior entry flagged as the bullish trigger. The prior entry’s “What Matters Most” criterion was met decisively.
Bullish Scenario status: The prior entry’s bullish scenario required “April monthly close above $71,000 with continued strength in May” and “key level to reclaim: $73,000.” April triggered the price condition; May follow-through is now the operative continuation question.
Bearish Scenario status: Prior bearish scenario required a monthly close below $63,500. The actual low ($65,692) wicked into but did not close beneath that band. Bearish scenario invalidated.
Candlestick re-classification: The prior entry described the partial candle as “wide-range with upper and lower shadow — classification pending end-of-month close” and noted that “a close above $71,000 shifts toward absorption.” The completed candle shifted decisively into absorption character — the upper shadow extension to $79,498 (above the partial reading’s $76,008 high) and the close at $76,318 confirms the buyer-absorption read the prior entry left conditional.
Structural framing update: Prior entry classified the structure as “confirmed macro markdown phase following ATH distribution.” With the completed April close above $73K reclaiming the polarity zone, the structural read upgrades from active markdown to post-correction higher-low candidate. This is a meaningful frame change driven entirely by the close — exactly as the prior entry specified.
What carries forward: The 8 EMA at ~$82K remains the next overhead reference (prior entry flagged it at ~$83K, now ~$82K — consistent with the declining slope); the $103K–$108K distribution ceiling remains the macro overhead test; the 50 MA at ~$58K remains the structural floor. The framework is intact; only the structural classification has advanced.
The prior entry was structurally correct in its conditional framing — the close was the deciding variable, and the close moved the read from markdown-continuation to corrective-completion candidate. Structural continuity preserved.
Weekly

OHLC Data
Open: $78,672.16
High: $79,498.80
Low: $74,931.00
Close: $78,559.32 (−0.14%)
Key Levels
$116K–$120K: Distribution origin / weekly S/R; macro overhead resistance
$104K–$108K: Broken weekly demand turned supply; 3M/6M/12M S/R cluster; confluence with 50 MA
$90K–$94K: Weekly S/R; first major structural overhead test
$84,000: 34 EMA weekly; declining intermediate resistance
$74,000–$75,000: Weekly S/R / polarity zone — successfully retested this week
$60,000–$64,000: 3M/6M/12M S/R cluster; primary structural floor
8 EMA ~$75,000: Reclaimed; rising; aligned with the polarity zone — confluence support
34 EMA ~$83,000: Declining; first meaningful overhead resistance
50 MA ~$95,500: Declining; aligned with $90K–$94K supply
200 MA ~$61,000: Rising; macro trend support intact
Structure
Weekly structure has progressed from breakout to confirmed retest hold. The April 26 weekly close at $78,670 reclaimed the $74K polarity line; this week’s action tested the breakout — wicking down to $74,931 — and held with a body close at $78,559. Per Schabacker, a successful retest of broken resistance as new support is the structural confirmation that converts a breakout from suspect to validated. The lower-high / lower-low markdown sequence from the $122K peak is no longer in clean control; the weekly is now in transitional repair phase with the polarity hold confirmed. The next structural test is the declining 34 EMA / $84K zone overhead.
Candlestick Behavior
The current weekly candle is a textbook bullish hammer character — open $78,672, close $78,559, real body $113 bearish (essentially flat), upper shadow $826, lower shadow $3,628. Body is 2.5% of total range; lower shadow is 79% of total range. Per Nison, this is a hammer/dragonfly-adjacent reversal-continuation candle when occurring at support — and price wicked to exactly the $74,931 level (testing the $74–75K polarity zone) before closing back near the open. The candle structure communicates: supply tested the breakout, demand absorbed the test in full, and price returned to the upper range. Following a strong bullish-bodied prior week, this is a textbook continuation hammer at retest support.
Chart Patterns
The accumulation base ($65K–$74K) breakout from the prior week remains valid and is now structurally confirmed by the retest hold. Per Bulkowski, a successful retest of a broken rectangle/base boundary increases the statistical probability of measured-move completion. The base measured-move target of $83K–$84K remains the operative reference and aligns with the declining 34 EMA — the confluence overhead test. No new pattern is forming; the structure is the resolution-and-retest sequence playing out as projected.
Trend & Momentum
8 EMA (~$75,000): Reclaimed and rising; aligned with the polarity zone — confluence dynamic support.
34 EMA (~$83,000): Declining; first overhead resistance; measured-move target sits inside this zone.
50 MA (~$95,500): Declining; aligned with $90K–$94K supply cluster.
200 MA (~$61,000): Rising; macro support intact.
Trend state: Short-term bullish (8 EMA reclaimed and supportive), medium-term bearish (34/50 declining overhead), macro bullish — transitional alignment with momentum repaired and the 34 EMA test pending.
Volume
Weekly volume bar at 68.42K is lower than the prior week’s breakout candle and lower than recent rally weeks. This is the principal technical concern with the retest hold: the structural read is bullish, but participation contracted into the digestion. Per Dow Theory, low-volume tests can be read either as absorption (bullish) or distribution-pause (bearish) depending on what follows — the next week’s volume will determine which interpretation is correct. Volume expansion on a follow-through weekly close above $80K would validate absorption; volume expansion on a failure beneath $74K would validate distribution-pause.
Psychological & Probabilistic Context
Sentiment continues the rotation from disbelief to cautious acknowledgment, with the retest hold removing the simplest “failed breakout” thesis. Behavioral context favors continuation pressure but the lower-volume digestion introduces uncertainty about participation conviction. Position holders from the rectangle breakout are now sitting on validated structure; sidelined capital faces increasing pressure as price holds above the polarity line on successive weeks. The Layer 7 macro infrastructure remains supportive without being the trigger — the trigger is whether the 34 EMA at $84K either reclaims or rejects on the next approach.
Weekly Outlook
Primary: Acceptance above $74K continues; weekly extends from current digestion toward the $82K–$86K supply shelf and 34 EMA confluence as the first measured-move target. Hammer character favors continuation following digestion.
Stabilization: Weekly close above $86K with volume expansion confirms transition from structural repair to recovery; opens the $90K–$94K weekly S/R as the next directional test — the level that defined the breakdown will define the next phase.
Structural Repair: Weekly closes and holds above $94K and reclaims the $104K–$108K broken demand zone; first credible end of the markdown phase and conditions for return to bullish expansion structure on the weekly frame.
Final Assessment
The weekly trend has progressed from transitional to transitional with structural confirmation. The April 26 breakout above $74K has now been validated by a textbook hammer-character retest hold — price wicked to $74,931, defended the polarity line on the close, and held in the upper range of the week. The 34 EMA at $84K and the $90K–$94K weekly S/R define the overhead sequence that determines whether transitional repair converts into recovery. Continuation is the structurally consistent read pending volume confirmation.
What confirms continuation: a follow-through weekly close above $80K with volume expansion, opening the $82K–$86K 34 EMA test zone and validating the base-pattern measured move.
What signals a change: a weekly close back beneath $74K — would invalidate the retest hold, convert the hammer into a failed signal, and re-open the $65K–$67K base low as the immediate target with the $60K–$64K cluster as the structural downside.
Prior Journal Reference
Around the Block #16 (April 27, 2026) defined the weekly Primary scenario as “acceptance above $74K holds; weekly digests the breakout in the $74K–$80K zone over the next 1–2 weeks; price extends toward the $82K–$86K supply shelf and 34 EMA confluence.” This week has played out as the digestion phase of that exact scenario — price tested down to $74,931 (inside the $74K–$80K projected digestion zone), held the level, and closed at $78,559 (still inside the projected zone). The hammer-character retest validates the breakout structurally. The Primary scenario remains active and on track. The Stabilization and Structural Repair criteria from #16 (close above $86K and $94K respectively) remain unchanged and pending. Volume contraction during digestion is the only divergence from the ideal scenario — flagged for continued monitoring.
Bitcoin/Gold — Weekly

OHLC Data
Open: 17.082
High: 17.198
Low: 16.995
Close: 17.025 oz/BTC (+0.47%)
Reading: 1 BTC currently equals ~17 oz of gold. Chart measures Bitcoin’s purchasing power in gold terms — pure relative strength, removes USD as a variable.
Key Levels
40.00 oz: Cycle peak / weekly S/R; macro overhead resistance (early-2025 distribution origin)
25.00–26.00 oz: 34 EMA confluence; declining intermediate resistance
24.00–25.00 oz: 50 MA confluence; declining
21.50–22.50 oz: 200 MA (declining flat); first macro line of repair
19.50–20.00 oz: 3M/6M/12M S/R cluster; broken structural support, now decisive overhead
17.00 oz: Current level — at 8 EMA confluence
14.22 oz: Weekly S/R; reclaimed support during recovery
12.60 oz: Weekly S/R; cycle base low — capitulation print from February 2026
8 EMA ~16.50 oz: Reclaimed; rising — short-term momentum bullish
34 EMA ~25.50 oz: Declining; significant overhead
50 MA ~24.50 oz: Declining; aligned with 19.50–20.00 supply
200 MA ~22.00 oz: Flat-to-declining; macro trend reference
Structure
BTC/Gold structure is in early recovery phase from a completed cycle markdown. The ratio peaked at ~40 oz in early 2025 (Bitcoin’s strongest position relative to gold during the cycle), broke down through the 19.50–20.00 oz structural support in late 2025, and capitulated to 12.60 oz in February 2026 — the deepest underperformance of Bitcoin vs gold in the current cycle. Per Schabacker, the structure is best described as a completed markdown phase with active basing — the 12.60 low has been respected, the 8 EMA has been reclaimed, and price is grinding back toward the 19.50–20.00 broken support. The ratio remains below all major declining moving averages overhead — recovery is real but transitional, not yet structural.
Candlestick Behavior
The current weekly candle is a small bearish-bodied near-doji — open 17.082, close 17.025, real body 0.057 (essentially flat), upper shadow 0.116, lower shadow 0.030. Per Nison, this is a spinning-top character at a momentum extension — indecision after a multi-week recovery move. Following the steady advance from 12.60 through 17, this candle reads as a digestion pause rather than a reversal — neither side is producing conviction at the current level. Close near the open in a narrow range communicates equilibrium, not directional resolution.
Chart Patterns
The recovery from the 12.60 cycle low resembles an early-stage rounded base / disbelief recovery formation — characteristic of post-capitulation behavior per Schabacker. No completed pattern yet; the structure is still developing. The 19.50–20.00 oz zone is the operative pattern reference — a successful reclaim of that zone would convert the basing structure into a higher-low recovery sequence; rejection there would re-validate the markdown thesis. No measured-move target is offered until pattern resolution registers.
Trend & Momentum
8 EMA (~16.50): Reclaimed and rising; short-term momentum bullish.
34 EMA (~25.50): Declining steeply; first overhead resistance band.
50 MA (~24.50): Declining; aligned with broken support cluster — macro intermediate resistance.
200 MA (~22.00): Flat-to-declining; the first macro line of structural repair — reclaim required for trend transition.
Trend state: Short-term bullish, medium-term bearish, macro bearish — a transitional ratio with momentum recovering but trend structure still favoring gold.
Volume
Volume on the recovery from 12.60 has been moderate and steady — consistent with absorption rather than aggressive accumulation. The dominant volume event remains the early-2026 capitulation bars, where panic selling produced the cycle low. Current weekly volume at 3.88K is below recent average — the ratio is grinding higher on contracting participation. Per Dow Theory, recovery rallies on declining volume tend to be vulnerable to higher-frame rejection; a volume expansion on any approach toward the 19.50–20.00 zone is required to validate genuine structural repair.
Psychological & Probabilistic Context
The macro sentiment environment for the BTC/Gold ratio reflects a market that has rotated decisively toward gold over the prior ~18 months. The cycle peak at 40 oz was the high-water mark of Bitcoin’s relative dominance; the markdown to 12.60 reflects gold’s structural strength during a period of geopolitical tension (Iran, Ukraine, dollar uncertainty), institutional safe-haven rotation, and crypto risk-off behavior. The current recovery indicates that Bitcoin is regaining relative strength as gold consolidates its gains — but the structural underperformance remains intact. For the ratio to confirm a regime change (Bitcoin re-establishing relative dominance), reclaim of the 19.50–20.00 broken support and subsequent acceptance above the 200 MA (~22.00) is required. Until then, the ratio reads as relief rally inside a broader rotation.
Weekly Outlook
Primary: Ratio digests near 17 with the 8 EMA holding as support; gradual extension toward the 19.50–20.00 broken support / 3M-6M-12M S/R cluster as the first structural overhead test.
Stabilization: Weekly close above 20.00 reclaims the broken support zone; opens the 22.00 200 MA as the next directional test — the macro line that converts recovery into structural repair on this ratio.
Structural Repair: Weekly close above 25.00 reclaims the declining 34/50 MA cluster; full structural recovery for Bitcoin vs gold and conditions for a return toward the 30+ zone last seen during the 2025 expansion phase.
Final Assessment
The BTC/Gold ratio trend is macro bearish in structure but actively recovering from the cycle low. The 12.60 capitulation print has held, the 8 EMA has been reclaimed, and price is now at 17 — testing the upper boundary of the recovery zone. The 19.50–20.00 broken support and the 22.00 200 MA define the overhead sequence that determines whether this is a relief rally inside continued gold dominance or the early stage of Bitcoin re-establishing relative strength.
What confirms continuation: a weekly close above 20.00 oz/BTC reclaiming the broken support cluster, followed by acceptance above the 200 MA at 22.00 — first credible structural repair of Bitcoin vs gold.
What signals a change: a weekly close back beneath 14.22 — would invalidate the recovery structure and re-open the 12.60 cycle base low for retest, with potential for a deeper rotation toward gold.
Cross-Reference to BTC/USD Analysis
The BTC/Gold ratio recovery is in sync with the BTC/USD recovery from the $65K base, but the ratio remains well below its cycle norms — meaning Bitcoin’s USD recovery has been partially driven by USD weakness and gold strength rather than pure Bitcoin demand. This is a critical macro context: a BTC/USD breakout above $84K (declining 200 MA on daily) accompanied by a BTCXAU reclaim of 20.00 would be a much stronger signal than BTC/USD alone. Divergence between the two — BTC/USD rallying while BTCXAU stalls — would suggest the USD-denominated rally is currency-driven rather than asset-strength driven, weakening the structural conviction of any continuation. Currently both ratios are improving in tandem, which favors the structural read; monitoring the relationship is the highest-value cross-check for the broader thesis.
The Fundamentals
Hashrate
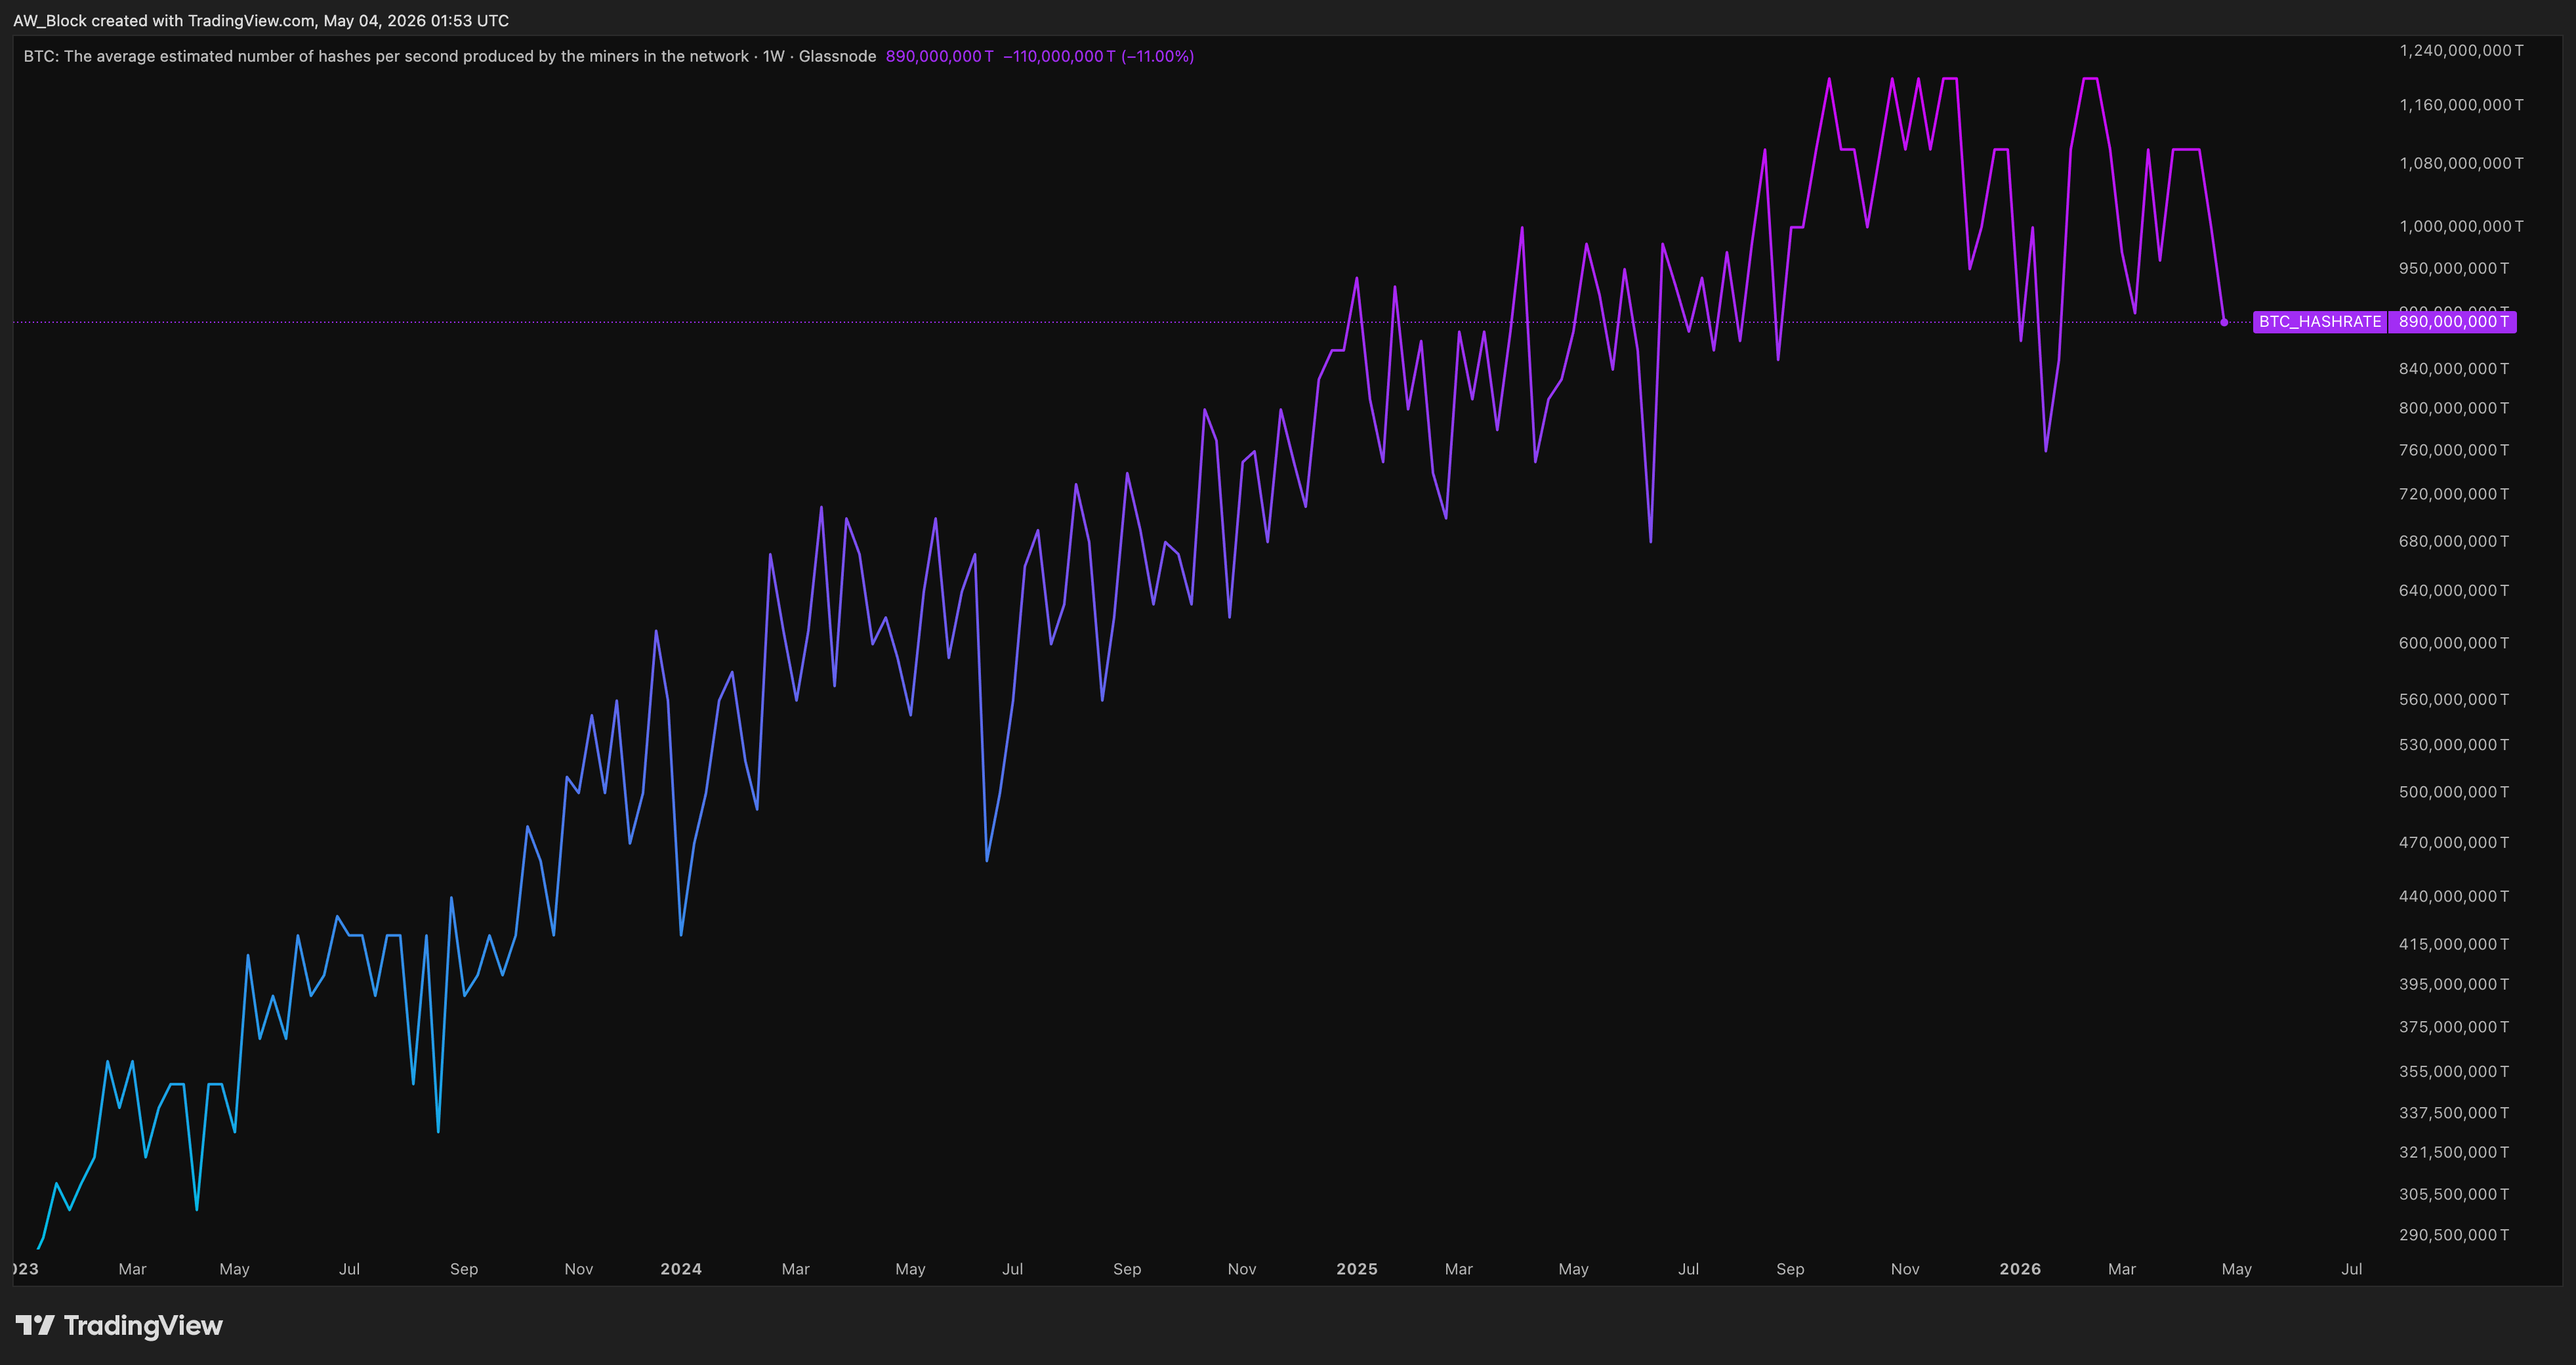
Current reading: 890,000,000 TH/s (890 EH/s), down 110,000,000 TH/s (−11.00%) on the week.
Issue #13 characterized the hashrate environment as early stress — a sustained decline off the late-2024 peak near 1,250 EH/s that had moved beyond normalization and into a deteriorating mining revenue environment. The reading at that time was 830 EH/s, roughly 17% below the prior reference in Issue #12 and approaching the 2024 structural breakout zone.
That characterization requires a partial update in both directions.
In the weeks following Issue #13, hashrate recovered off the 830 EH/s low and staged a meaningful rebound — pushing back toward the 1,050–1,100 EH/s range by late Q1 2026, consistent with difficulty adjustment absorbing the prior drawdown and marginal miners rotating back online as price recovered off the cycle low. That recovery was the network self-correcting, as the proof-of-work mechanism is designed to do.
The current weekly print at 890 EH/s, down 11% on the week, represents a reversal of that partial recovery. Hashrate has now retraced back toward the lower end of the 2026 range, sitting approximately 28% below the all-time high near 1,240 EH/s printed in late 2024 and meaningfully below the recent 2026 recovery attempt. The weekly decline of 110 EH/s is not a minor oscillation — it is a sharp single-week move consistent with either a coordinated miner capitulation event, a large-scale curtailment due to power economics, or difficulty-adjustment lag following a period of elevated block production.
The chart context matters here. The 1W Glassnode series shows a clear macro structure: a sustained uptrend from early 2023 through late 2024 that brought hashrate from roughly 300 EH/s to 1,240 EH/s, followed by a volatile and structurally lower phase that began in mid-2025 and has not recovered to prior highs. The pattern of lower highs on the weekly hashrate — 1,240 EH/s peak, subsequent rally to approximately 1,100 EH/s, now 890 EH/s — mirrors the type of distribution behavior seen in price structure when supply is systematically exiting.
Riot’s Q1 disclosure — selling 3,778 BTC, or 2.6x quarterly production — is consistent with the revenue environment this hashrate chart reflects. Miners are not capitulating catastrophically, but they are converting treasury to fund operations at a rate that exceeds current production. That is a margin-pressure read, not a growth read.
Verdict: the partial recovery flagged after Issue #13 has stalled and reversed. Hashrate is back in the lower range of the 2026 band, down sharply on the week, and structurally below the late-2024 all-time high by more than a quarter. The proof-of-work moat remains intact — block production is continuous and difficulty will adjust — but the mining environment has not normalized. Early stress remains the operative characterization, and this week’s print does not improve it.
Avg Mining Cost
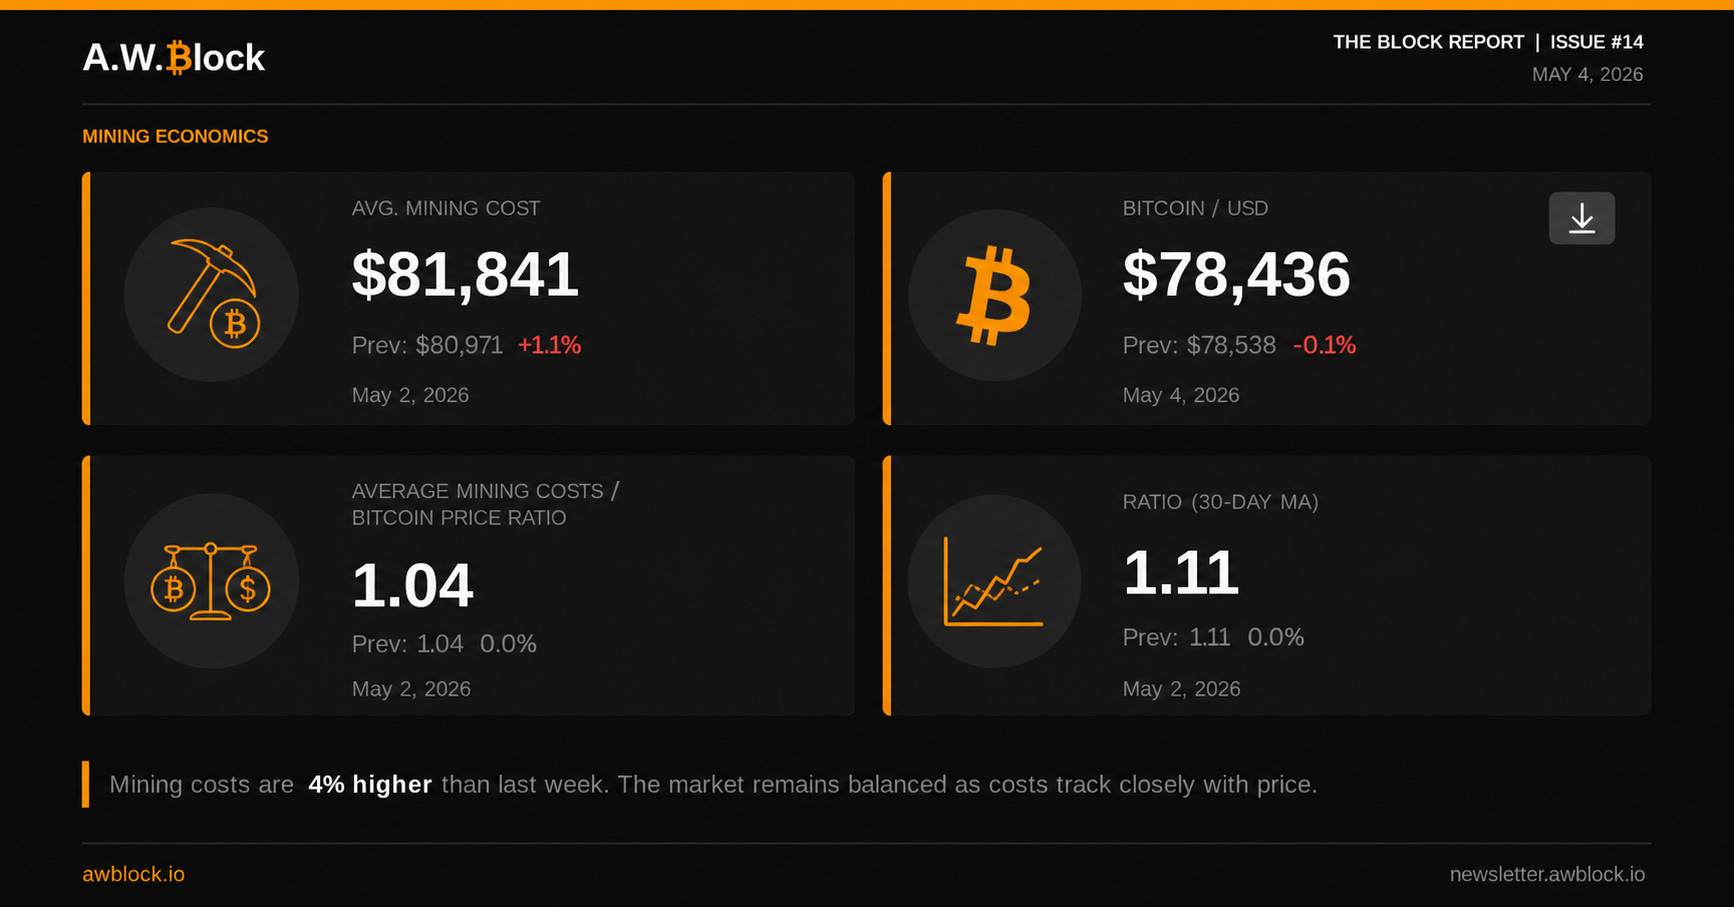
The prior reading, recorded on April 5, showed an average mining cost of $83,038 against a spot price of $69,519 — a cost-to-price ratio of 1.20, with the 30-day MA ratio also at 1.20. The conclusion at that time was cautious: ratio compression was occurring for the first time in the corrective phase, but the environment remained structurally unprofitable, with a 20% cost premium over spot keeping capitulation conditions active.
The current data represents a material shift in that read.
As of May 4, 2026, the average mining cost stands at $81,841 — down $1,197 from the prior period, a modest cost compression of approximately 1.4%. Spot price has moved to $78,436. The cost-to-price ratio has contracted to 1.04. The 30-day MA ratio sits at 1.11.
The compression from 1.20 to 1.04 on the spot ratio is not a marginal move — it is the largest single-period ratio improvement since the corrective phase began and is driven primarily by price recovery, not cost reduction. The April rally from the $65K–$67K cycle low through the $74K stabilization break has done more to repair miner economics in four weeks than cost efficiency gains accomplished in the prior several months. That is the correct read of the data: the price recovered, and miners followed.
A ratio of 1.04 means average production costs still exceed spot by 4%. The mining environment is not profitable on an industry-average basis — higher-cost operators remain under pressure and the 30-day MA ratio at 1.11 reflects that the structural imbalance has not fully resolved. But the distance between unprofitable and breakeven is now narrow. If spot holds above $80K and the 30-day MA ratio continues to compress toward 1.00, the next reporting period will record the first near-breakeven or profitable average mining environment since before the corrective phase.
The Riot Platforms Q1 data is consistent with this picture. Riot sold 3,778 BTC — 2.6x its quarterly production — not because it was in distress, but because margin pressure required treasury conversion to fund operations and capital projects. That is the behavior of a miner operating at the edge of the 1.04 ratio: not capitulating, but not accumulating. The treasury is the buffer, and it is being drawn down.
Verdict: miner economics have improved materially. The ratio compression from 1.20 to 1.04 is the most significant improvement since the corrective phase began and is price-driven. The environment remains structurally marginal, not structurally healthy, and the 30-day MA ratio at 1.11 confirms that the monthly average cost burden has not yet resolved. A sustained hold above $82K–$84K — the current average cost plus margin — is the condition that converts marginal into viable.
Top Assets by Market Cap
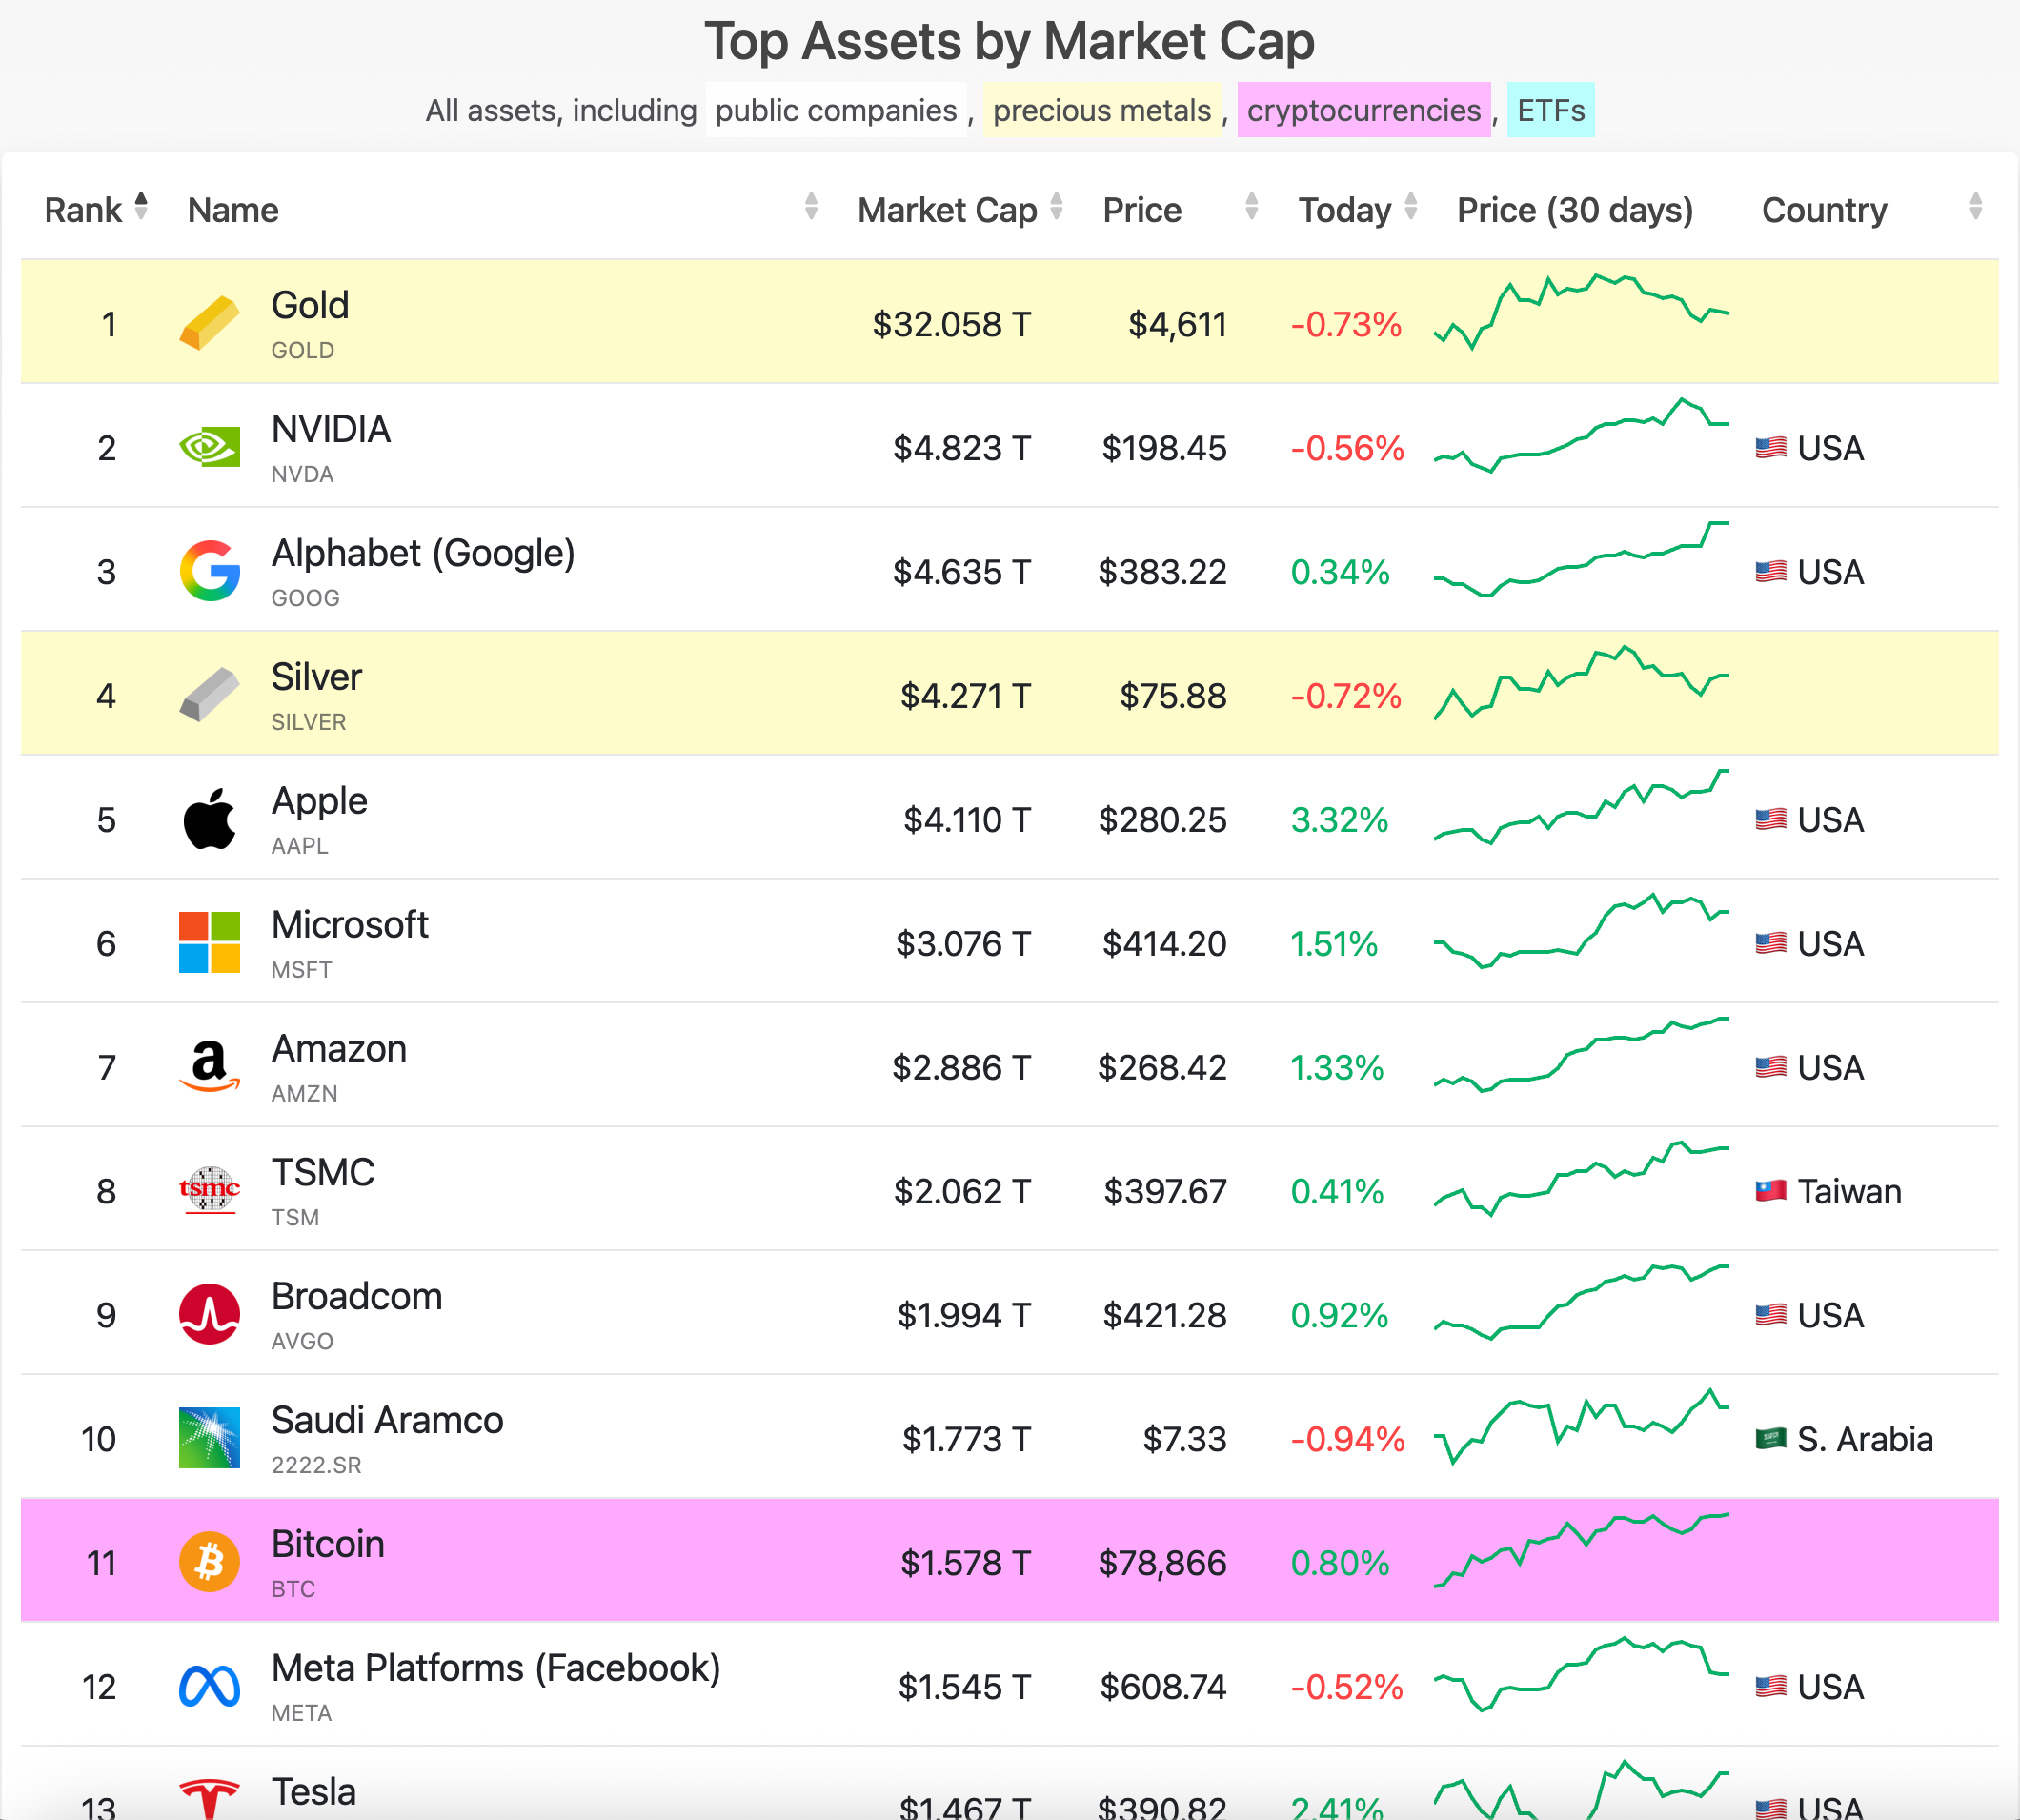
As of May 4, 2026, Bitcoin sits at rank #11 with a market cap of $1.578 trillion and a price of $78,866. The move from #12 to #11 — documented in Issue #13 — has held, and the gap above has narrowed. Saudi Aramco holds #10 at $1.773 trillion, leaving approximately $195 billion between Bitcoin and the next rank. At the current price and trajectory, that gap is not theoretical; it is a measurable structural target.
The market cap expansion is worth contextualizing. Issue #13 recorded Bitcoin’s market cap at $1.397 trillion on April 6. The current reading of $1.578 trillion represents a roughly 13% increase over that period — meaningful relative value gain in a compressed timeframe, driven by the price recovery from the $65K–$67K cycle low through the $74K stabilization break and into the current $78K–$79K range.
The cross-asset comparison on this snapshot is notable. Gold sits at #1 with $32.058 trillion, down from the $32.61 trillion reading in Issue #13 — a modest contraction at the top. Silver is at #4 with $4.271 trillion, recovering from the $4.12 trillion reading recorded six weeks prior. Both precious metals are printing red today, −0.73% and −0.72% respectively, while Bitcoin is +0.80%. The behavioral pattern observed on April 6 — Bitcoin higher while traditional safe-haven assets posted mixed or negative returns — is repeating on this session. That is now two documented data points, not one.
The equity environment on this snapshot is mixed. Apple is the standout at +3.32%, with Microsoft +1.51% and Amazon +1.33% adding to the green side. NVIDIA is −0.56%, Alphabet is +0.34%, and Meta is −0.52%. There is no clean directional read on equities — this is not a risk-on or risk-off session in any clear sense. Bitcoin printing +0.80% against that backdrop, and outperforming both precious metals on the day, continues to produce data inconsistent with a simple risk-asset correlation.
The rank structure above #11 is worth documenting as a reference frame. Saudi Aramco at #10 is the immediate target. Above that sits Broadcom at #9 ($1.994T) and TSMC at #8 ($2.062T). The #8 threshold would require Bitcoin to approximately double its current market cap — relevant for cycle framing, not near-term analysis. The intermediate target is $10, and the gap is $195 billion.
Behavioral note for the record: Bitcoin has now held rank #11 through a multi-week corrective phase in equities, a partial precious metals drawdown, and a Bitcoin price recovery from $65K to $79K. The rank was not held passively — it was earned against a contracting gold market cap and a Bitcoin price that recovered more than it gave back. Whether the #10 rank requires another broad-market drawdown or a Bitcoin-specific leg higher will be determined by the next price sequence. The structural case for the former remains intact until the weekly closes above $94K.
Bitcoin News
Highlights from the month of April
U.S. Military Is Running a Bitcoin Node — Admiral Paparo
INDOPACOM commander Admiral Samuel Paparo testified before both the Senate and House Armed Services Committees this week, disclosing that the U.S. military is running a live node on the Bitcoin network and conducting operational tests to secure and protect networks using the Bitcoin protocol. Paparo framed the military’s interest explicitly as a computer science matter — cryptography, blockchain, and proof of work — not a financial or reserve asset question. Bitcoin MagazineBitcoin Magazine
Structural read: The distinction Paparo drew is the relevant one. The military is not buying Bitcoin. It is testing Bitcoin’s protocol architecture as a network security and power projection tool — framed explicitly in the context of strategic competition with China. The financial narrative and the national security narrative are separate threads. This one belongs to the second category. Worth watching, not conflating.
Riot Platforms Sells 3,778 Bitcoin in Q1
Riot Platforms sold 3,778 bitcoin in Q1 2026, generating $289.5 million — roughly 2.6 times the 1,473 BTC it produced during the quarter — as the company redirects capital toward AI and high-performance computing infrastructure. Bitcoin holdings fell to 15,680 BTC by quarter’s end, down 18% year-over-year, with 5,802 BTC of that total classified as restricted.
Structural read: Riot is using its bitcoin treasury as an operational funding mechanism, not holding as a passive reserve. Selling 2.6x quarterly production signals deliberate drawdown, not routine profit-taking. The pivot to AI data center infrastructure is the corporate thesis — bitcoin is the balance sheet vehicle funding it. This is miner-to-market supply pressure that is quantifiable and trackable. It is not distressed selling, but it is selling. Context for the supply side of the tape.
Japan Moves to Classify Bitcoin as a Financial Instrument
Covered in Issue #15. Japan’s FIEA reclassification bill advances the regulatory normalization narrative. No new material developments this week beyond the bill’s continued legislative progress.
Iran to Accept Bitcoin for Strait of Hormuz Transit
Covered in Issue #15. The transit toll mechanism remains the operative detail — a nation-state accepting Bitcoin as settlement for strategic waterway access is a structural demand-side development, not a speculative one.
Morgan Stanley Launches First U.S. Bank Spot Bitcoin ETF
Covered in Issue #15. The MSBT launch positions Morgan Stanley as the first U.S. bank to bring a spot Bitcoin ETF to market directly. Demand-infrastructure expansion. Not a price catalyst.
Goldman Sachs Files for Bitcoin Premium Income ETF
Covered in Issue #15. Goldman moves from holder of third-party spot BTC ETFs to manufacturer of a covered-call yield product. Wall Street is building yield structures on top of Bitcoin exposure — a different instrument with a different objective than spot accumulation.
Pakistan Ends 2018 Crypto Banking Ban
Covered in Issue #15. The Virtual Assets Act 2026 opens formal banking rails to licensed operators in a 240-million-person market. Regulatory normalization at the infrastructure level. Banks remain barred from direct exposure.
If you have any suggestions, feel free to reach out to me on X @WillSanchezJr. I’m always looking to improve and add value in ways others might enjoy — just keep it Bitcoin only.
Live free and stack sats,
Will
The return of money is more important than the return on money.
— Steff
What Is A.W. Block?
A.W. Block is a digital asset estate investigation and advisory firm. We provide technical support for attorneys, probate administrators, and fiduciaries navigating Bitcoin and digital asset estates — asset identification, blockchain investigation, and court-ready documentation.
awblock.io
Found value? Share, subscribe, and/or send sats here: bc1qrlgzu0m94wdrsnxjg8qym7jtnudelgfypmjmaa
P.S.
If the structure in this issue makes sense but you want to understand the why behind Bitcoin’s long-cycle behavior, the latest educational piece is worth your time. It covers Saylor and Breedlove’s framework for money as meta-energy — the most rigorous philosophical case for Bitcoin’s role in civilizational coordination currently in print. The price charts and the theory point at the same thing. It helps to understand both.
Read: Money as Meta-Energy — How Saylor and Breedlove Explain Why Bitcoin Is Inevitable →