

Around the Block | 2
Stay informed with Bitcoin news, technical analysis, and fundamentals—all in one place.

Welcome to the second edition of Around the Block, a Bitcoin newsletter. Whether you're a seasoned Bitcoiner—a true Bitcoin Maxi—or just dipping your toes into this revolutionary asset, this newsletter is for you. Whether you trade using technicals or fundamentals, you’ll find value here. For now, this will be a monthly deep dive released on the first Monday of each month—focusing on the meat and potatoes of Bitcoin, not the fluff. There’s a lot of nothing-burger news and noisy charts out there, but I believe it’s best to zoom out, reflect, and focus on the bigger picture.
For daily insights, discussions, and weekly updates, you can find me on X @WillSanchezJr. If you like what you read, share it with a friend and subscribe. For now, this newsletter is free for all to enjoy.
None of what I say is financial advice.
And like one of my favorite Bitcoin quotes goes: “Don’t trust, verify.”
With that being said, let’s dive in.
Technicals
Monthly
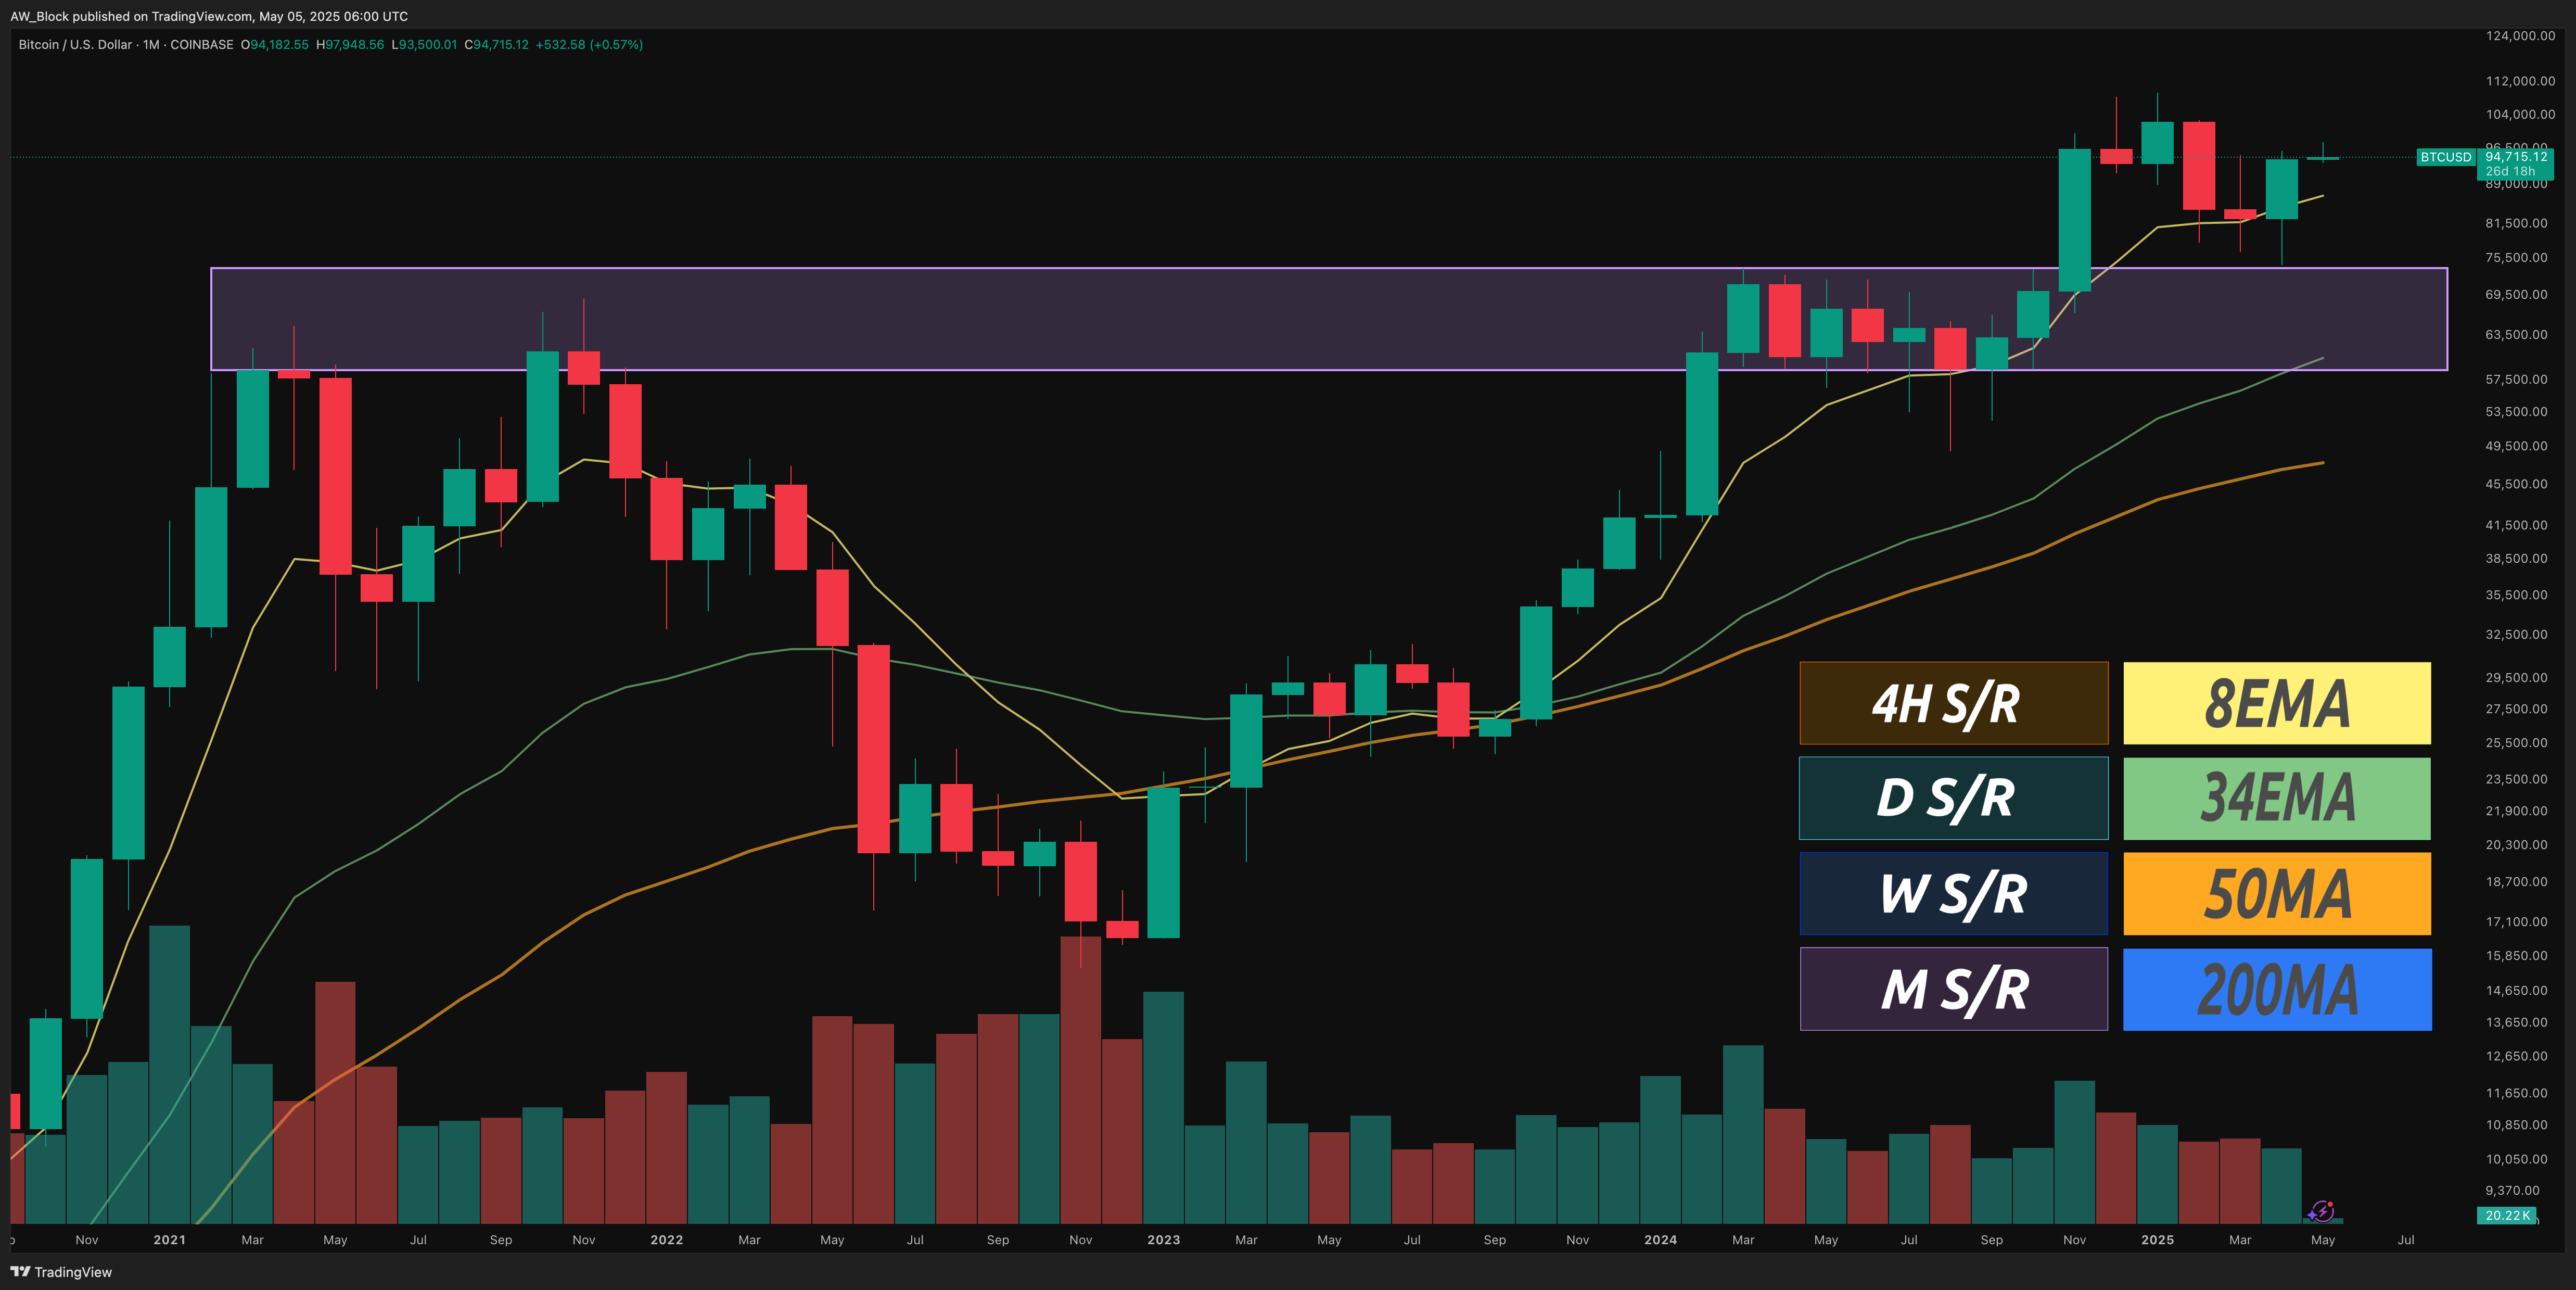
Not much has changed from a monthly time frame perspective. After all, trading this time frame actively is like watching paint dry. As I’ve said before, this looks like a breakout from the range and a retest of that range. So far, though, it hasn’t retested cleanly and instead front-ran the range by $585.12. Also, take note of how the 8EMA has acted as support ever since we reclaimed bullish market structure from this cycle’s bottom.
Weekly
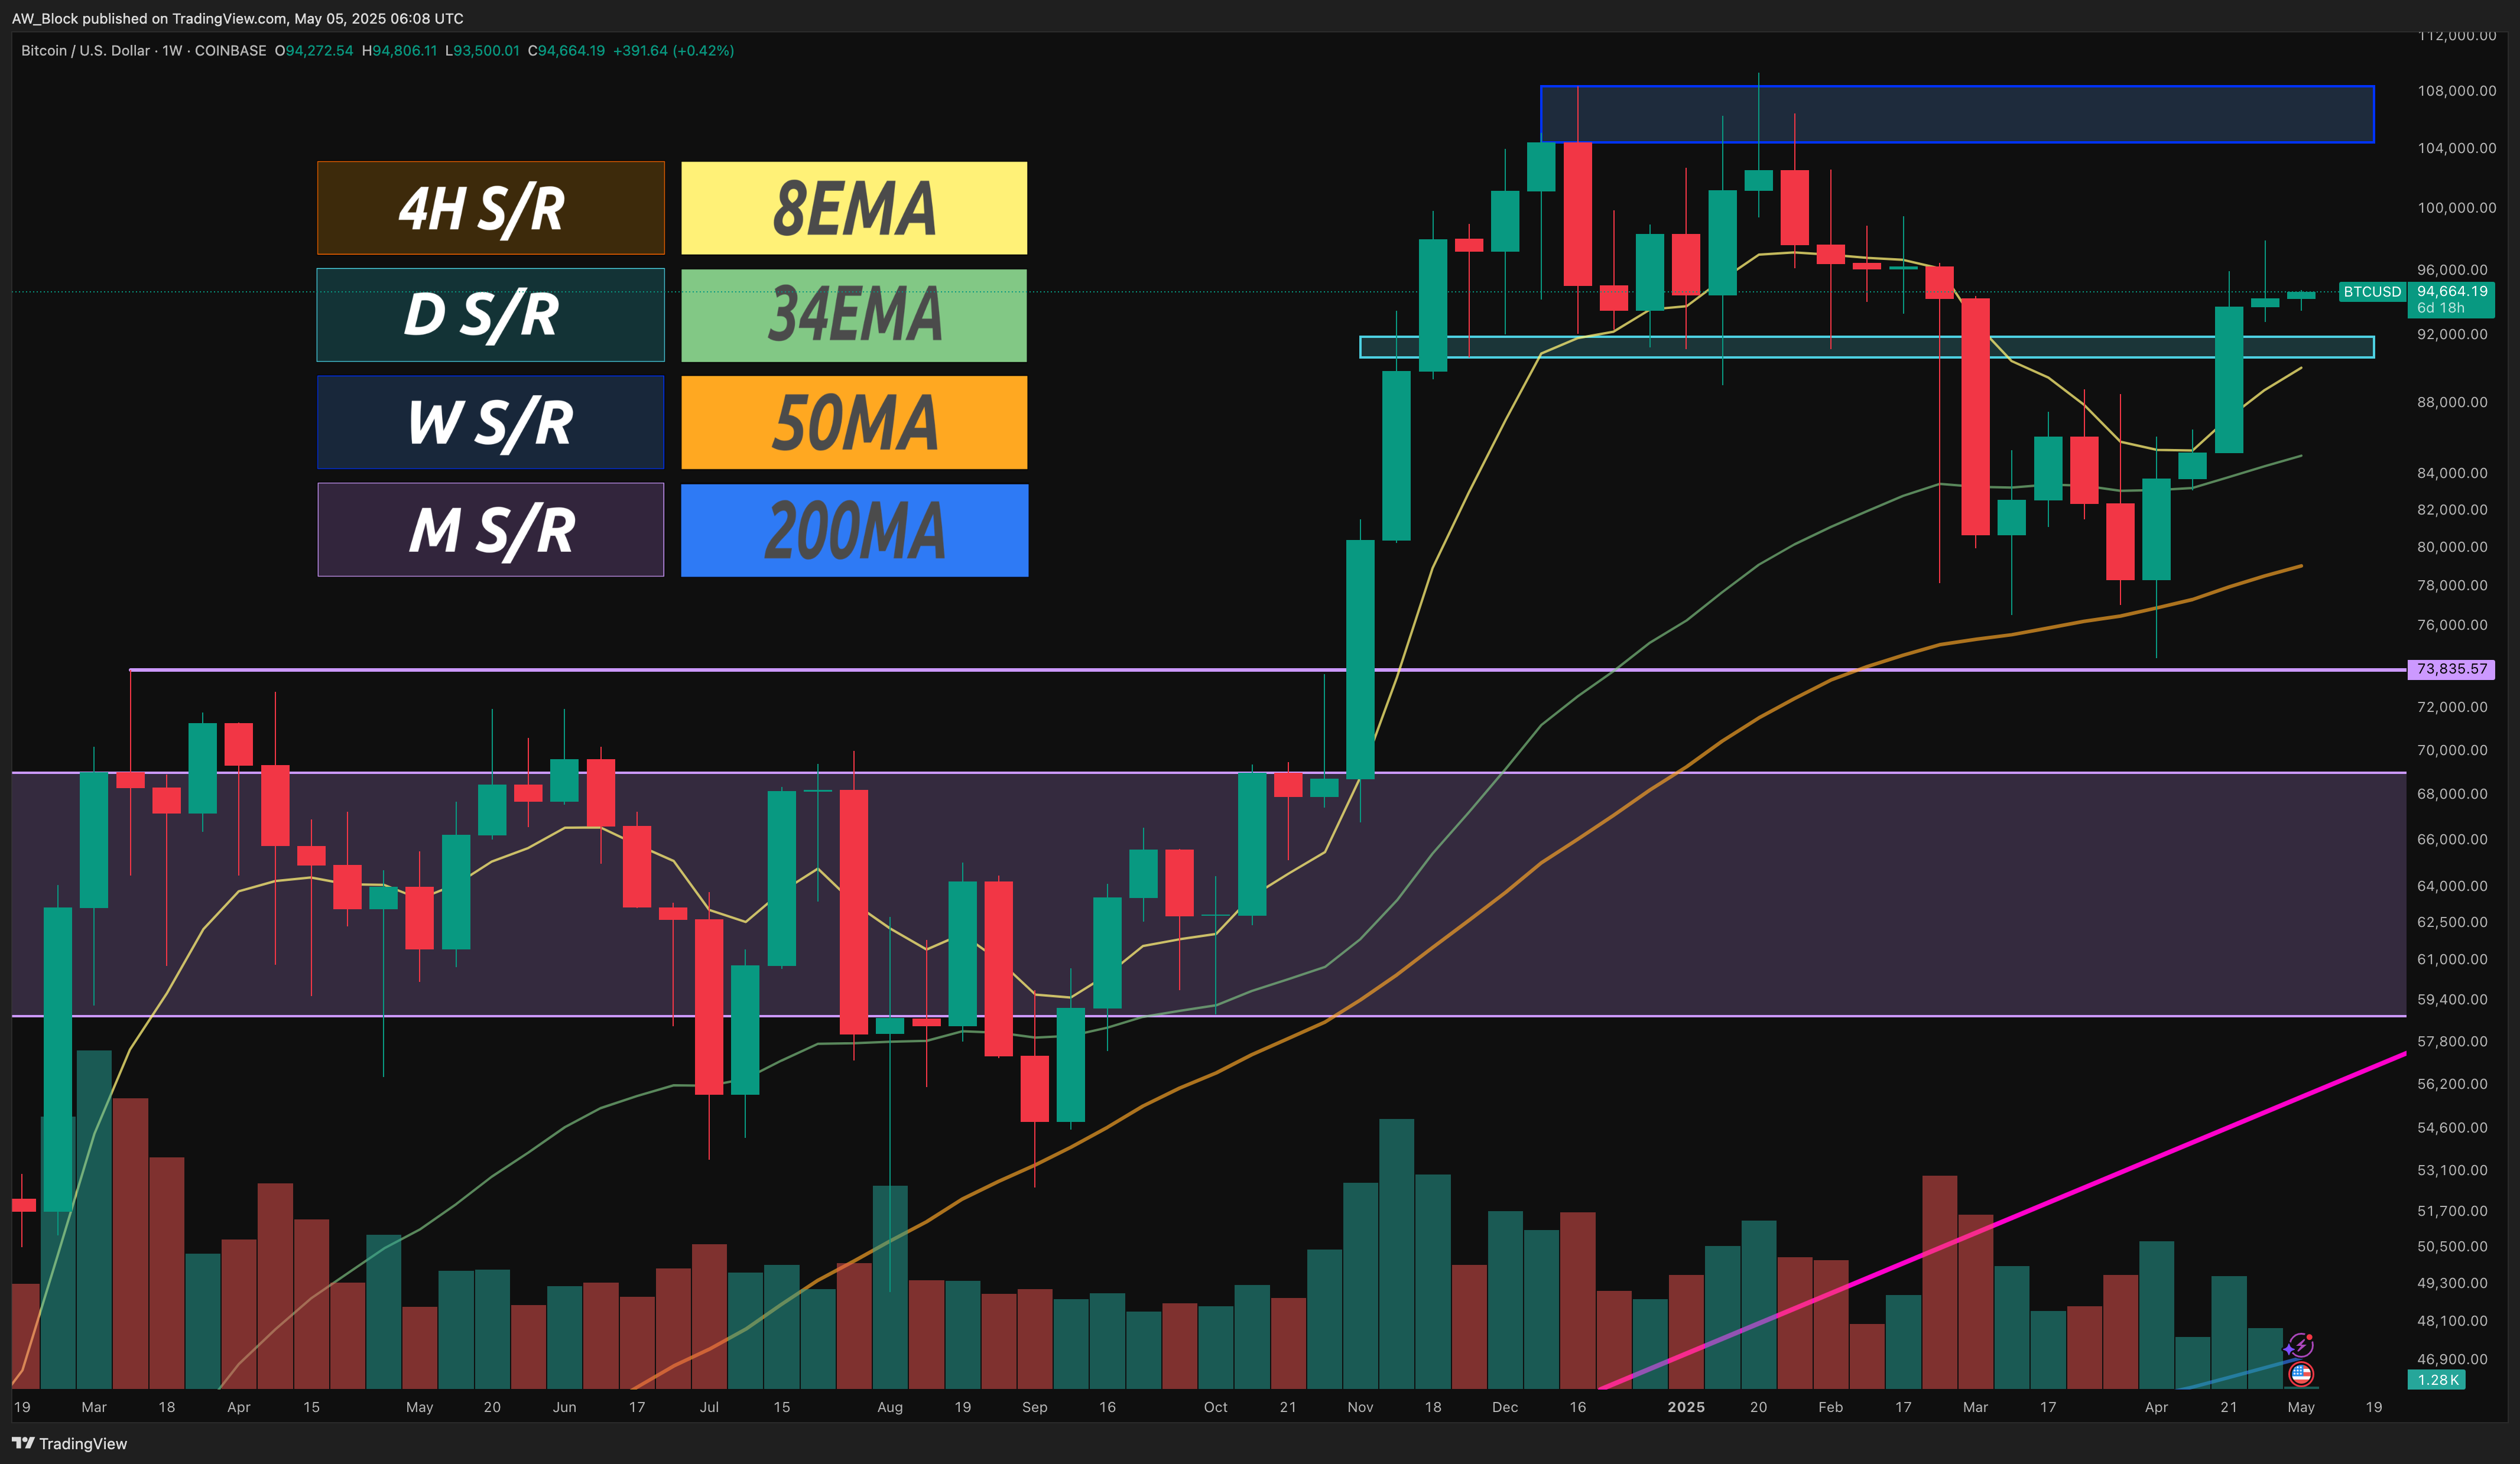
A closer look at the weekly time frame shows momentum building off the retest of that prior range. The bulls definitely want to see this range hold as solid support. After six strong years in this market, it wouldn’t surprise me one bit to see price chop around in this range through the summer, before the final leg of the bull run kicks off between September and December 2025.
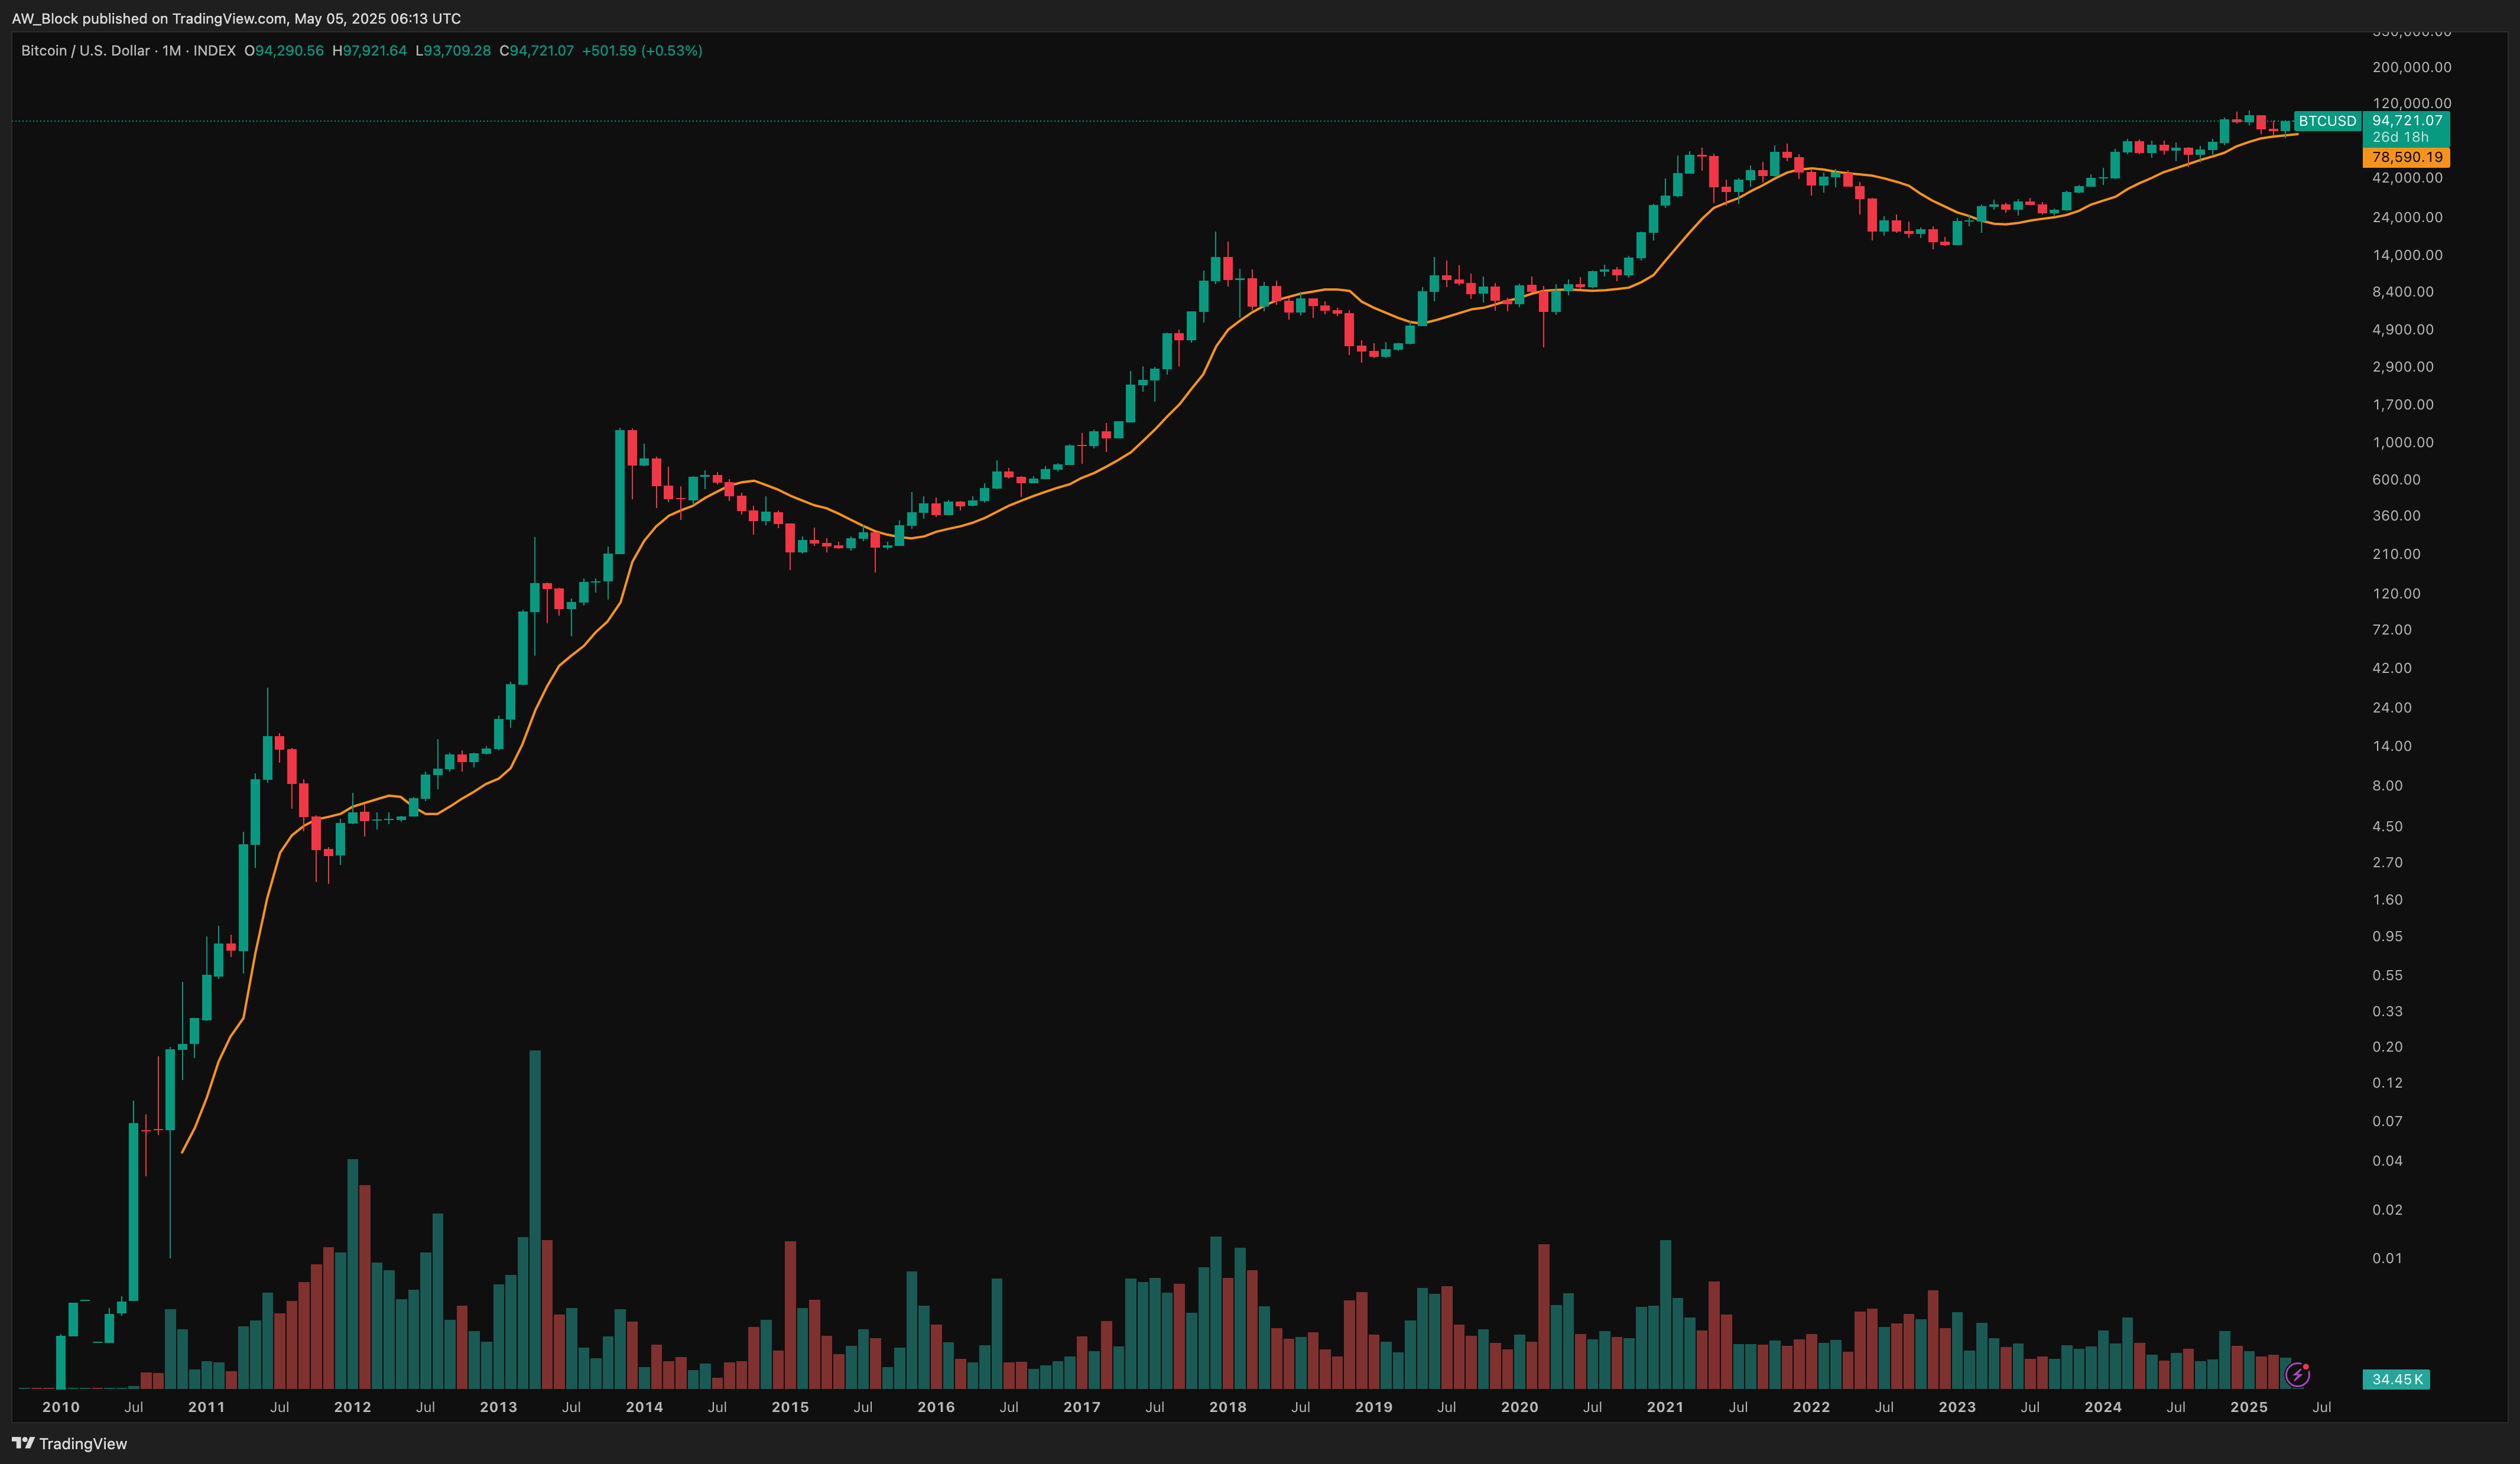
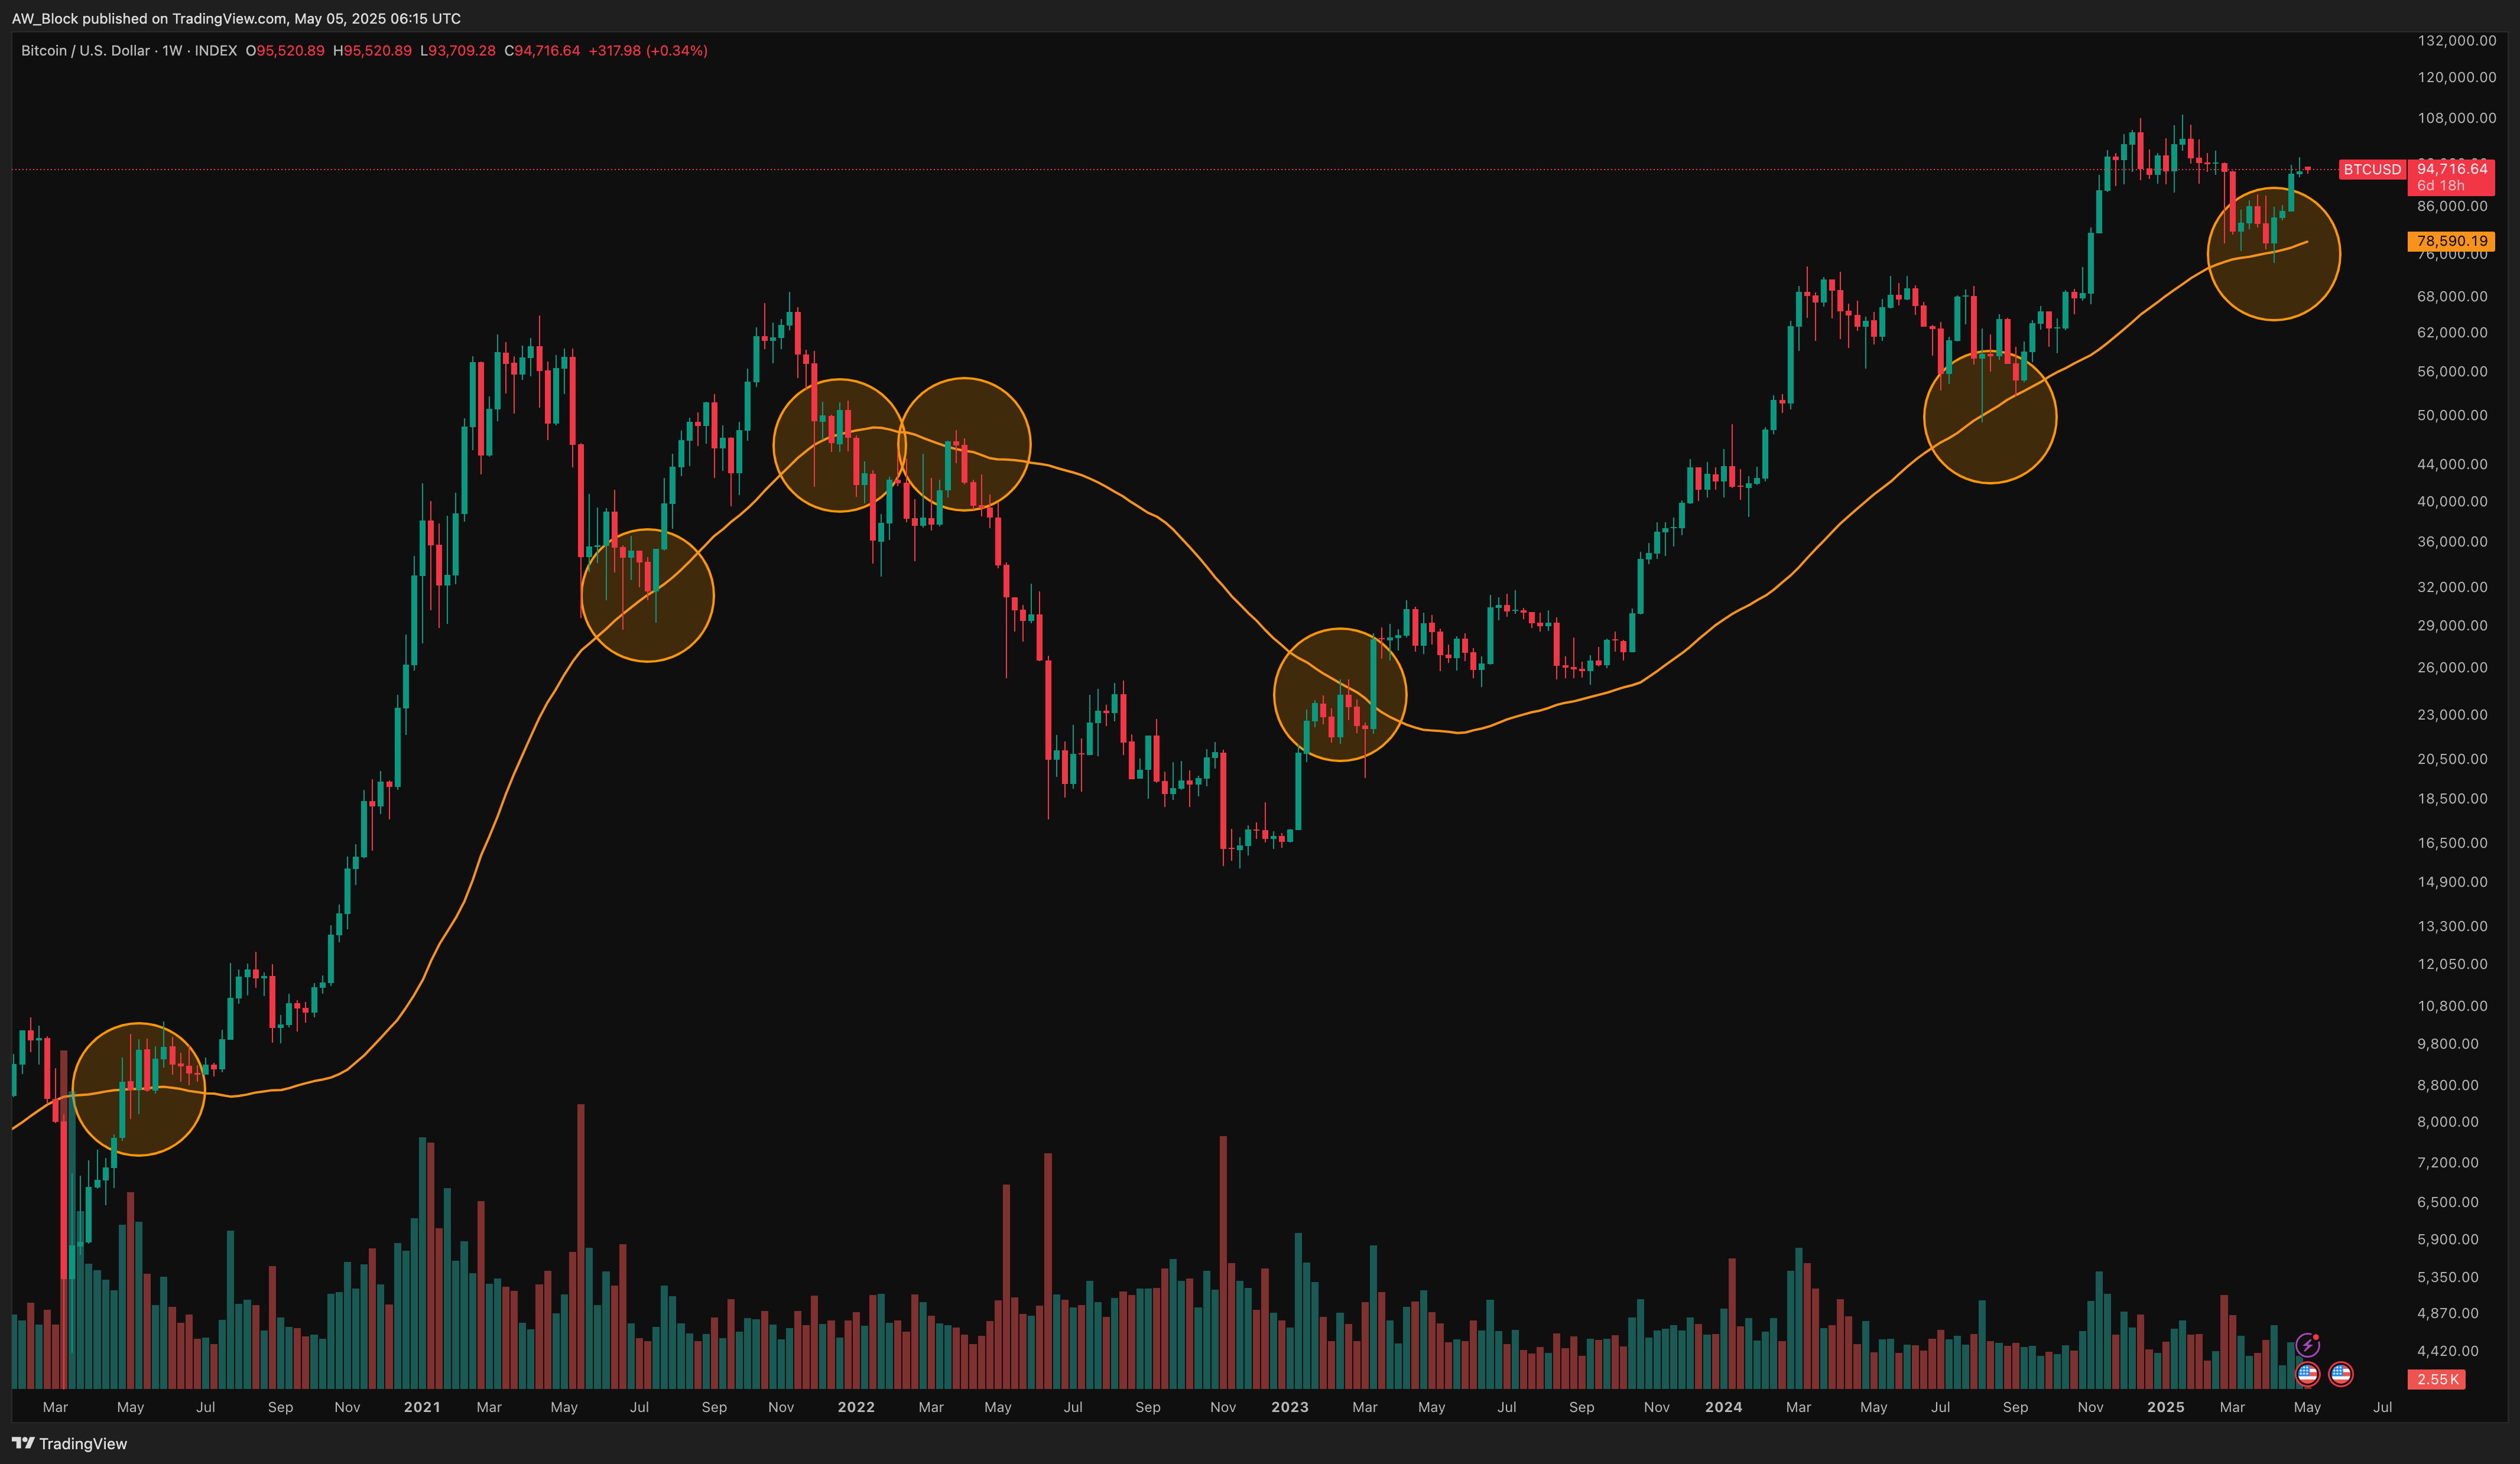
The two pictures above reference the 50WMA and how price reacts around that level — the top picture showing the monthly time frame, and the bottom showing the weekly. Caution is warranted if price starts closing below the 50WMA. At that point, if you see more confluence of bearish signals alongside other technical tools, it’s wise to take some risk off and prepare to buy the bigger-picture dip.
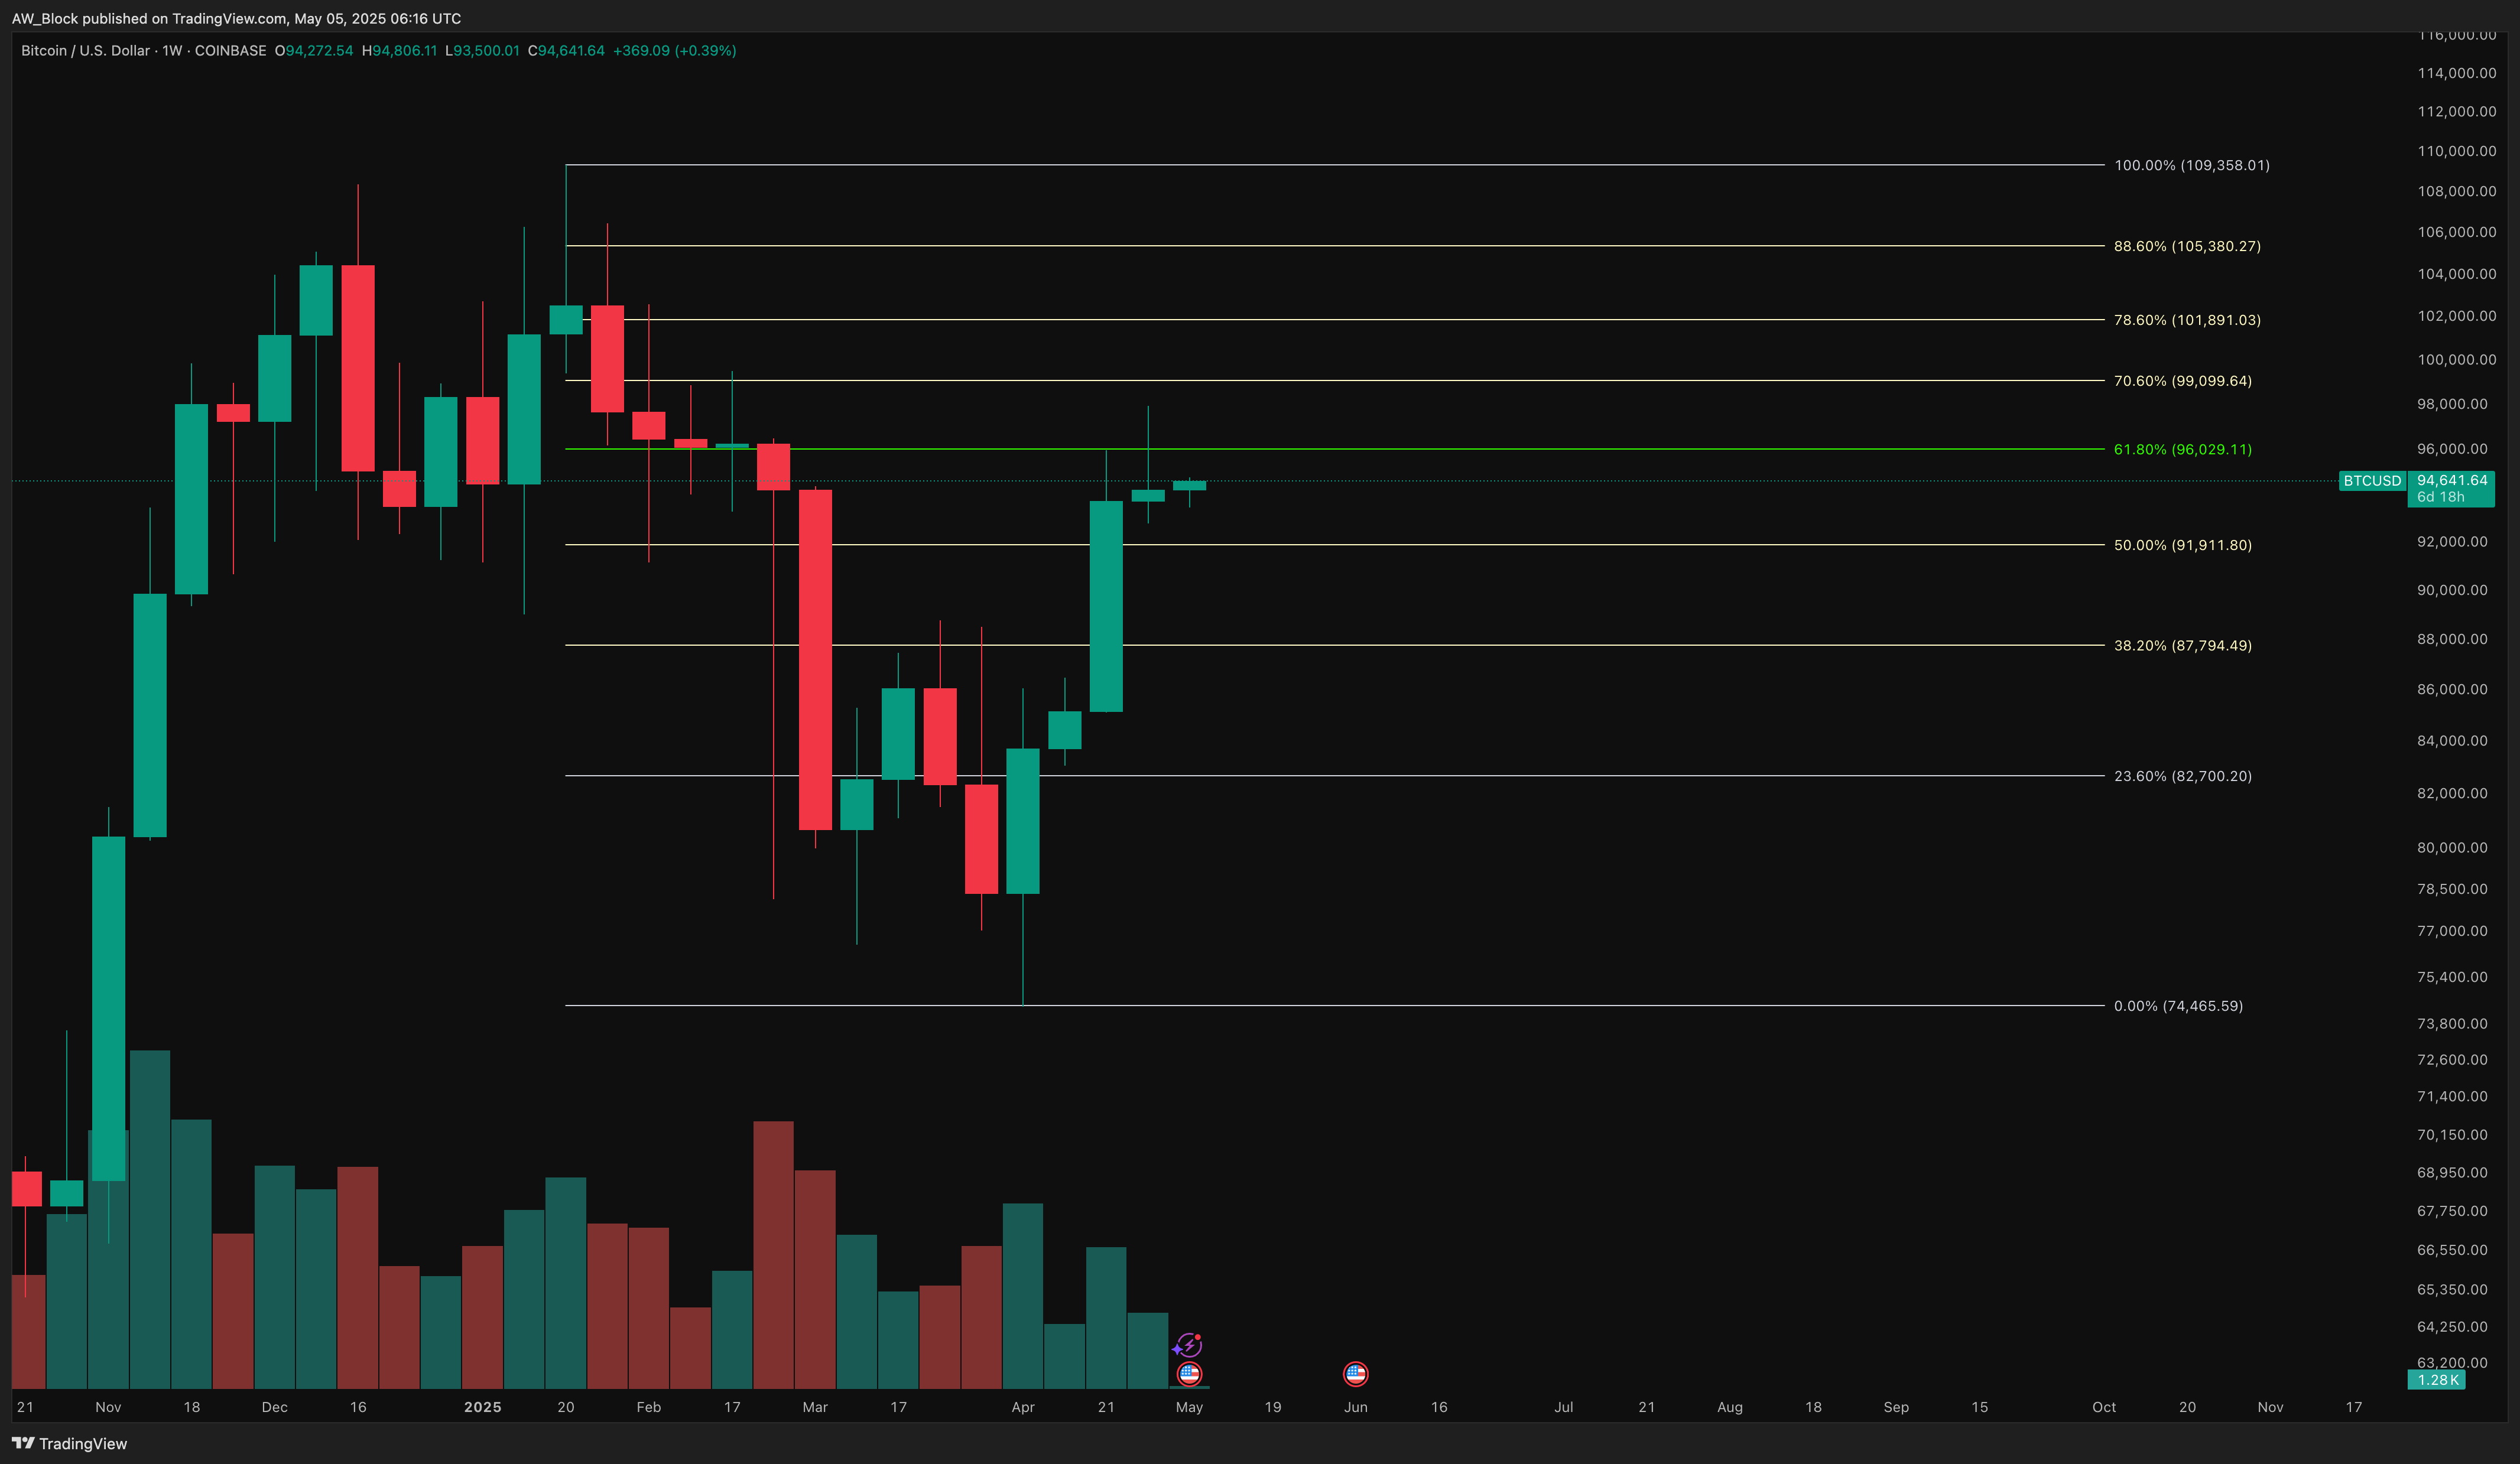
Because I don’t like to just feed you bullishness without acknowledging the other side, it’s worth noting that if you plot a Fib on the weekly sell-off, we’re right at the golden pocket. This could be a reasonable spot for price to cool off for a bit. At this point, I’m ultimately looking for a clean smash through all-time high resistance and a flip of that level into support — that would be one of my key signals that more moon missions are on deck.
Daily
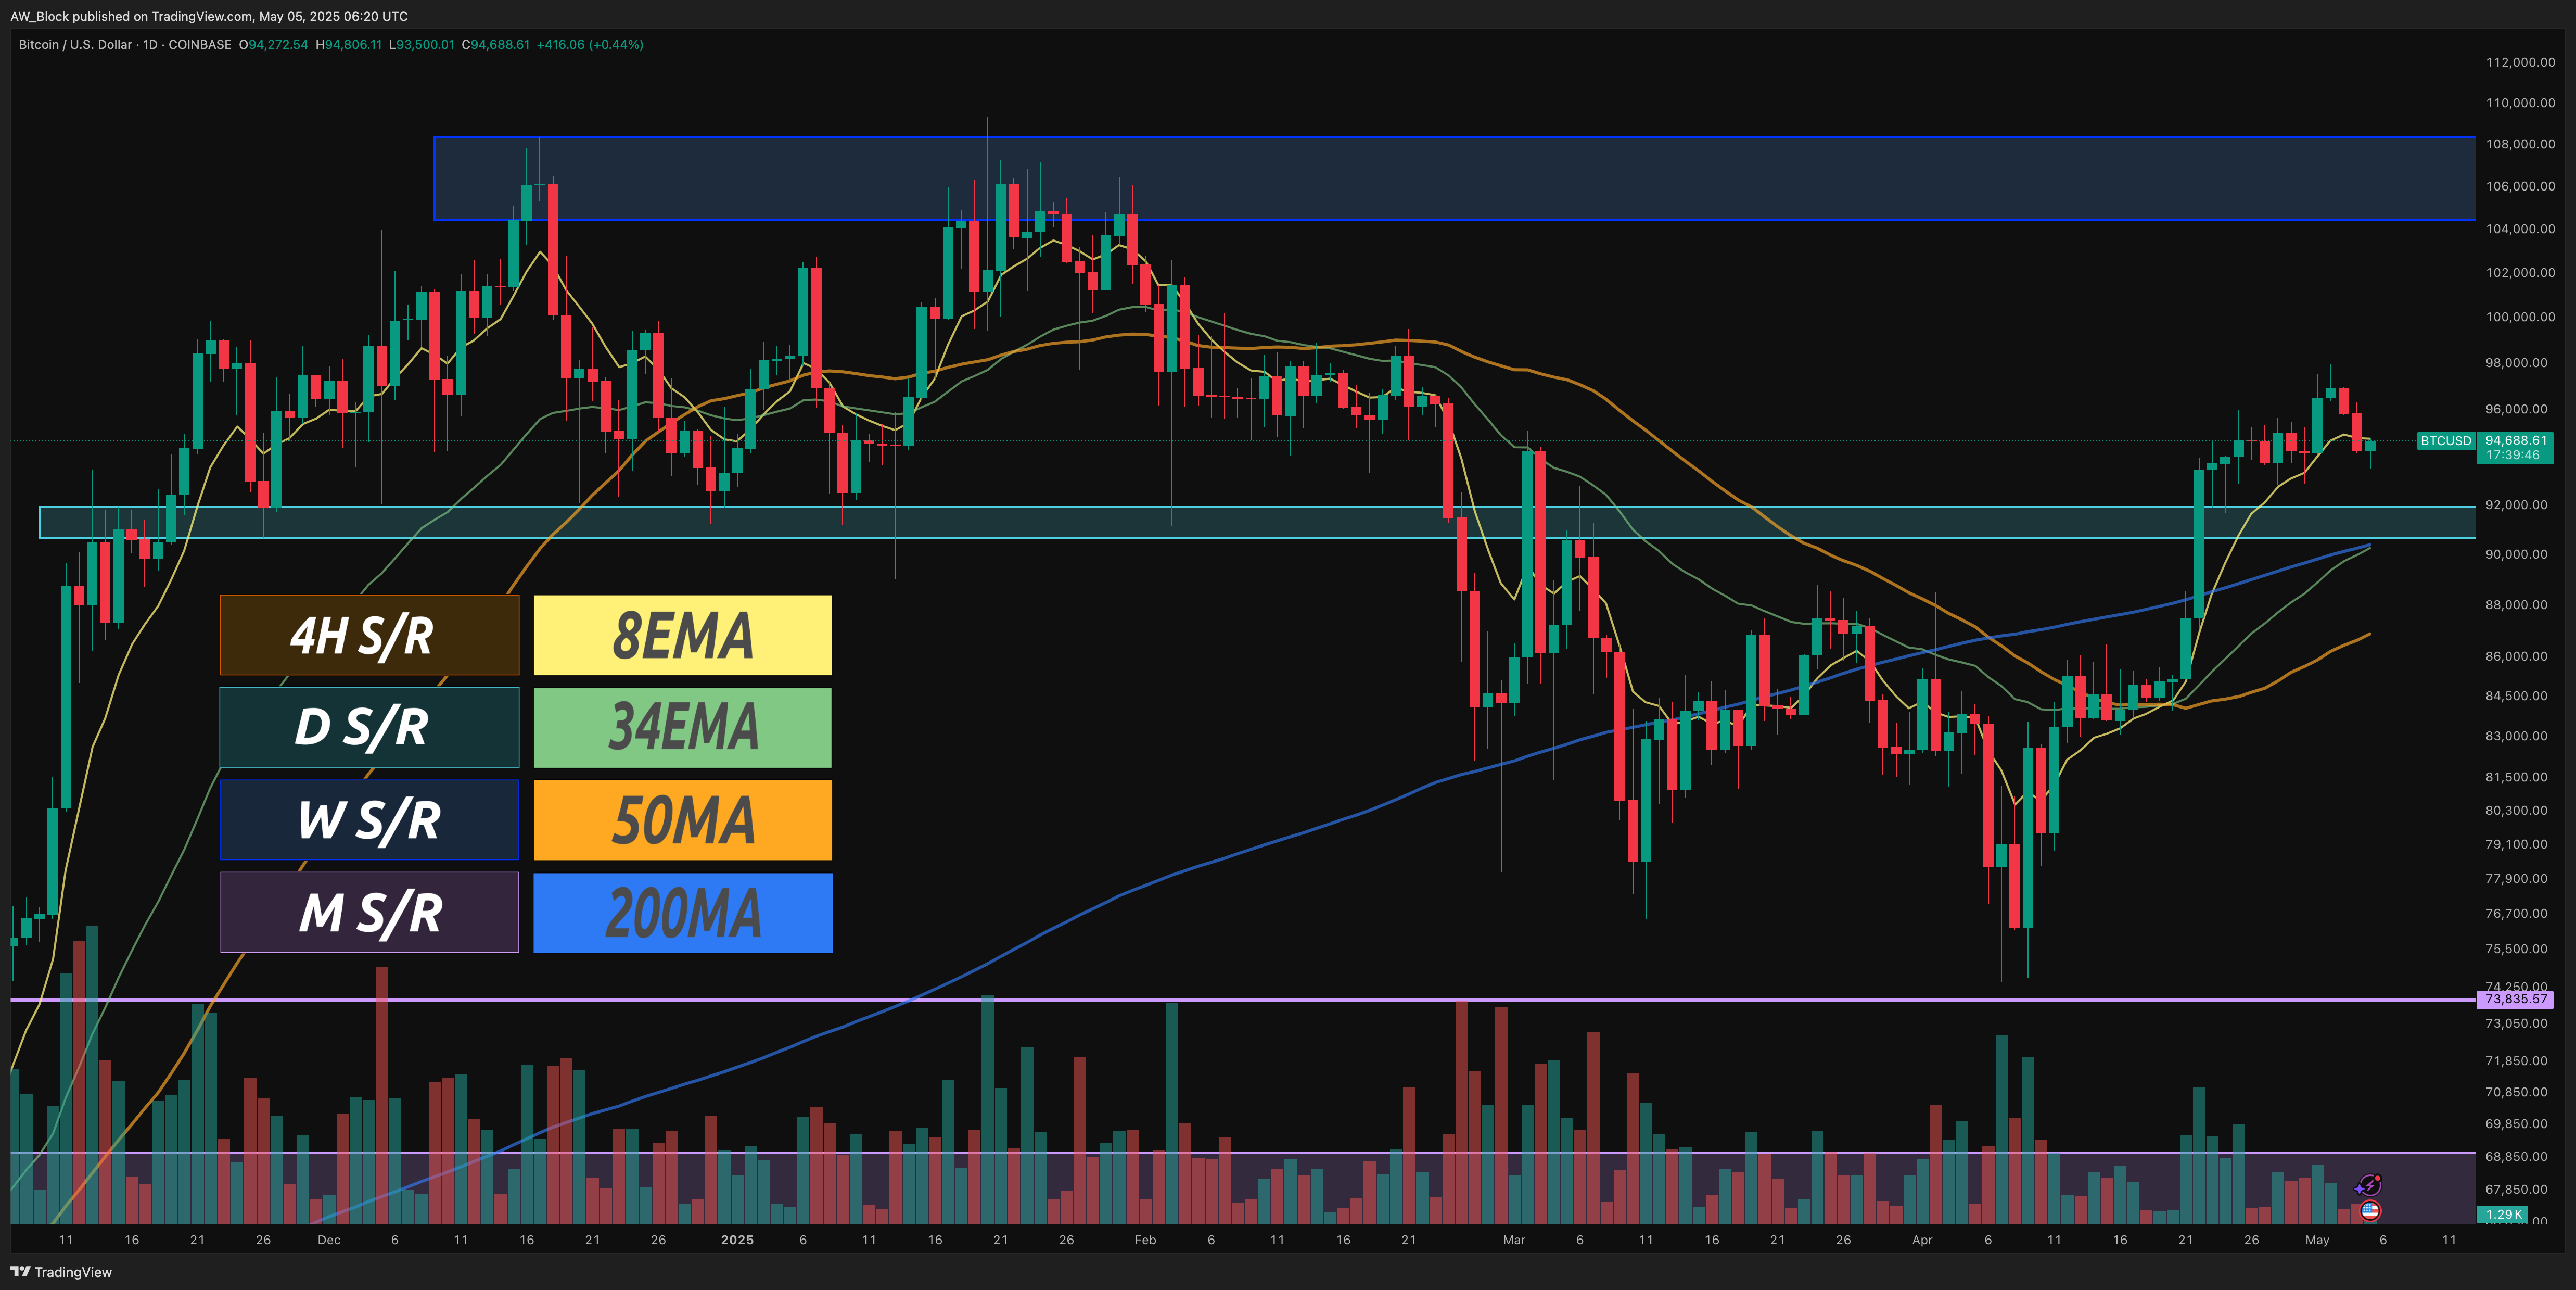
As stated in the April newsletter: “For a stronger outlook, price action needs to reclaim the bottom of the previous upper range, around $90K–$92K. On the daily timeframe, a key hurdle is also reclaiming the 200DMA as well.” And we’ve done exactly that — reclaimed the prior range and the 200DMA. As long as this range holds as support, along with the 200DMA, I’m feeling great. If we were to lose that, in my opinion, it would signal the bears starting to gain some momentum. As a trader, you need to establish your rules for both sides of the ball. On another bullish note, nearly all of the EMAs and MAs I track are pointing upwards.
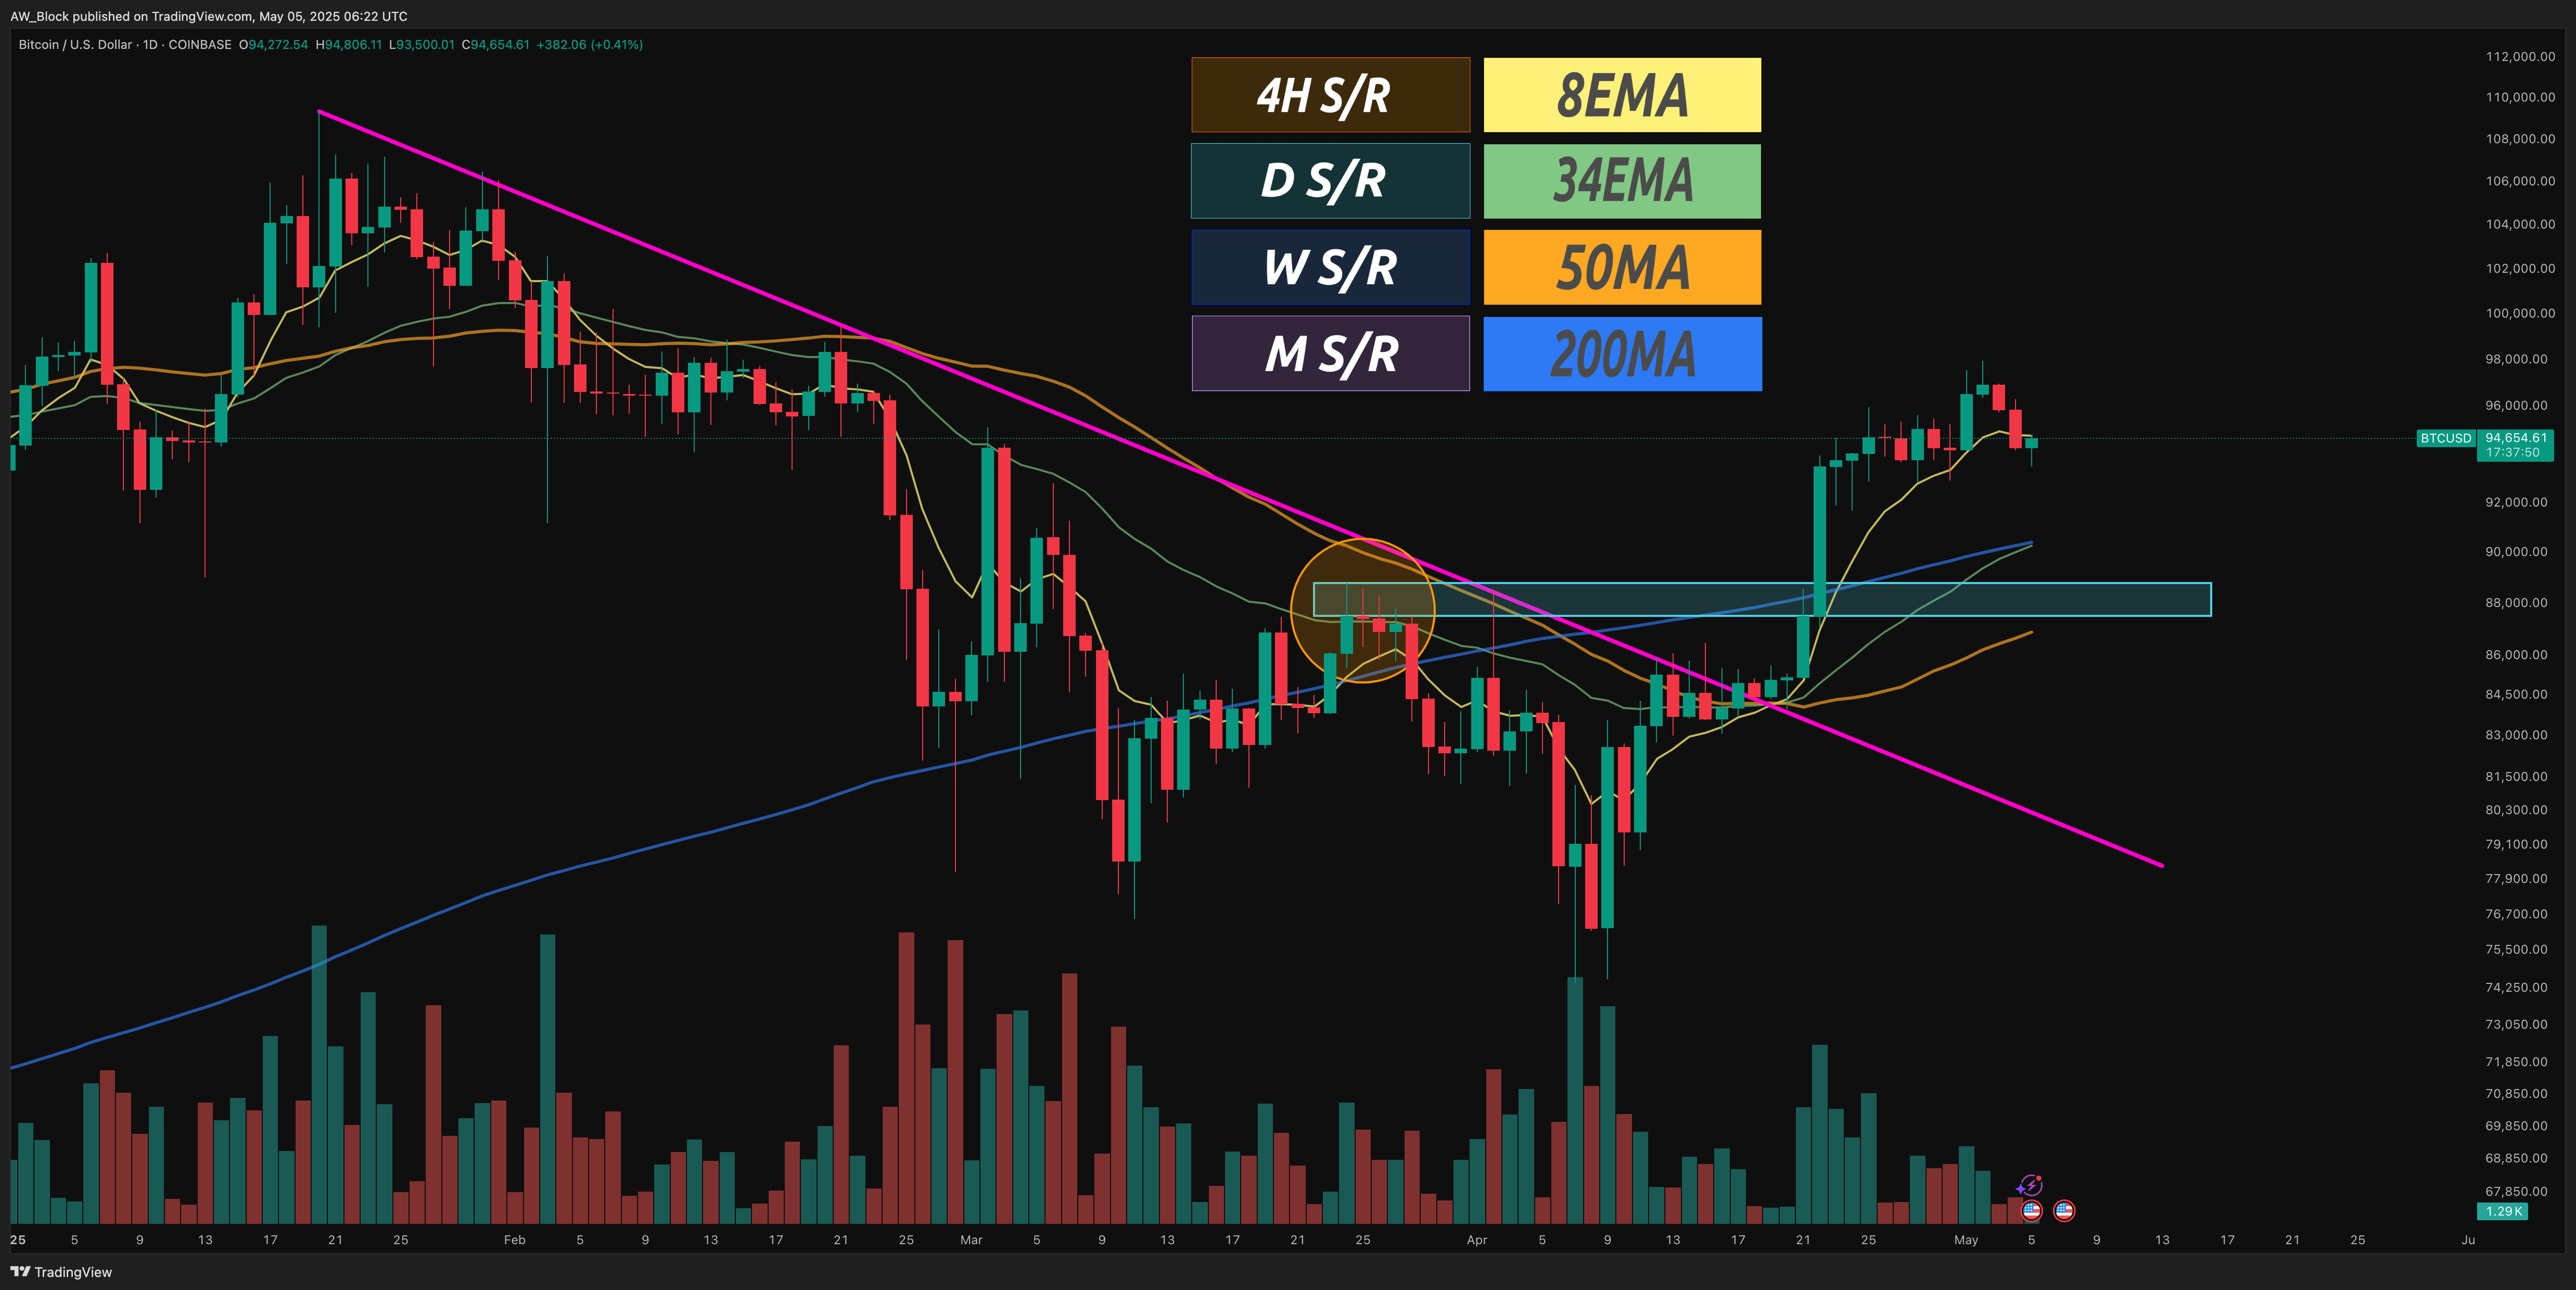
Another thing that has me excited is the fact that we’ve broken the bearish downtrend that’s been in place since we hit all-time highs earlier this year. The shackles of the bearish market structure — with its lower highs and lower lows — have been broken, all while reclaiming the prior range and the 200DMA. I mean, talk about bullish confluence. You love to see it.
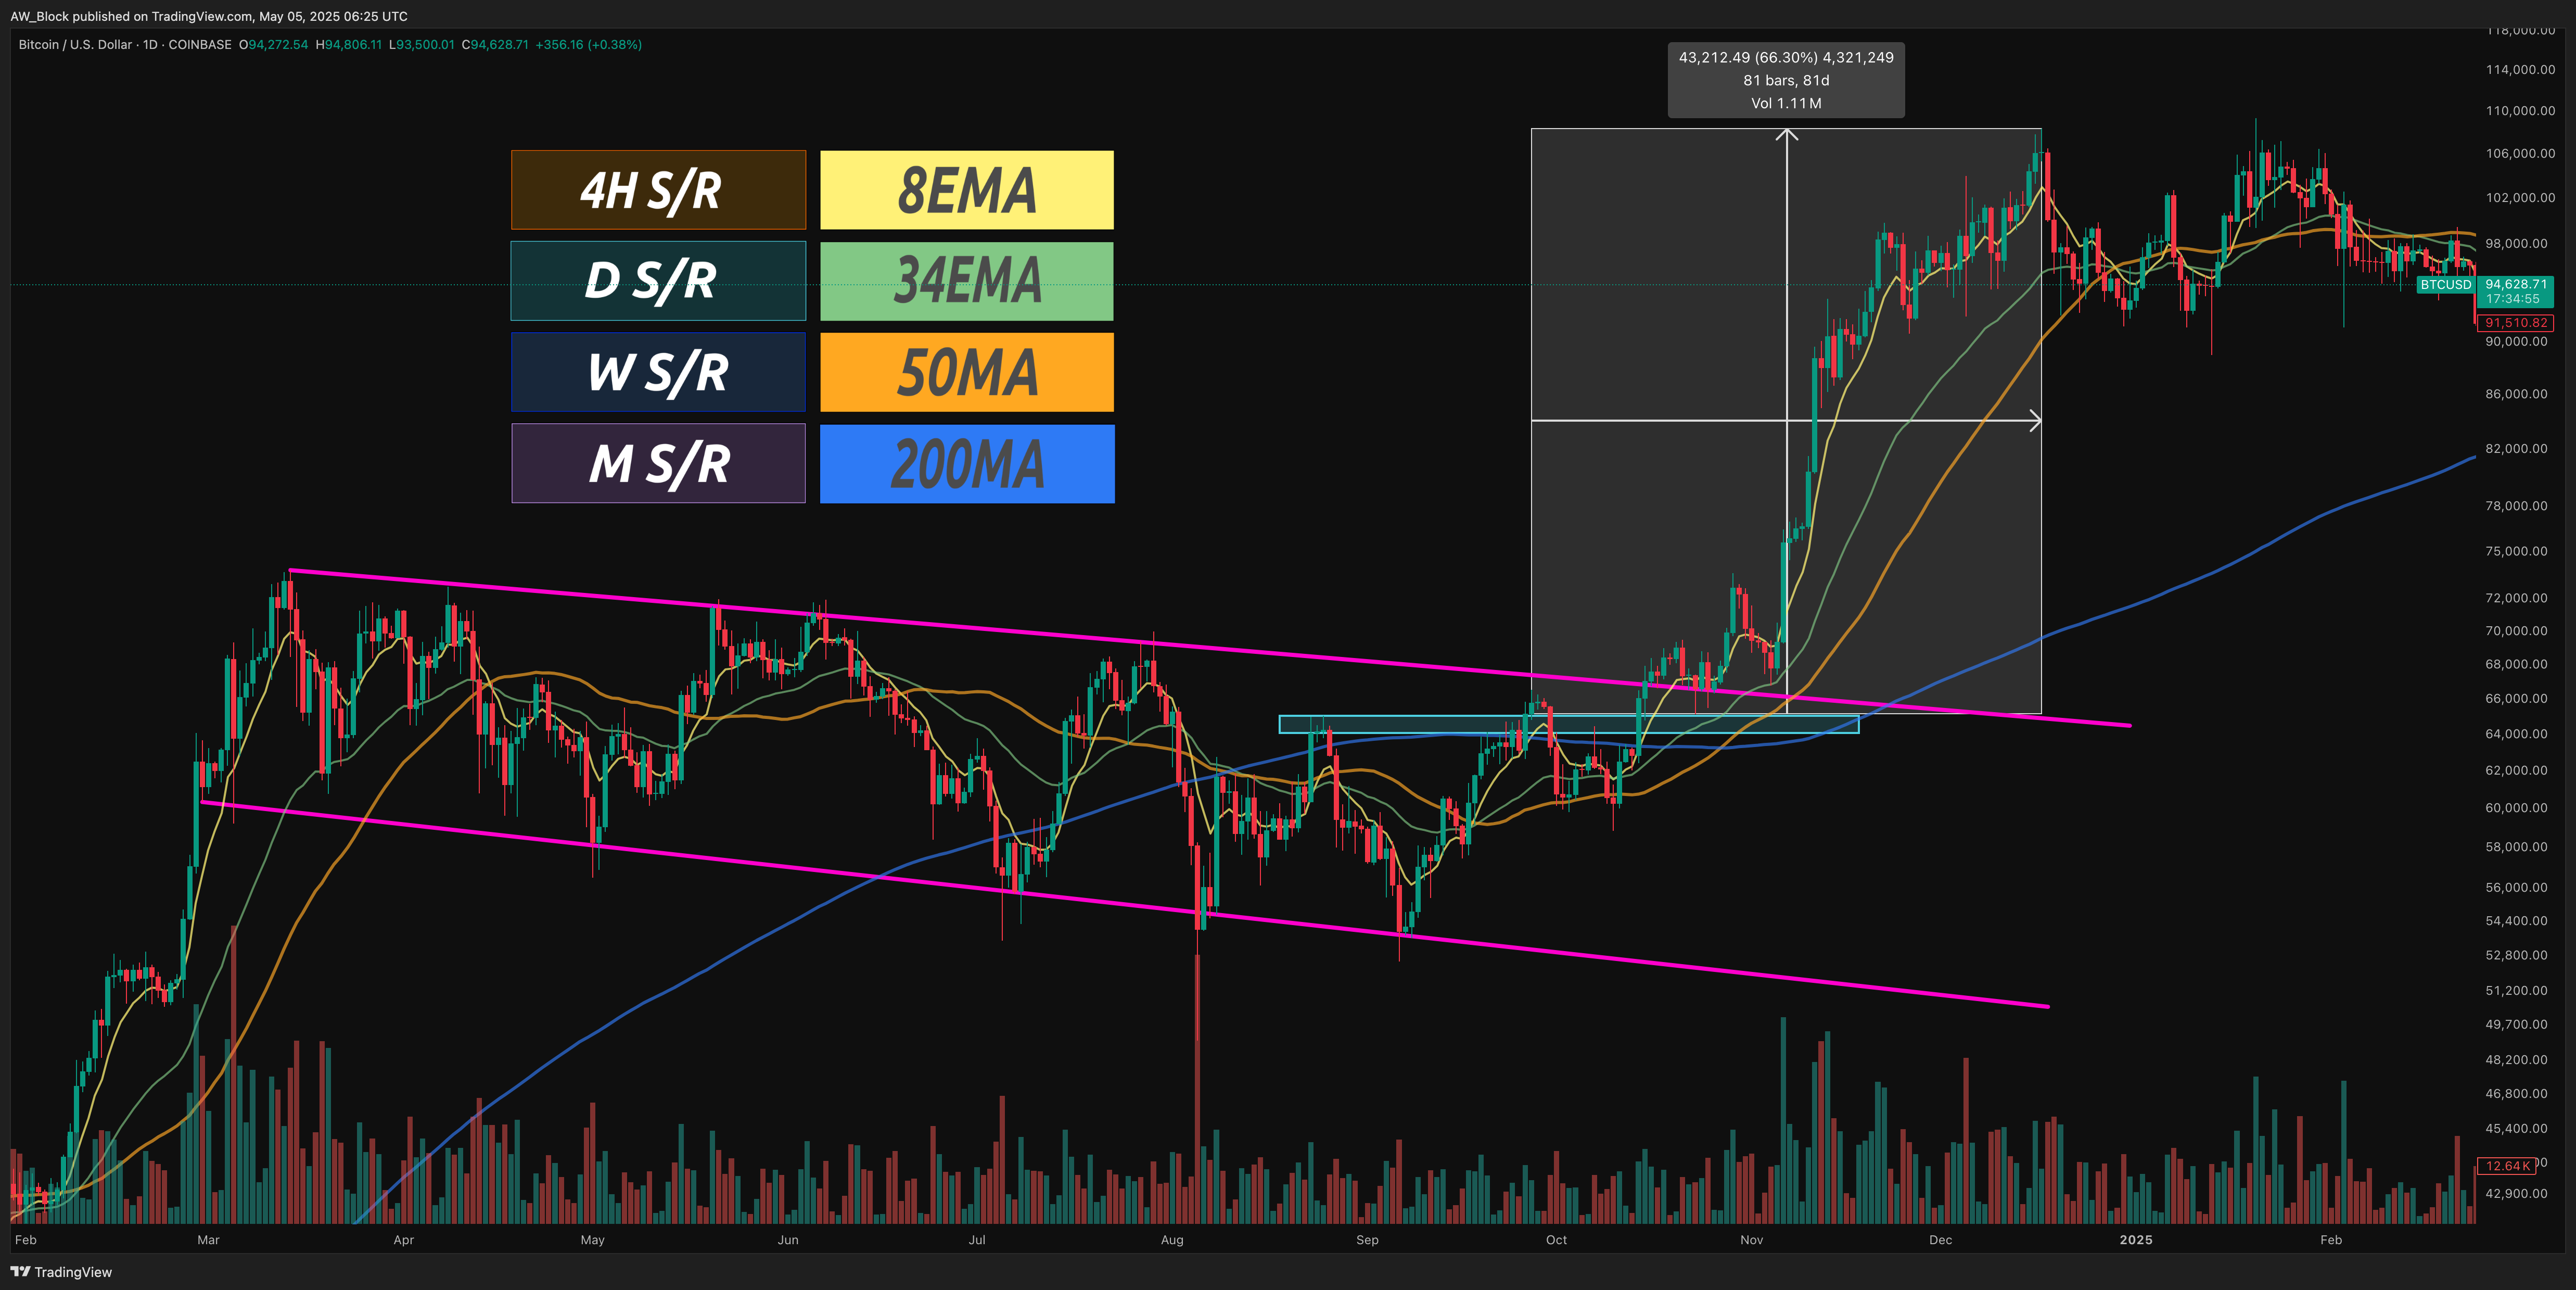
For reference, the last time we broke bearish market structure — back in the fall of 2024 — we rallied 66% in just 81 days. If you’ve got access to a Bitcoin chart, go back and see for yourself how price can move when we break bullish or bearish market structure. Remember the popular saying in trading: “The trend is your friend.”
Fundamentals
Hashrate
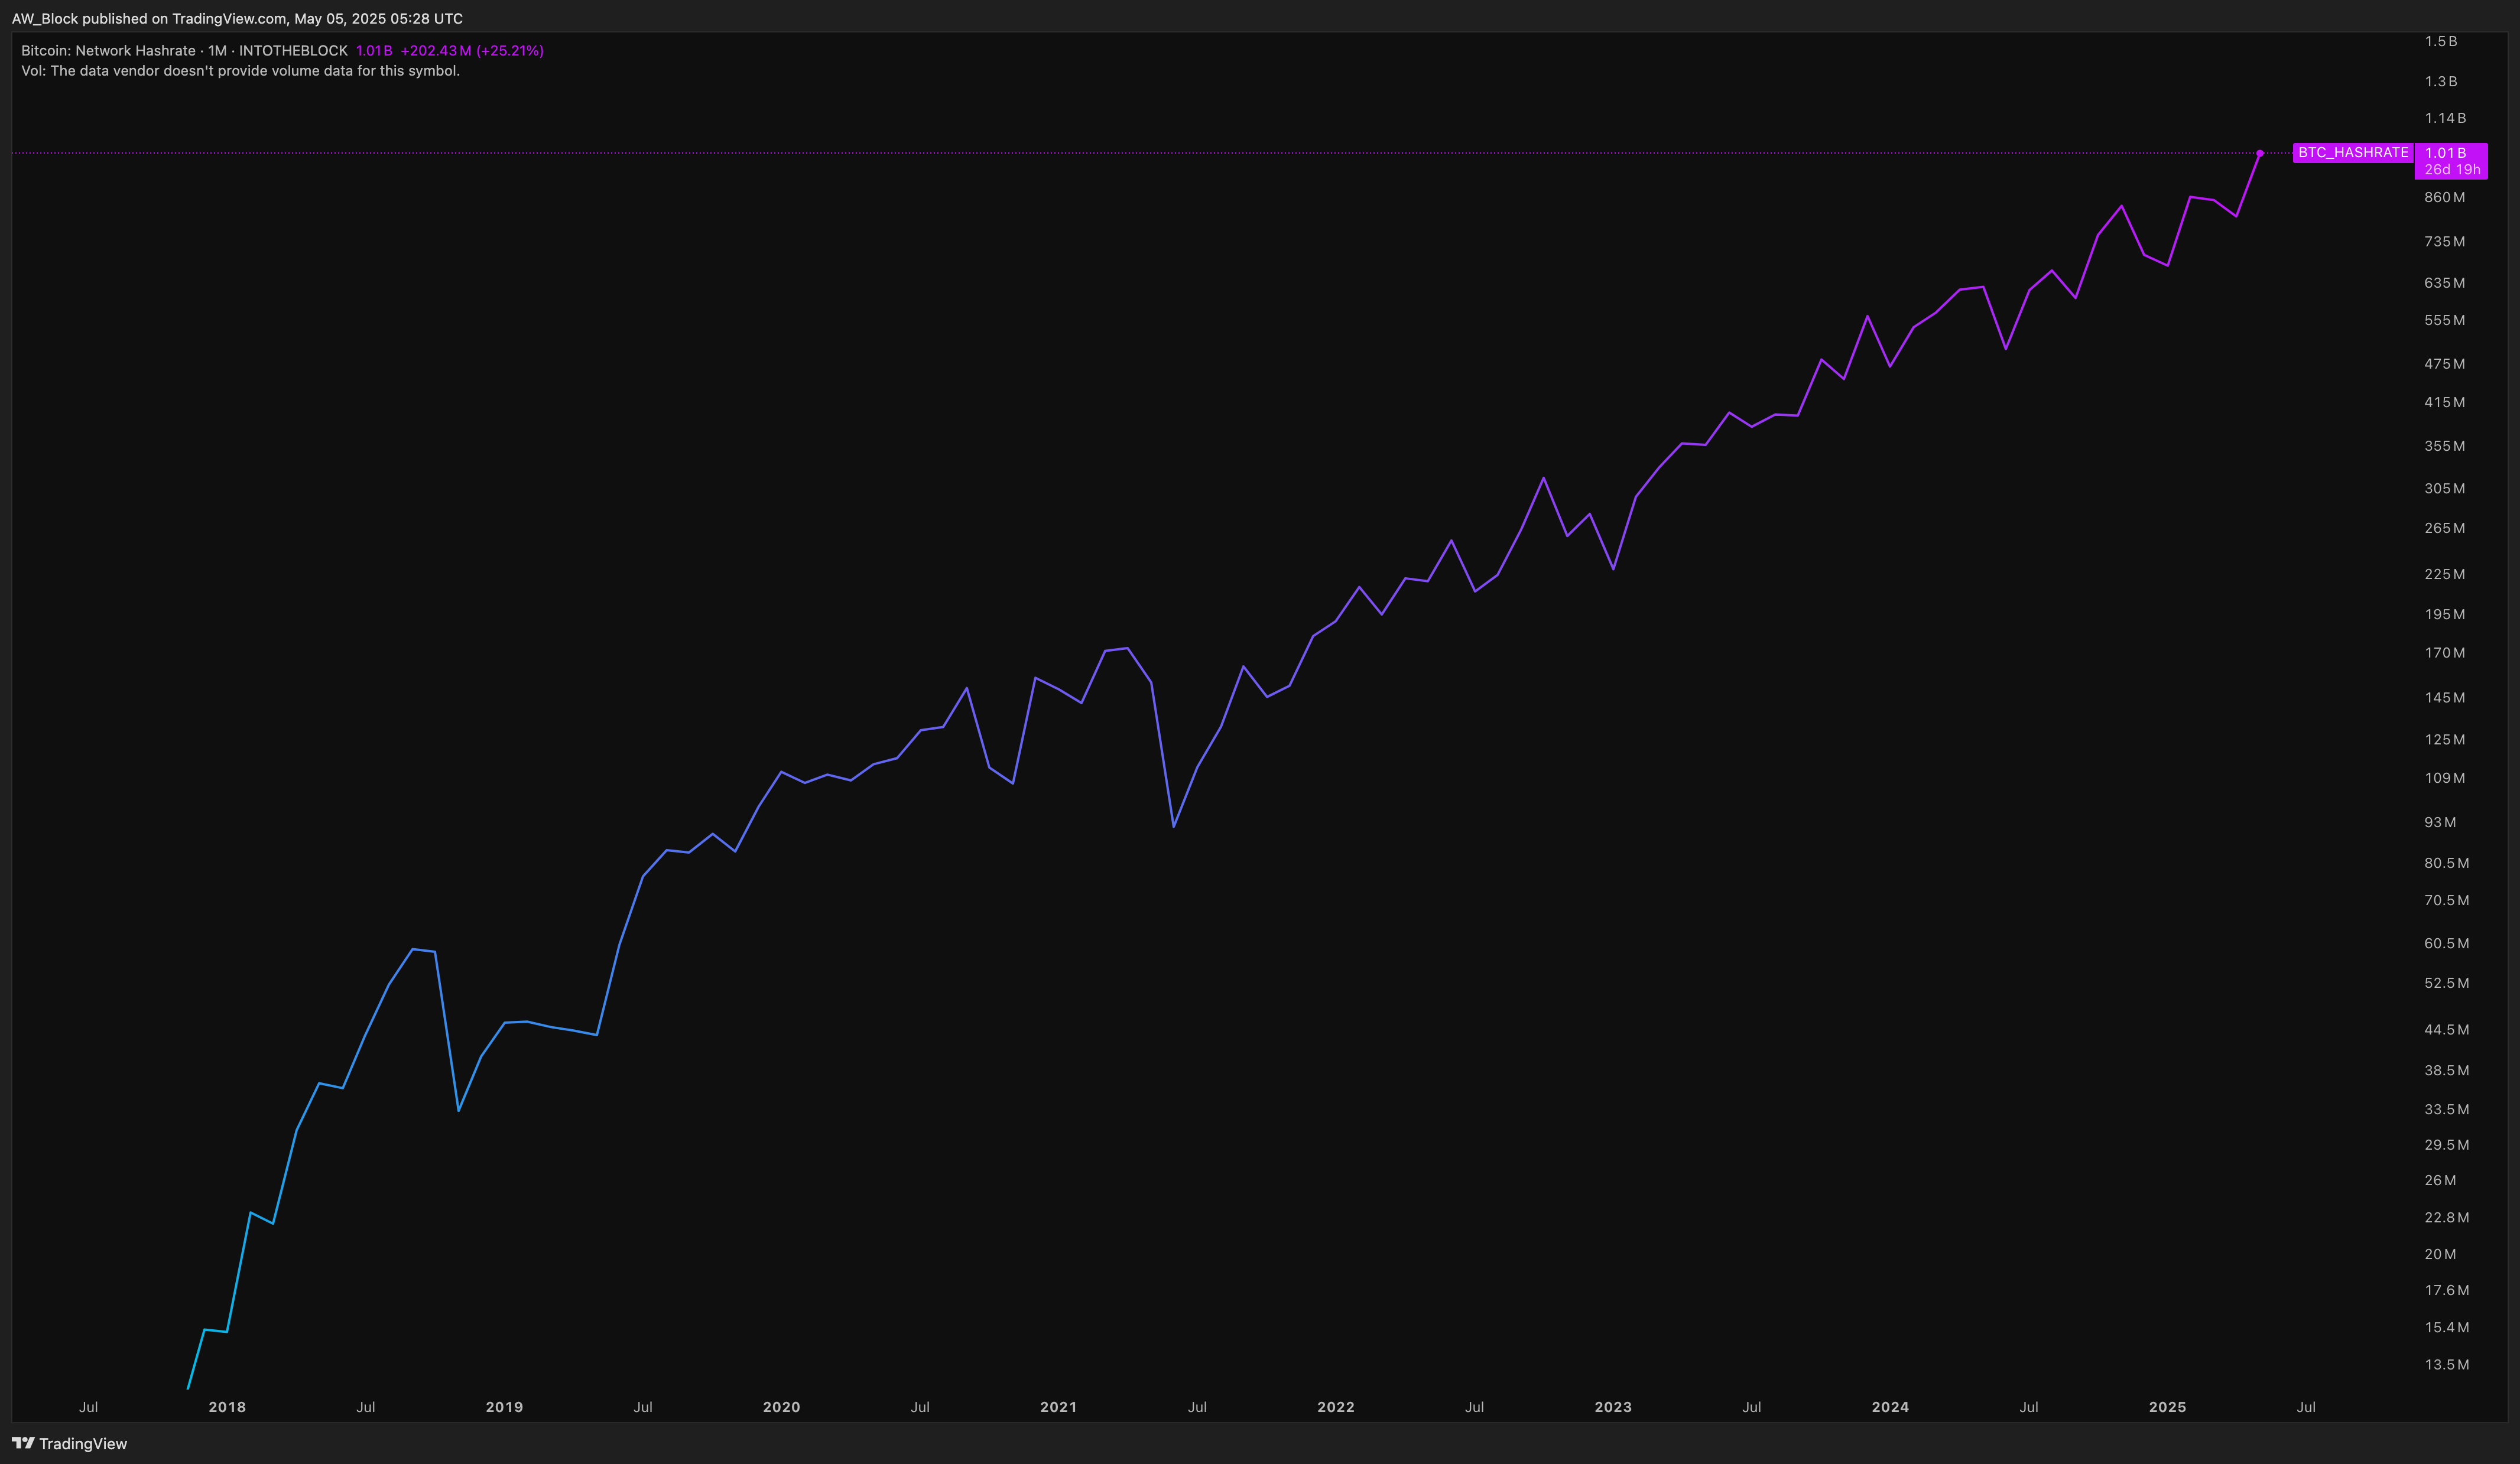
Bitcoin's hash rate measures the computational power used for mining, typically expressed in hashes per second (H/s). But given the scale of Bitcoin mining, we usually see it in much larger units.
Bitcoin’s current hash rate has surged by over 200 Eh/s since our last report, now sitting at 1.01 billion Eh/s — we’re officially entering Zettahash territory!
Here’s a quick breakdown of the common hash rate units used throughout Bitcoin’s 16-year history:
Kilohash per second (Kh/s): 1,000 hashes per second
Megahash per second (Mh/s): 1 million hashes per second
Gigahash per second (Gh/s): 1 billion hashes per second
Terahash per second (Th/s): 1 trillion hashes per second
Petahash per second (Ph/s): 1 quadrillion hashes per second
Exahash per second (Eh/s): 1 quintillion hashes per second
Zettahash per second (Zh/s): 1 sextillion hashes per second
AVG Mining Cost
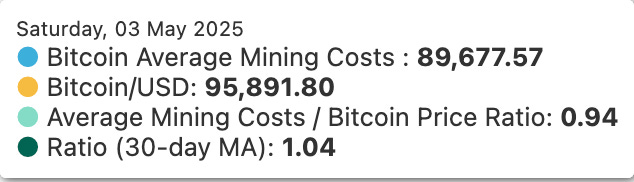
As of May 3, 2025, the average cost to mine one Bitcoin is roughly $90,000 USD — a slight increase from the last report.
Market Cap
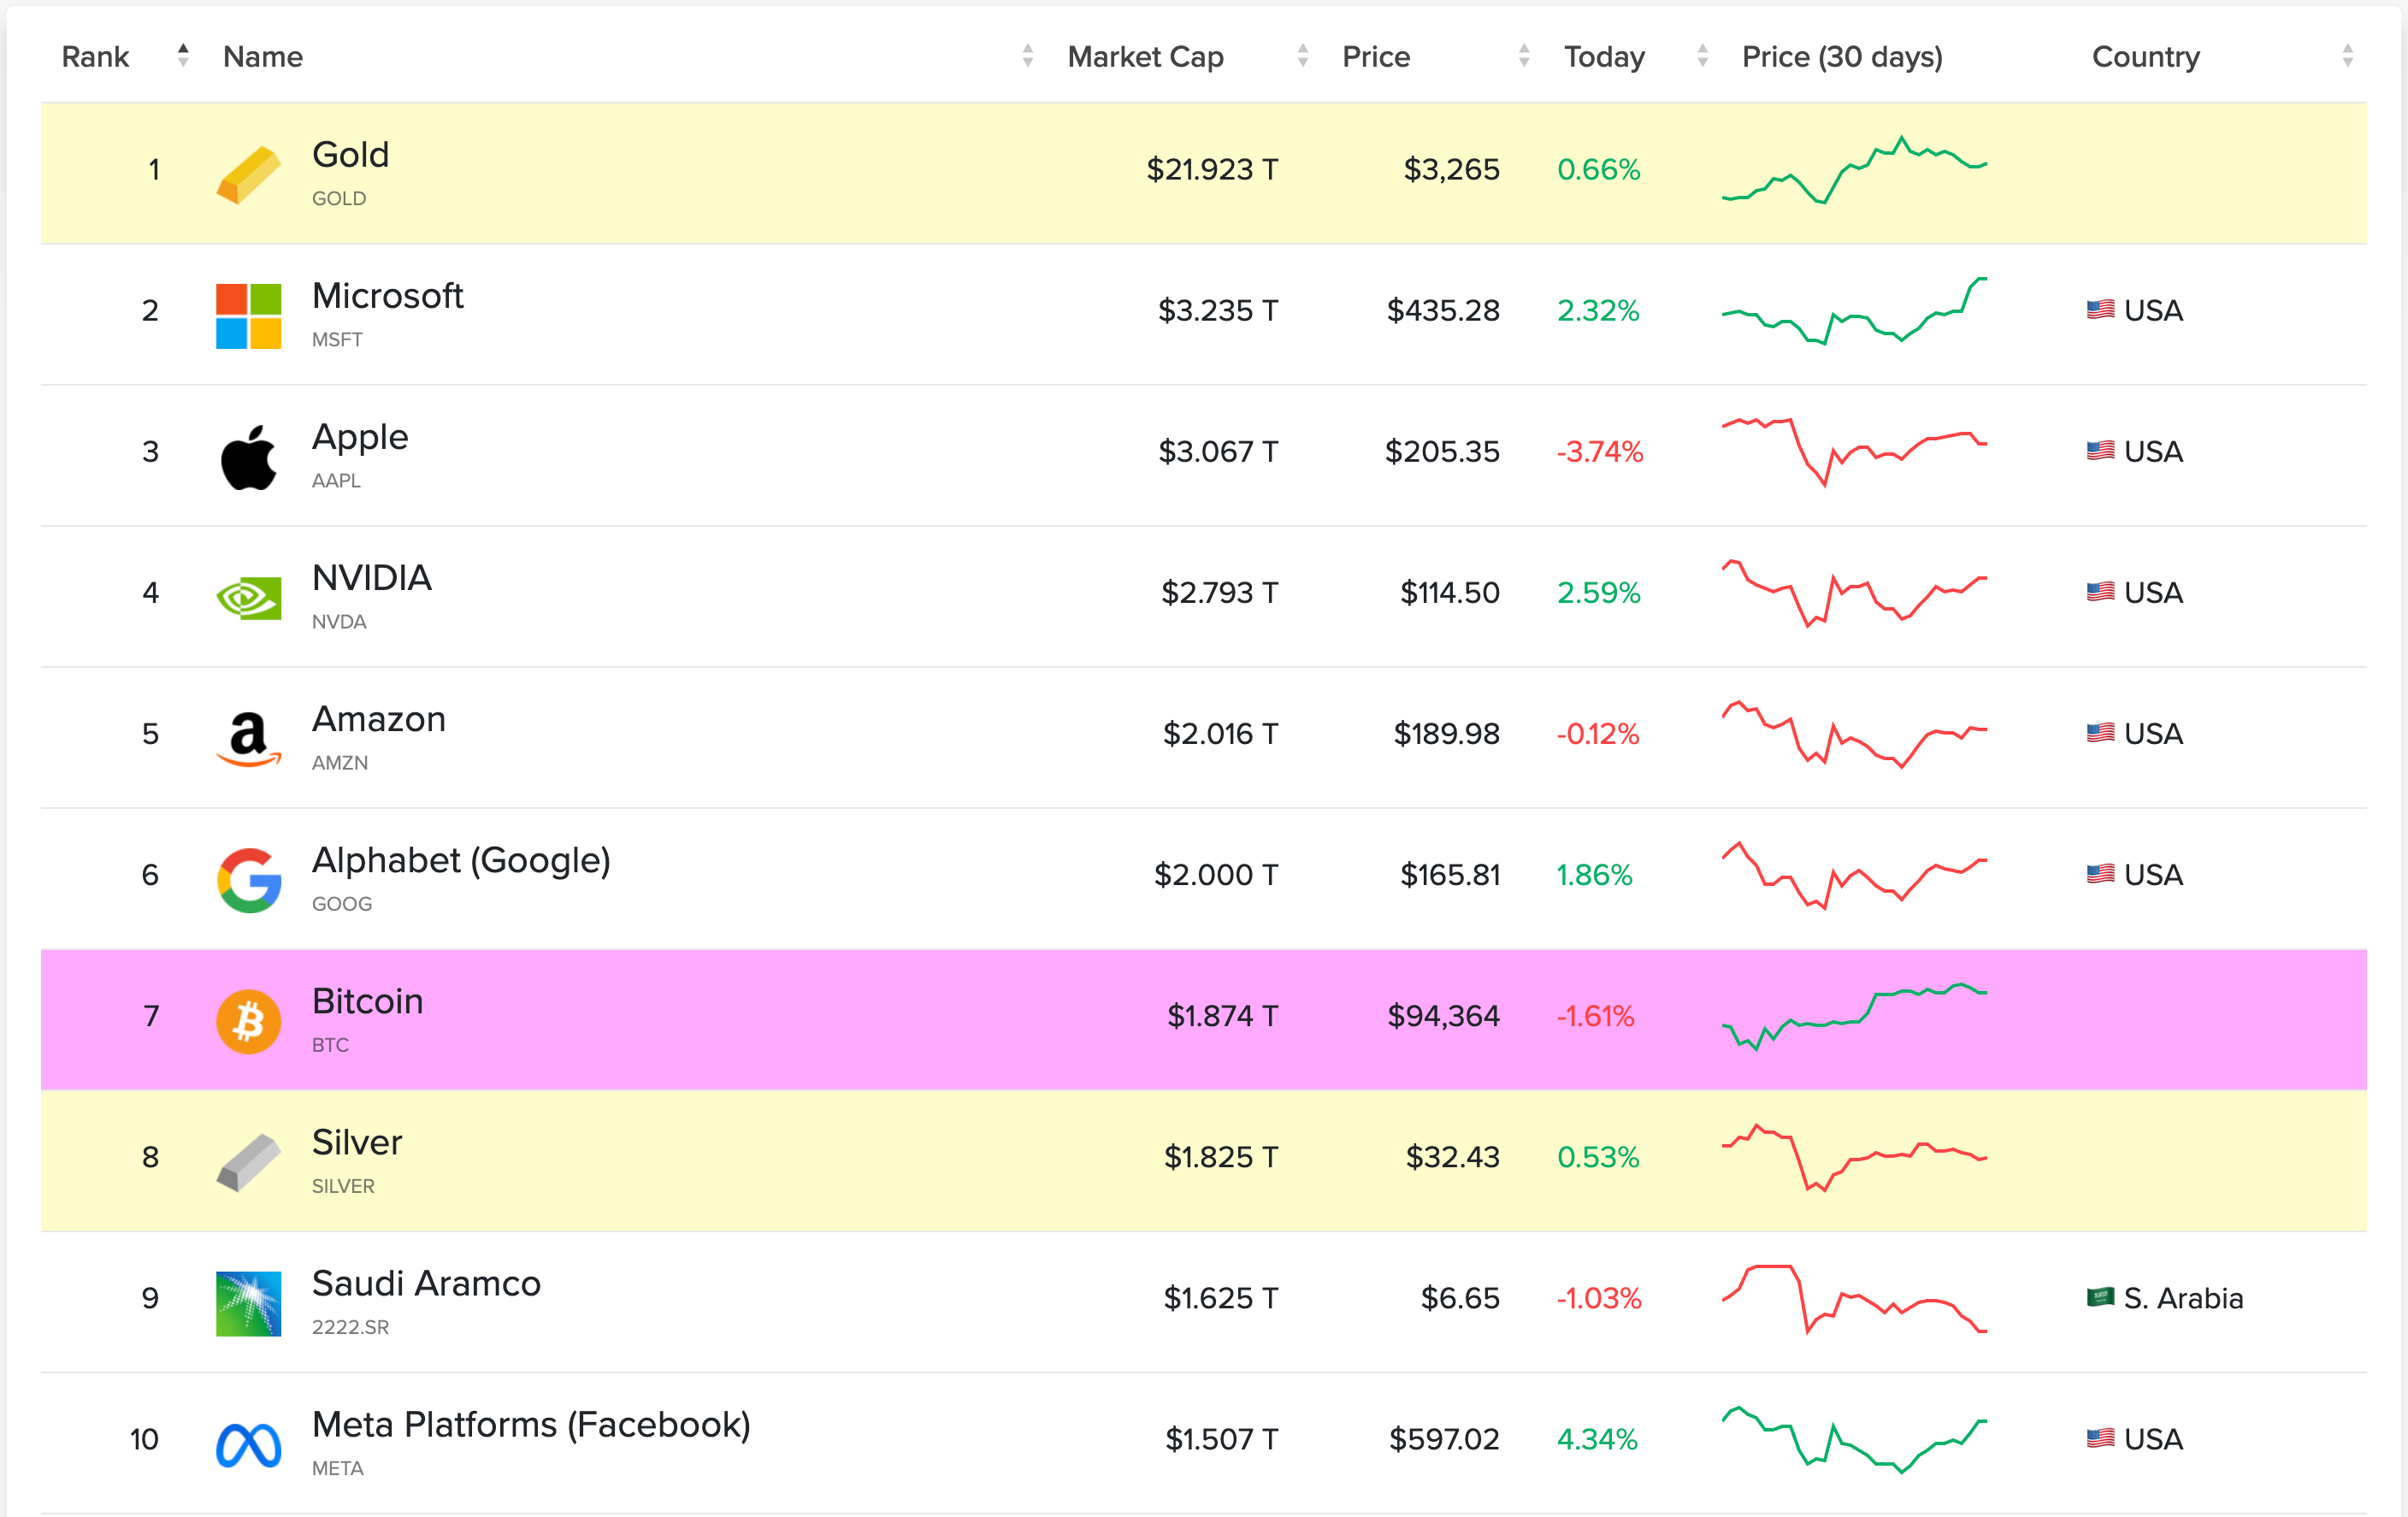
Bitcoin’s current market cap is $1.874 trillion, marking an increase of 14.27% over the past month.
Bitcoin News
Highlights from the months of April
Trump Signs Bill Blocking IRS Crypto Tax Rule Biden Pushed
El Salvador Says It’s Still Buying Bitcoin After IMF Accord
If you have any suggestions, feel free to reach out to me on X. I’m always looking to improve and add value in ways others might enjoy—just keep it Bitcoin only.
Live free and stack sats,
Will
“The world has to adapt to Bitcoin, not the other way around” - Herzmeister