

Around the Block | 20
Macro price action, on-chain data, and market structure. No noise.

May tested April’s reclaim and barely held. The monthly closed at $73,611 on a shooting-star rejection of the $82,814 overhead supply shelf. The weekly broke the $74,000 rectangle breakout level on a long-black continuation. The $73,000 polarity was defended by $611 only. The structural framework from The Block Report #17 is preserved on the close, weakened in character, and now pushed to June for resolution.
None of this is financial advice.
Don’t trust, verify.
Let’s dive in.
TL;DR — KEY TAKEAWAYS
Monthly structure: May closed at $73,611 (-3.55%) on a shooting-star-character candle that rejected the $82,814 overhead supply shelf. The April reclaim is preserved by $611 above the $73,000 polarity but materially weaker in character. The Nison evening-star ingredients are in place pending June for the confirming bar.
Weekly structure: Weekly closed -4.43% at $73,611 on a long-black candle that voided The Block Report #19’s twice-defended hammer thesis and broke the $74,000 rectangle breakout level by $389. Failed-hammer continuation signal active; the monthly polarity at $73,000 is the last weekly line of defense before the $65K–$67K base re-opens.
Hashrate: 980 EH/s on a +10.11% weekly recovery off a deeper drawdown that occurred between #17 and now. The lower-highs structure from the 1,240 EH/s late-2024 peak is intact; the bounce is difficulty-adjustment-driven, not price-driven. Proof-of-work moat intact, mining environment not yet normalized.
Mining cost vs. price: Cost-to-price ratio widened from 1.04 (#17) to 1.17, the largest single-period deterioration of the corrective phase. Industry-average production cost now exceeds spot by 17%. Structurally unprofitable on a current basis, not just marginal.
Market cap and rank: Bitcoin ceded three ranks since #17, falling from #11 to #14 at $1.470 trillion. Tesla, Meta, and Samsung passed above. The gap to Saudi Aramco at #10 widened from $195 billion to $305 billion. The “earned, not inherited” rank from prior issues was not held.
Primary scenario: The $73,000 monthly polarity is the decision line. A June monthly close beneath $73,000 invalidates the April reclaim and re-opens the $58K–$65K base for a deeper retest. A June close above $76,318 reclaims April’s body close and preserves the higher-low structure with the 8 EMA at ~$80K as the next overhead trigger.
The Technicals
Monthly

The May monthly closed bearish at $73,611.04 (-3.55%) on a textbook shooting-star-character candle at the overhead supply shelf. Here’s the read.
OHLC Data
Open: $76,315.67
High: $82,814.03
Low: $72,402.13
Close: $73,611.04 (-3.55%)
Volume: 300.69K
Key Levels
$118K-$124K: Cycle peak / distribution origin
$104K-$112K: Broken weekly demand turned supply; the monthly purple S/R cluster
$82K-$83K: Supply shelf where May’s upper shadow rejected
$76,318: April’s close; first overhead reclaim reference
$73,000: Polarity line; defended on the May close by $611
$58,000-$73,000: Major monthly support block (the 2024 consolidation base, retest zone)
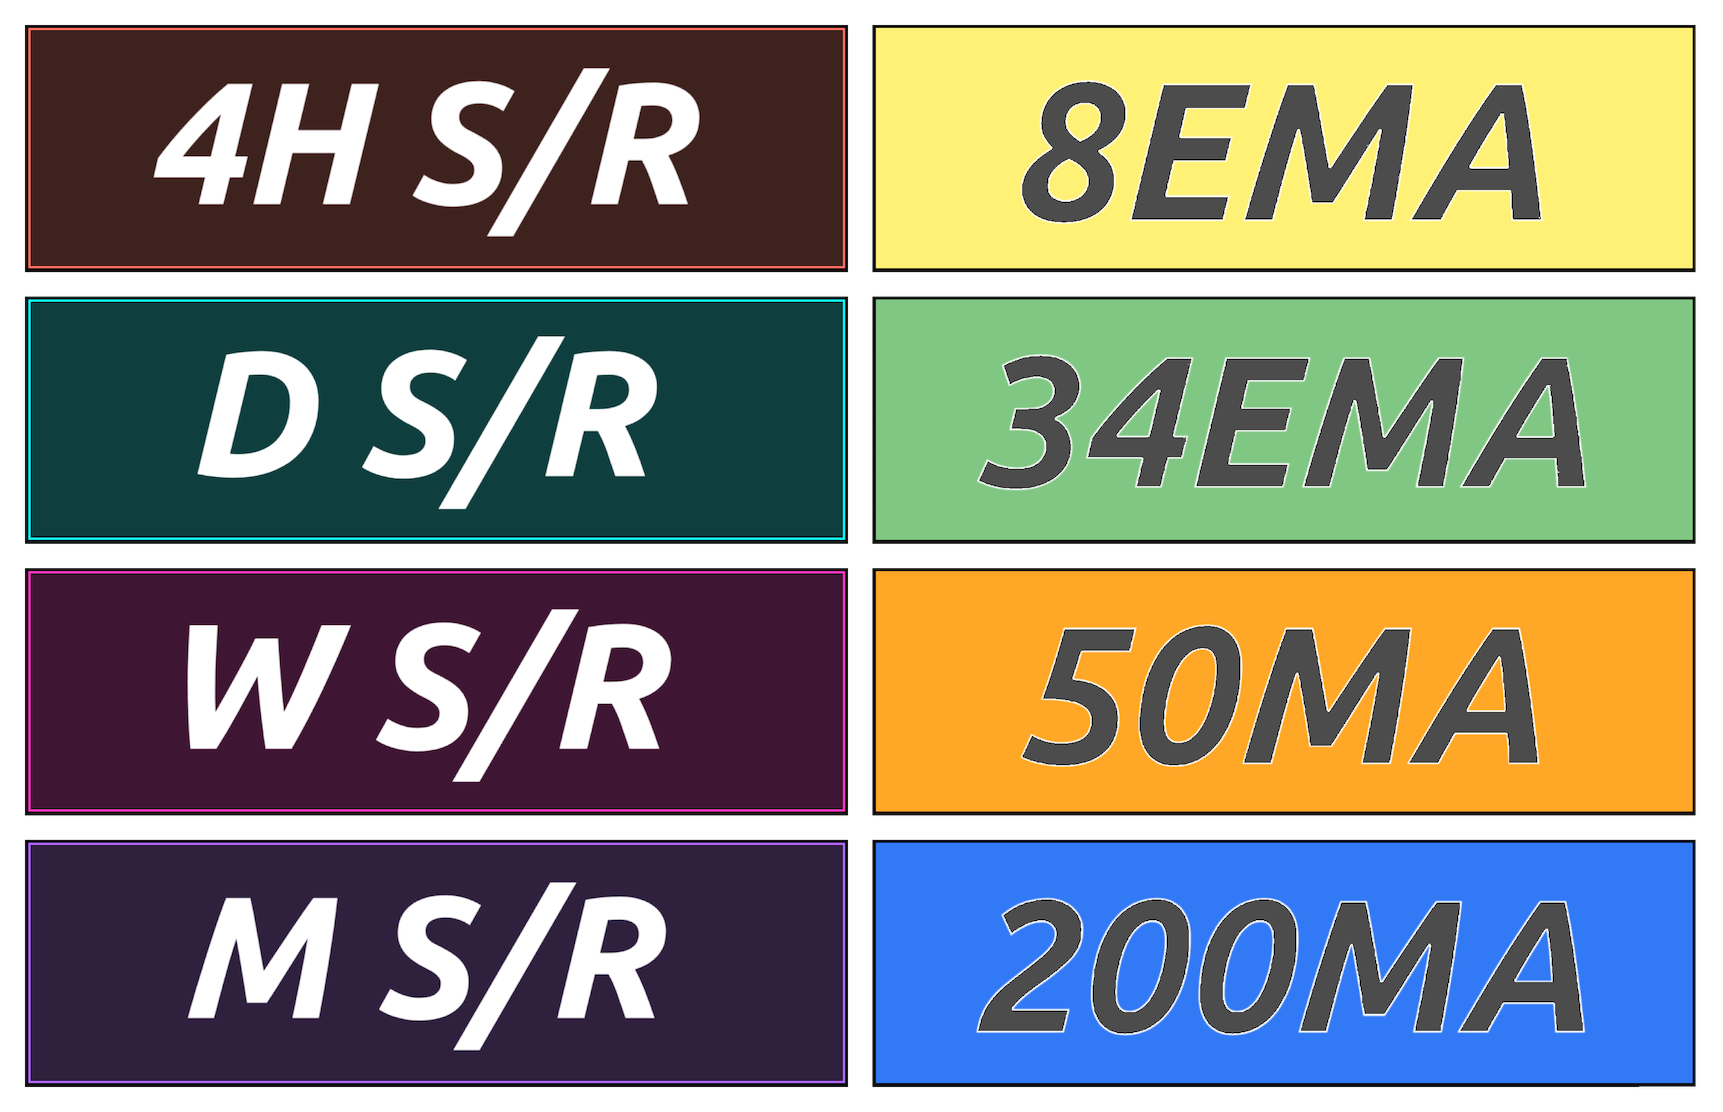
8 EMA ~$80,000: Declining; price beneath; first dynamic overhead
34 EMA ~$76,000: Flattening; immediate overhead now confirmed
50 MA ~$58,000: Rising; macro support intact
200 MA ~$40,000: Rising; macro bull cycle support floor
Structure
The monthly read from The Block Report #17 was that April’s $76,318 close confirmed a successful retest of the prior cycle base and ended the active markdown classification. May has put that read under direct pressure. Price pushed into the $82,814 overhead supply shelf, the same level that rejected the weekly 34 EMA, and was sold back to a $72,402 low that pierced the $73,000 polarity line intramonth. The close at $73,611 sits $611 above polarity and $2,707 below April’s close. Per Schabacker, a corrective phase that produces a counter-rally to broken supply followed by a rejection back into the prior consolidation range is the structural sequence of a test of the recovery’s validity. The April reclaim is intact on the close. It is not intact in character.
Candlestick Behavior
The May monthly candle is a textbook shooting-star-character bearish session. Open $76,315, close $73,611, real body $2,704 bearish, upper shadow $6,498, lower shadow $1,209. Body is 26% of total range. Upper shadow is 62% of range. Lower shadow 12%. Per Nison classical: small real body, upper shadow at least twice the body, minimal lower shadow, body sitting in the lower third of the range, appearing at overhead resistance after an uptrend. All five criteria met. The two-candle sequence reads as an April long white candle (per #17, body $8,092 bullish at 59% of range) followed by a May shooting star at higher level. That is the structural ingredient list for a potential evening-star reversal pattern, pending June for the confirming candle. Per Nison, the pattern is unconfirmed without a third bearish bar. The warning is real. The reversal is not yet validated.
Chart Patterns
The monthly structure remains a corrective phase with active basing inside the $58K–$73K support block. April’s reclaim established the first higher-low candidate. May’s rejection has not invalidated it but has not extended it either. Per Bulkowski, a base-pattern resolution requires sequential acceptance above the breakout level, and a return to the polarity line on the first counter-test is a documented post-reclaim retest behavior. The pattern is not invalidated unless a June monthly close prints beneath $73,000 returning price inside the prior consolidation range with conviction. The next pattern question is whether the developing structure registers as a complex higher-low above $73K or a failed reclaim back into the base.
Trend and Momentum
8 EMA (~$80,000): Declining from $82K; price beneath; first dynamic overhead resistance. 34 EMA (~$76,000): Flattening; close came in $2,389 beneath this average; the structural pivot. 50 MA (~$58,000): Rising; macro support floor intact. 200 MA (~$40,000): Rising; macro bull cycle support intact.
Trend state: Macro bullish with the 200 MA and 50 MA rising and well beneath price. Medium-term corrective with the 34 EMA confirmed as overhead and the close beneath it. Short-term bearish with the shooting-star character. Transitional alignment has weakened from the April reclaim read. The monthly is now testing whether April was the corrective low or the first leg of a more complex bottoming structure.
Volume
May volume at 300.69K is at the lower end of recent monthly readings and beneath the late-2024 expansion volume that defined the prior bull leg. The bearish rejection executed without expansionary participation. Per Dow Theory, a corrective decline that lacks climactic volume is structurally a caveat in either direction. Not a panic-driven breakdown. Not the kind of distribution print that would definitively void the April reclaim. The volume signature reads as orderly digestion at overhead, not the volume profile of a top.
Psychological and Probabilistic Context
Sentiment has rotated from corrective-low confidence back to defensive skepticism. The April reclaim narrative documented in #17 was the cleanest structural read since the cycle peak. May’s shooting-star rejection forces a recalibration. April optimists who bought the reclaim are facing month-end drawdown. The disbelief narrative re-establishes itself at the $73K polarity line. Per Nison, indecision following a long white candle at higher level is the standard psychological setup for the early stages of a meaningful top, but it is also the standard setup for digestion before continuation. June is the operative month that resolves the ambiguity.
Monthly Outlook
Primary: June closes in the $70K–$78K zone with $73,000 as the decision line; the corrective phase extends sideways with the April reclaim under pressure but not voided.
Stabilization: June close above $76,318 reclaims April’s body close and preserves the higher-low structure; subsequent months consolidate in the $73K–$85K zone testing the declining 8 EMA at ~$80K.
Structural Repair: June closes and holds above the 8 EMA at ~$80K reclaiming declining momentum; opens the $104K–$112K monthly S/R as the next macro overhead test and confirms the April reclaim as the corrective low.
Final Assessment
The monthly trend remains macro bullish in cycle structure with the corrective phase showing renewed pressure on the April reclaim. May closed at $73,611, $611 above the $73,000 polarity line and $2,389 beneath the 34 EMA. The shooting-star-character candle at overhead resistance is a Nison warning, not a confirmed reversal. The structural read from #17 (corrective low is in) is preserved on the close but is materially weaker than it was four weeks ago.
What confirms continuation: a June monthly close above $76,318 reclaiming April’s body close, with the 8 EMA at ~$80K as the next overhead trigger.
What signals a change: a June monthly close beneath $73,000 invalidates the April reclaim, returns price inside the prior consolidation range, and re-opens the $58K–$65K base for a deeper retest.
Prior Journal Reference
In The Block Report #17 (May 4, 2026), I defined the monthly Primary scenario as: “May closes above $73,500 preserving the reclaim and higher-low structure; subsequent months consolidate in the $73K–$85K zone.” May closed at $73,611, $111 above the $73,500 threshold and within the projected zone. The Primary scenario is technically intact but operating at the lower boundary of its range. The #17 Stabilization criterion required a monthly close above $85K. That did not occur. The #17 “What signals a change” required a May monthly close back beneath $73,000. That did not occur, but the wick to $72,402 came within $598 of triggering intramonth invalidation. The structural framework from #17 is preserved but materially weaker, and the decision has been pushed to June.
Weekly

The weekly closed -4.43% at $73,611.04 on a long-black candle that voided ATB 19’s hammer defense and broke the rectangle breakout level at $74,000. Here’s the read.
OHLC Data
Open: $77,022.64
High: $78,034.13
Low: $72,402.13
Close: $73,611.04 (-4.43%)
Volume: 69.66K
Key Levels
$116K-$124K: Cycle peak / distribution origin
$103K-$108K: Broken weekly demand turned supply; 3M/6M/12M S/R cluster
$90K-$94K: Weekly S/R; first major structural overhead
$74,000: Rectangle breakout level; technically voided on this week’s close
$73,000: Monthly polarity line; defended on the close by $611 only
$72,402: This week’s low; first downside reference printed intramonth
$60K-$66K: 3M/6M/12M S/R cluster; the structural floor
8 EMA ~$77,000: Declining; price beneath; the line that rejected this week’s open
34 EMA ~$80,500: Declining; immediate medium-term overhead
50 MA ~$94,000: Declining; aligned with $89K-$94K supply
200 MA ~$61,500: Rising; macro support floor intact
Structure
Weekly structure has converted from twice-defended polarity (#19) to weekly markdown re-engagement. The four-bar sequence from #19 has now extended to five: rectangle breakout to $78,670, hammer at $74,931, expansion to $82,179, hammer at $74,156, long-black candle through $74,000 with close at $73,611. Per Schabacker, a long-black candle that closes beneath the prior hammer’s low and beneath the rectangle breakout level is the textbook failed-hammer continuation signal. The hammer thesis required follow-through within 1 to 2 bars. This is bar two and the follow-through went the opposite direction. The transitional read from #19 has been invalidated at the weekly frame. What remains structurally intact is the monthly polarity at $73,000, defended on the close by $611.
Candlestick Behavior
The current weekly candle is a long-black bearish candle: open $77,022, close $73,611, real body $3,411 bearish, upper shadow $1,011, lower shadow $1,208. Body comprises 60.6% of total range. Shadows are proportional and modest on both ends. Per Nison, this is conviction-character bearish: a wide-bodied directional candle where sellers controlled the entire range from open to close with no meaningful buy-side defense at either extreme. The two-candle sequence reads as a failed hammer pattern. The prior week’s hammer at $74,156 was the test. This week’s long-black close beneath the hammer’s low is the failure. Per Nison, two-candle hammer-failure sequences at structural support carry continuation probability roughly equal to successful hammer defenses, just in the opposite direction. The character is decisive, not indecision.
Chart Patterns
The $65K–$74K rectangle breakout from #16 is now structurally voided on the weekly close. Per Bulkowski, a failed rectangle breakout that closes back inside the prior consolidation range carries a documented probability of mean-reversion to the opposite boundary of the rectangle, projecting toward $65K–$67K as the high-probability test zone. The $60K–$64K cluster sits beneath as the structural floor. The pattern has not reverted to clean markdown continuation yet because the close at $73,611 sits just $389 beneath the breakout level and is not yet a confirmed sustained break. A second weekly close beneath $74,000 with body extension would resolve the ambiguity. A reclaim back above $74,000 next week would qualify this week as a false breakdown.
Trend and Momentum
8 EMA (~$77,000): Declining; was reclaimed at last week’s hammer close, now broken with conviction. 34 EMA (~$80,500): Declining; the line that rejected the measured-move target in #18; remains overhead. 50 MA (~$94,000): Declining steeply; aligned with the $89K–$94K supply cluster. 200 MA (~$61,500): Rising; macro trend support intact.
Trend state: Short-term bearish with the 8 EMA failed as dynamic support. Medium-term bearish with the 34 EMA confirmed as overhead. Macro bullish with the 200 MA rising and well beneath price. The transitional alignment from #19 has broken. The weekly is now in early markdown re-engagement pending confirmation.
Volume
Weekly volume at 69.66K is slightly higher than last week’s 66.49K reading but remains beneath the April 26 breakout candle and well beneath the February 2026 capitulation spike. The breakdown executed without expansionary participation. Per Dow Theory, a breakdown that lacks climactic volume is a structural caveat: it argues against panic-driven distribution but also lacks the volume profile of confirmed institutional selling. The volume environment is moderate. A volume-expansion bar on a second close beneath $74,000 would convert this read from failed hammer to confirmed weekly markdown.
Psychological and Probabilistic Context
Sentiment has rotated from defended conviction (#19) to active doubt. The deep wick to $72,402 retested fear, and the close at $73,611 did not absorb it. Position holders who bought the May 3 hammer at $74,931 and the May 24 hammer at $74,156 are now sitting on broken support beneath their entries. Per Nison, two failed defensive prints at the same structural level followed by a long-black continuation candle is the psychological setup for cohort capitulation. The buyer cohort that was defined by the polarity defense is now defending nothing and faces decision pressure. The probability has shifted: the structural-repair scenario from #17 and #18 is now contingent on the monthly polarity holding at $73,000, and a weekly close beneath that level would re-validate the markdown thesis in full.
Weekly Outlook
Primary: Weekly digests in the $70K–$76K zone over the next 1 to 2 weeks with the $73,000 monthly polarity as the decision line; a second weekly close beneath $74,000 confirms the failed hammer continuation and opens $65K–$67K as the measured-move target.
Stabilization: Weekly close back above $74,000 with body extension reclaims the rectangle breakout level; converts this week’s print into a false breakdown and re-opens the BB middle band at ~$78K as the next overhead test.
Structural Repair: Weekly closes and holds above the 34 EMA at ~$80,500 with volume expansion; first credible reclaim of medium-term momentum and the trigger that would void the failed-hammer thesis. Opens the $89K–$94K weekly S/R cluster as the next test.
Final Assessment
The weekly trend has shifted from twice-defended transitional repair to weekly markdown re-engagement. The long-black candle closed at $73,611, $389 beneath the rectangle breakout level at $74,000 and $611 above the monthly polarity at $73,000. Both the May 3 hammer at $74,931 and the May 24 hammer at $74,156 are now structurally voided on this weekly close. The hammer-defense thesis from #19 has been invalidated. The monthly polarity at $73,000 is the last structural line of defense before the $65K–$67K base re-opens.
What confirms continuation (downside): a second weekly close beneath $74,000, especially one beneath $73,000 with body extension and volume expansion.
What signals a change (upside reclaim): a weekly close back above $74,000 reclaiming the rectangle breakout level and converting this week’s print into a false breakdown.
Prior Journal Reference
In The Block Report #19 (May 25, 2026), I defined “What signals a change” as: “a weekly close beneath $74,000 that voids both the May 3 hammer at $74,931 and this week’s hammer at $74,156.” The close at $73,611 satisfies that criterion exactly. The bear-scenario invalidation triggered. The structural framework from #19 must be downgraded from transitional repair re-validated to transitional repair invalidated; weekly markdown re-engagement pending confirmation. The framework was correctly conditional. The close was the deciding variable, and the close moved the read from re-validated continuation to failed defense. Structural continuity preserved.
The Fundamentals
Hashrate

Current reading: 980,000,000 TH/s (980 EH/s), up 90,000,000 TH/s (+10.11%) on the week.
The Block Report #17 characterized hashrate as early stress that had not normalized. The partial recovery off the 830 EH/s cycle low documented in #13 had stalled and reversed, with the weekly print at 890 EH/s sitting approximately 28% below the late-2024 all-time high near 1,240 EH/s. The proof-of-work moat was intact. The mining environment was not improving.
This week requires a partial update in the other direction, with one new data point that did not exist when #17 was published.
In the weeks following #17, hashrate did not stabilize at 890 EH/s. It declined further, producing a marginal new low in the 770 EH/s range before the current recovery. The +10.11% weekly print represents the sharpest single-week reversal off that low, stepping hashrate from the prior reading back to 980 EH/s and re-engaging the broader 2026 trading band. Current reading sits approximately 21% below the late-2024 all-time high, an improvement of seven percentage points from the #17 reference.
The Glassnode 1W series shows the relevant structural context. The macro uptrend from early 2023 through late 2024 brought hashrate from roughly 300 EH/s to the 1,240 EH/s peak. That peak was tested again in late 2025 and early 2026 without breaking out, establishing a documented range ceiling. The drawdown that produced the 770 EH/s lows did not break the macro trend. The trough sat well above the 2024 breakout zone, but it confirmed that the post-peak structure is in a basing pattern rather than a continuation. The current sequence reads: 1,240 EH/s peak, 1,100 EH/s lower high, 770 EH/s drawdown low, 890 EH/s, 980 EH/s. The lower-highs structure from the 1,240 peak is intact. The higher-lows structure off the recent drawdown is emerging.
The driver behind this week’s print matters. Bitcoin closed the May monthly at $73,611, down 3.55%, and the weekly broke beneath the $74K rectangle breakout level on a long-black candle. A +10% hashrate recovery in a week of acute price weakness is not a price-driven recovery. It is the proof-of-work mechanism doing exactly what it is designed to do: difficulty adjusts downward following a period of reduced hashrate, miner economics improve at the new difficulty target, and marginal hardware returns to production. The hashrate move is a structural response to the mining environment, not a leading indicator of price recovery.
That distinction informs the read.
The Riot Q1 disclosure context referenced in #17 (treasury liquidation at 2.6x quarterly production) carries forward as the structural backdrop. Miners are funding operations through treasury rather than current production. That dynamic is not resolved by a single week of hashrate recovery. It is a margin-pressure environment that requires sustained price stability above mining break-even to normalize. The current price environment is not delivering that stability.
Verdict: the early stress characterization from #13 and #17 is softened but not removed. The proof-of-work moat is intact. The difficulty-adjustment mechanism is functioning as designed. Hashrate has staged a meaningful single-week recovery off a deeper drawdown than was visible at the time of #17. The lower-highs sequence from the 1,240 EH/s peak has not been challenged, the post-peak structure remains in a basing range rather than a confirmed recovery, and one weekly print does not establish a trend. The structural framework is improving on the margin and requires sustained follow-through to convert from stress-softening to normalization-confirmed.
Avg Mining Cost
In The Block Report #17, recorded May 4, the average mining cost was $81,841 against a spot price of $78,436. The cost-to-price ratio was 1.04 and the 30-day MA ratio was 1.11. The verdict at that time was that miner economics had improved materially from the 1.20 ratio recorded one month earlier, but the environment remained structurally marginal rather than structurally healthy. The condition for normalization was a sustained hold above $82K–$84K, the current average cost plus margin.
That condition was not met.
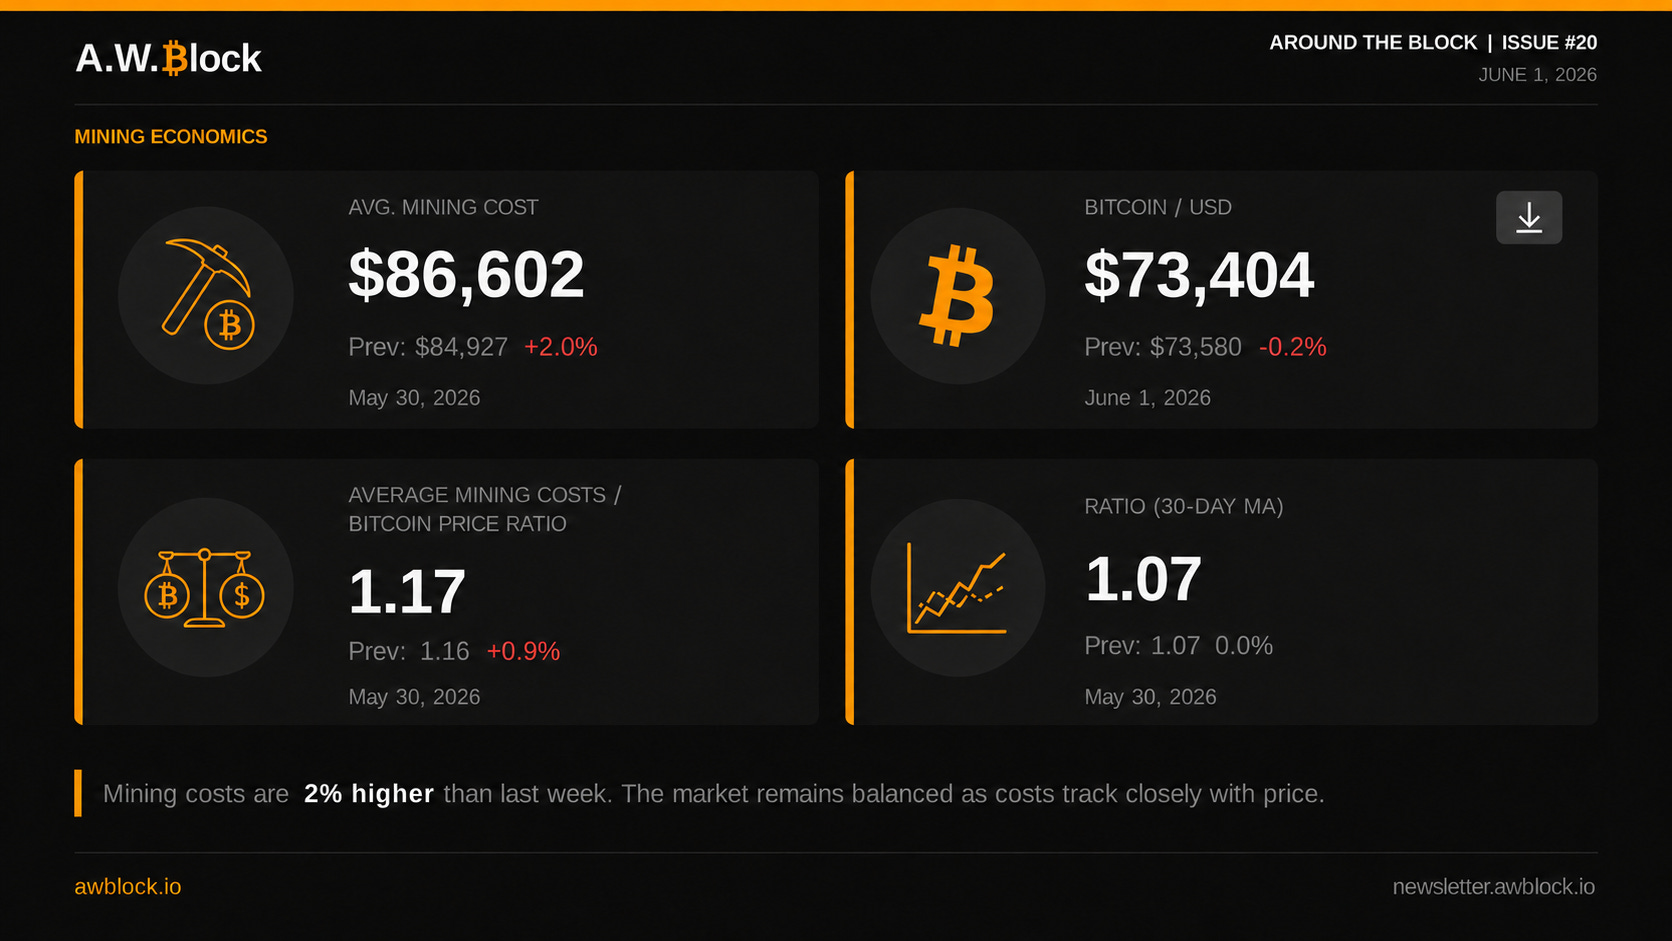
As of June 1, 2026, the average mining cost is $86,602, up $4,761 from the prior monthly reference (+5.8%). Spot price sits at $73,404, down $5,032 from the prior reference (-6.4%). The cost-to-price ratio has widened to 1.17. The 30-day MA ratio sits at 1.07.
The deterioration is driven on both sides. Cost rose 5.8% over four weeks while spot fell 6.4%. The combined effect is a 13-percentage-point widening of the spot cost-to-price ratio, from 1.04 to 1.17. That is the largest single-period ratio deterioration since the corrective phase began, and it materially reverses the compression sequence flagged in #17.
Week-over-week, the cost trajectory is accelerating. The current $86,602 cost is up 2.0% from the prior week’s $84,927, the spot price is down 0.2%, and the spot ratio has widened from 1.16 to 1.17. A 2% weekly cost increase against a flat-to-falling price environment is unusual and bears noting. Industry-average mining cost is composed of energy costs, hardware depreciation, fleet efficiency, and difficulty. Hashrate recovered roughly 10% week-over-week to 980 EH/s. If that recovery sustains, the next difficulty adjustment will move higher, which puts additional cost pressure on the network. This week’s cost increase is consistent with that dynamic beginning to register.
The 30-day MA ratio at 1.07 has compressed from 1.11 at the time of #17, a 4-percentage-point improvement over the month. That compression is real but it reflects trailing-window lag. The 30-day MA still contains the May rally data when spot ran to $82,179 before rejecting at the weekly 34 EMA. The week-over-week 30-day MA reading is flat at 1.07, meaning the compression has stalled. As the May rally data rolls out of the trailing window and the recent breakdown data rolls in, the 30-day MA ratio will track higher, not lower, from this point.
The spot ratio at 1.17 means industry-average production cost now exceeds spot by 17%. The mining environment is structurally unprofitable on a current basis, not just structurally marginal. Higher-cost operators are losing money on every block. Mid-tier operators sit at or beneath break-even. Lower-cost industrial operators retain margin but have seen that margin compress sharply. The #17 read (”the distance between unprofitable and breakeven is now narrow”) has been replaced by widening distance in the wrong direction.
The Bitcoin price action is the proximate cause. May closed the monthly at $73,611 (-3.55%), the weekly broke beneath the $74K rectangle breakout level on a long-black candle, and the spot reference on this report at $73,404 sits beneath even the May monthly close. The $82K–$84K threshold flagged in #17 as the condition for sustained normalization was tested at $82,179 on the weekly, rejected at the 34 EMA, and unwound entirely. Miner economics tracked the price reversal.
The dashboard caption on this report reads “the market remains balanced as costs track closely with price.” That framing understates the structural picture. A 1.17 spot ratio is not balance. It is current-basis unprofitability with the 30-day MA understating the pressure because the rally window has not yet rolled off. The accurate read is that costs and price are tracking together in the wrong direction.
Miner economics have deteriorated materially since #17. The 1.04 spot ratio has widened to 1.17, the most significant single-period worsening of the corrective phase. The 30-day MA at 1.07 has stalled and will turn higher as the rally data exits the trailing window. The condition for normalization flagged in #17 was tested and failed, and the structural environment has resumed deterioration rather than continuing compression. A reclaim and sustained hold of $80K–$84K is the condition that would re-establish the compression trajectory. Failure to clear that level keeps the network in a margin-pressure regime that will compound as the trailing average catches up to current spot.
Top Assets by Market Cap
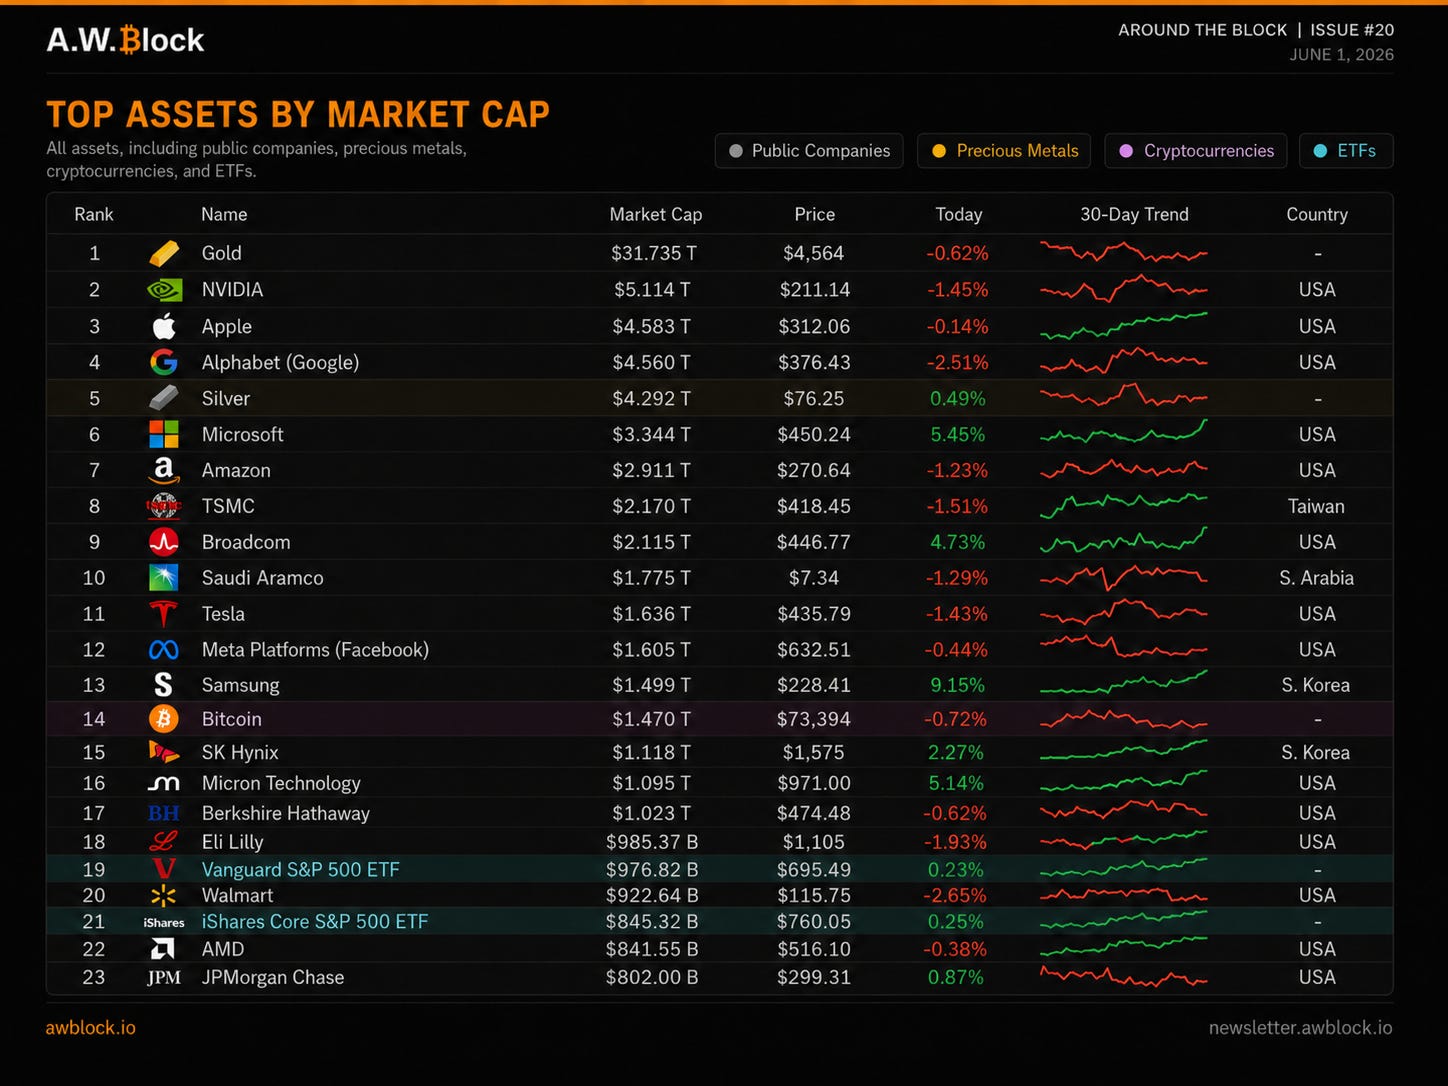
As of June 1, 2026, Bitcoin sits at rank #14 with a market cap of $1.470 trillion and a price of $73,394. The move from #12 to #11 documented across The Block Report #13 and #17 has reversed. Three assets have moved above Bitcoin in the four weeks since #17: Tesla at #11, Meta Platforms at #12, and Samsung at #13. The rank gap above has widened materially.
The market cap contraction is the structural story. #17 recorded Bitcoin’s market cap at $1.578 trillion at rank #11. The current reading of $1.470 trillion represents a roughly 6.8% contraction over that period, driven by the price reversal from the $82,179 weekly high through the $74,000 rectangle breakout level to the current $73,394 reading. Bitcoin has given back more than it gained in the prior reporting interval. The “earned, not inherited” rank framing from #13 and #17 has been tested. The rank was not held.
The cross-asset comparison on this snapshot reverses the pattern observed in the prior two issues. Gold sits at #1 with $31.735 trillion, down from $32.058 trillion in #17, a contraction of approximately $323 billion (-1.0%). Silver is at $4.292 trillion, slightly higher than the $4.271 trillion reading prior, but has fallen from rank #4 to rank #5 as Alphabet moved above. Today’s session reads Gold at -0.62%, Silver at +0.49%, and Bitcoin at -0.72%. That pattern is the inverse of what #13 and #17 documented: Bitcoin is underperforming both precious metals on the session, not outperforming them. The two-data-point behavioral pattern of Bitcoin outperformance over precious metals on observation dates has not repeated on this print. The series resets to one inconclusive data point and one contrary data point against the prior two.
The equity environment is mixed-to-negative with a clear semiconductor and AI-infrastructure rotation. Microsoft is the standout at +5.45%, with Broadcom +4.73%, Samsung +9.15%, Micron Technology +5.14%, and SK Hynix +2.27% all printing in the green. The rest of the tape is broadly red: NVIDIA -1.45%, Alphabet -2.51%, Amazon -1.23%, TSMC -1.51%, Tesla -1.43%, Meta -0.44%, Walmart -2.65%, Berkshire Hathaway -0.62%. Bitcoin at -0.72% sits on the weak side of the day’s distribution and shows no benefit from the semiconductor bid. The session is not risk-on in any clean sense. It is a rotation into specific names, and Bitcoin is not one of them.
The rank structure now requires re-framing. Bitcoin at #14 sits beneath Tesla at $1.636 trillion, Meta at $1.605 trillion, and Samsung at $1.499 trillion. The immediate reclaim target is Samsung at $29 billion above current Bitcoin market cap, a comparatively narrow gap. Above that, the gap widens: $135 billion to Meta, $166 billion to Tesla, and $305 billion to Saudi Aramco at #10. The #17 framing flagged the gap to #10 at $195 billion. That gap has widened by $110 billion in four weeks. The structural target of #10 has moved further away in absolute terms, not closer.
Behavioral note for the record: Bitcoin has ceded three ranks through the corrective sequence that began in early May. The rank loss was earned, not received. Tesla, Meta, and Samsung expanded market cap while Bitcoin contracted, and the relative-strength pattern that defined the prior two issues has reversed on this print. The rank #11 hold that #13 and #17 framed as a structurally significant marker has been broken cleanly to the downside. Whether the rank is recovered through a Bitcoin-specific leg higher or through a broad-market drawdown that contracts other assets faster will be determined by the next price sequence. The condition for the former remains a weekly close above the $94K weekly S/R cluster. The condition for the latter is exogenous and not predictable from the rank table itself.
Bitcoin News
Highlights from the month of May
Senate Confirms Bitcoin Friendly Kevin Warsh As Fed Chair Ahead of Clarity Act Vote
Iran Launches Bitcoin-Backed Insurance Service for Strait of Hormuz Shipping, Eyes $10B In Revenue
If you have any suggestions, feel free to reach out to me on X @WillSanchezJr. I’m always looking to improve and add value in ways others might enjoy — just keep it Bitcoin only.
Live free and stack sats,
Will
What Is A.W. Block?
A.W. Block is a digital asset estate investigation and advisory firm. We provide technical support for attorneys, probate administrators, and fiduciaries navigating Bitcoin and digital asset estates — asset identification, blockchain investigation, and court-ready documentation.
awblock.io
Found value? Share, subscribe, and/or send sats here: bc1qrlgzu0m94wdrsnxjg8qym7jtnudelgfypmjmaa