

Around the Block | 4
Stay informed with Bitcoin news, technical analysis, and fundamentals—all in one place.

Welcome to the fourth edition of Around the Block, your no-fluff Bitcoin newsletter.
Another month down, and Bitcoin continues to do what it does best—test conviction. Whether you're deep in the charts or just keeping an eye on the macro trend, this issue is packed with signal. As always, we're zooming out, ignoring the noise, and focusing on the key levels, moving averages, and data that actually matter. Bulls have made some noise, but is it sustainable? Let’s find out.
None of this is financial advice.
Don’t trust, verify.
Let’s dive in! 🚀
The Technicals
Monthly
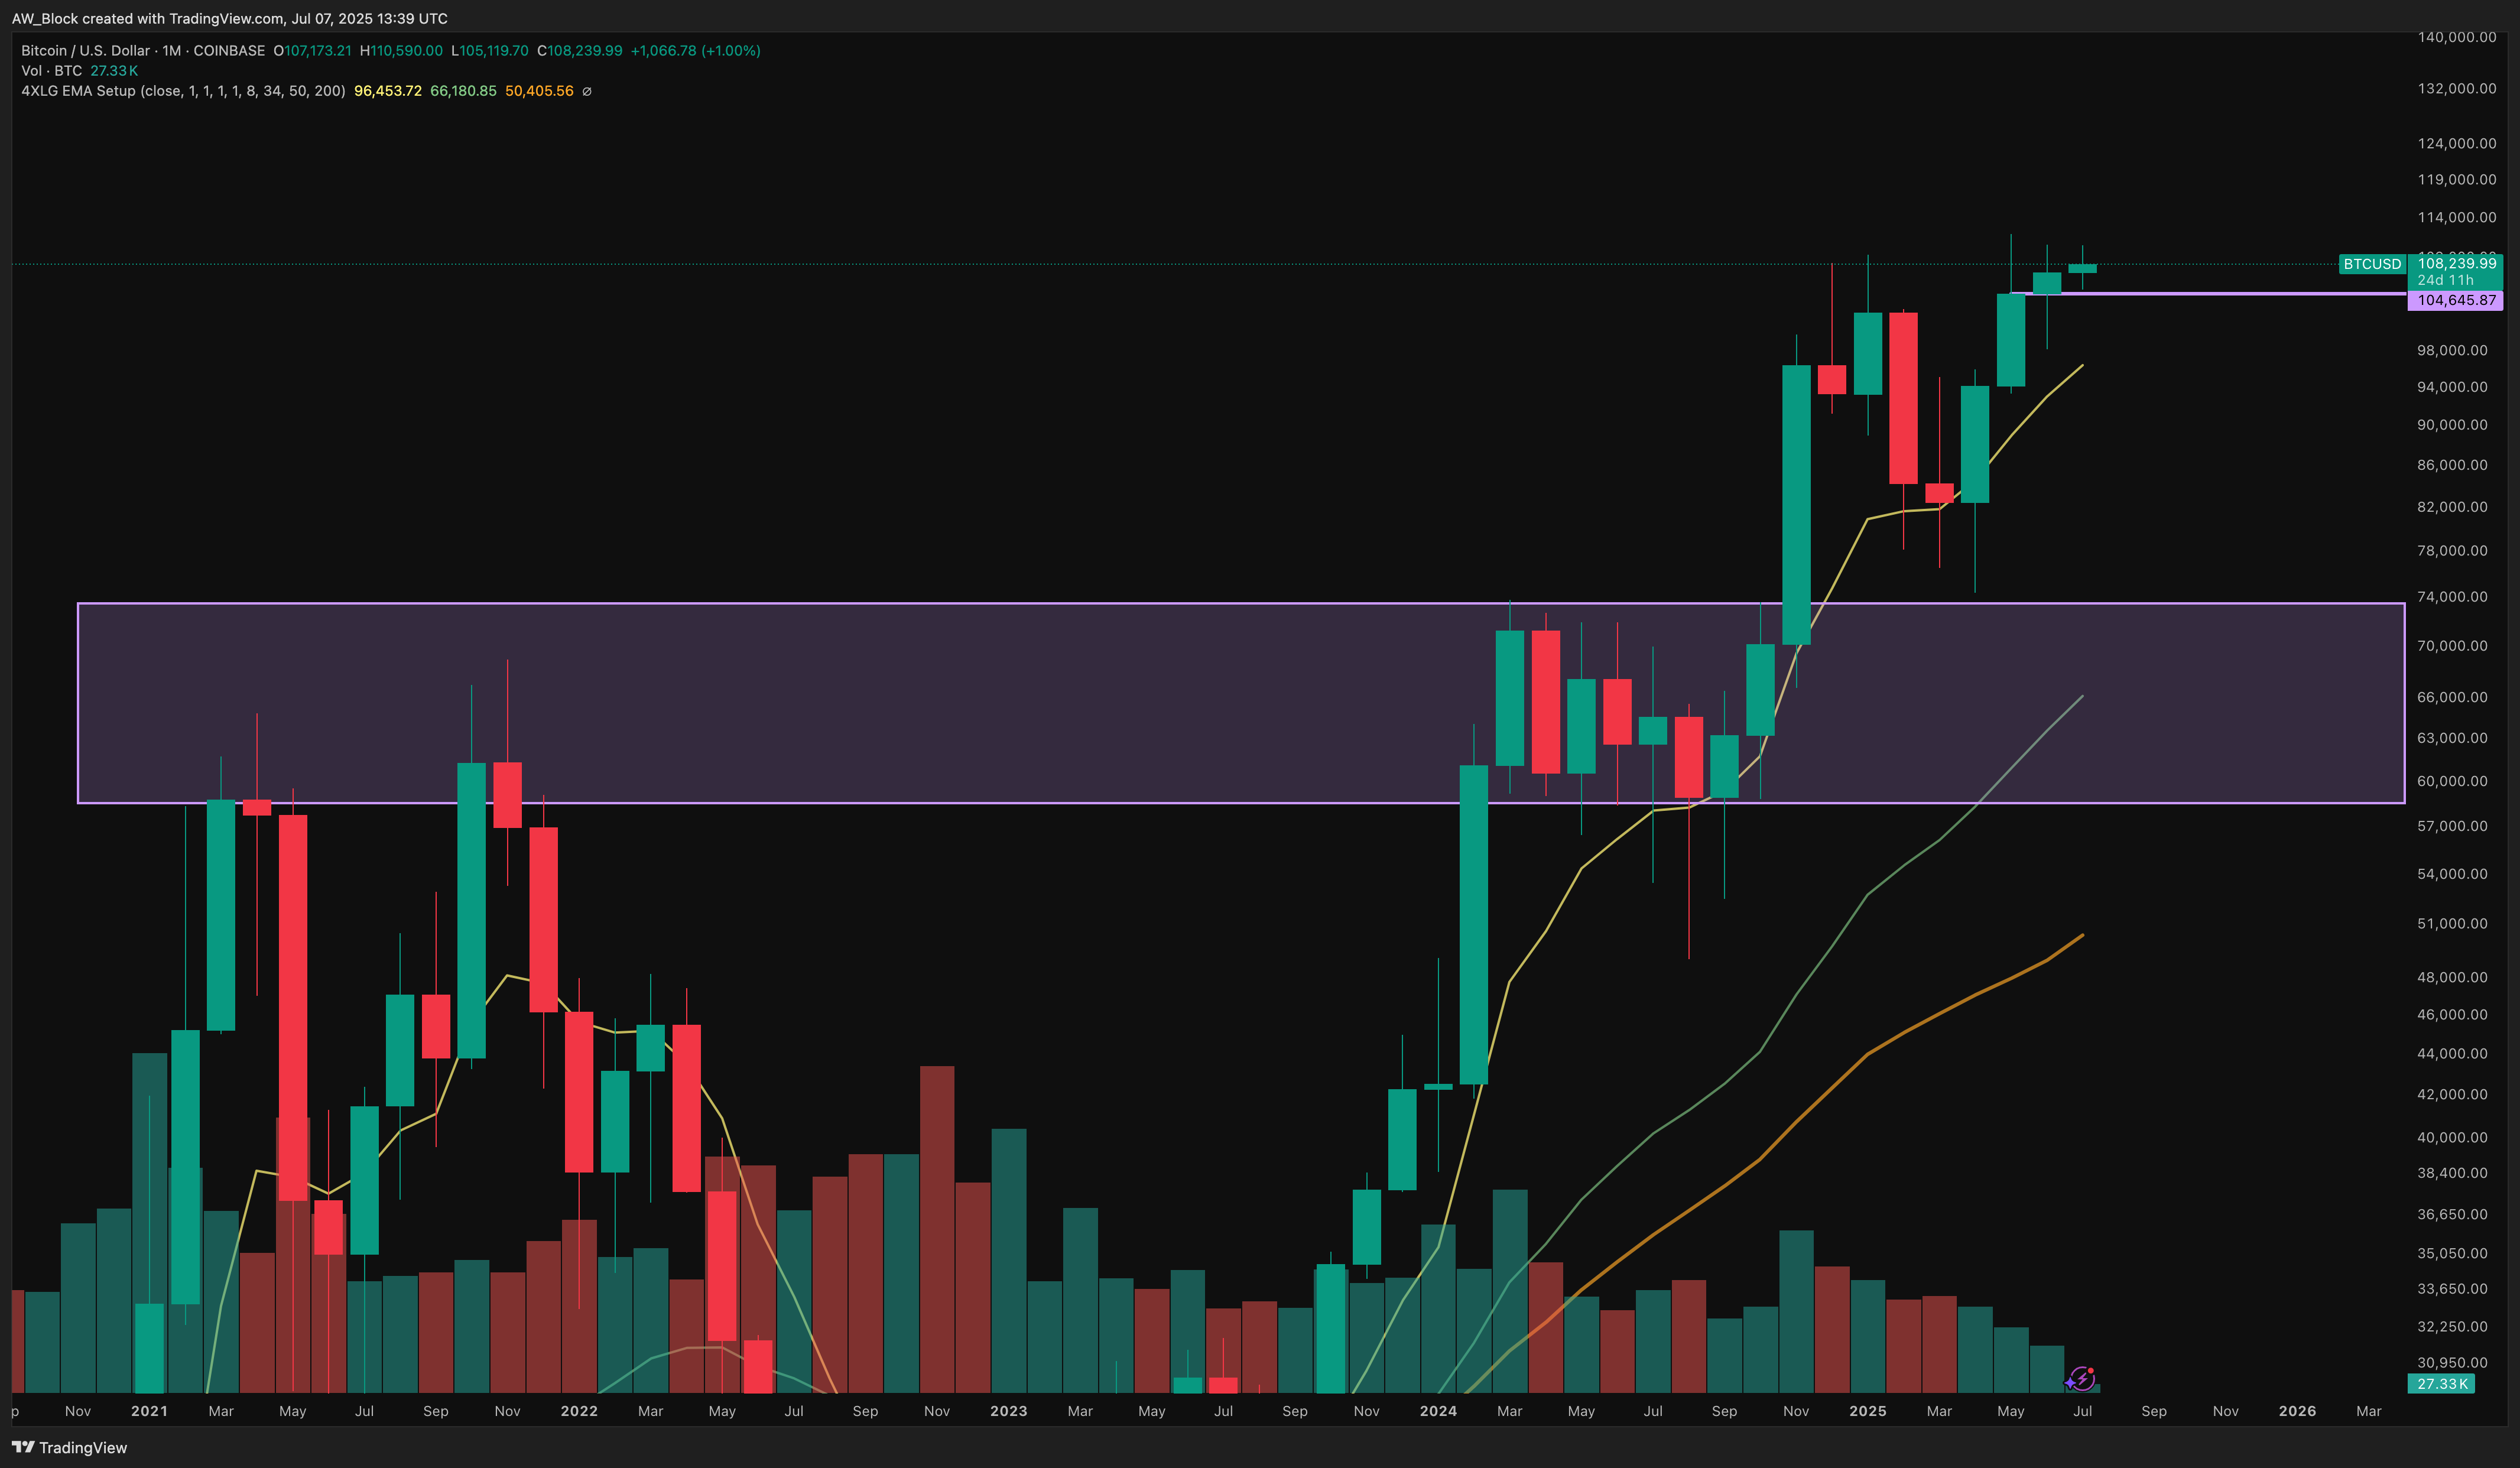
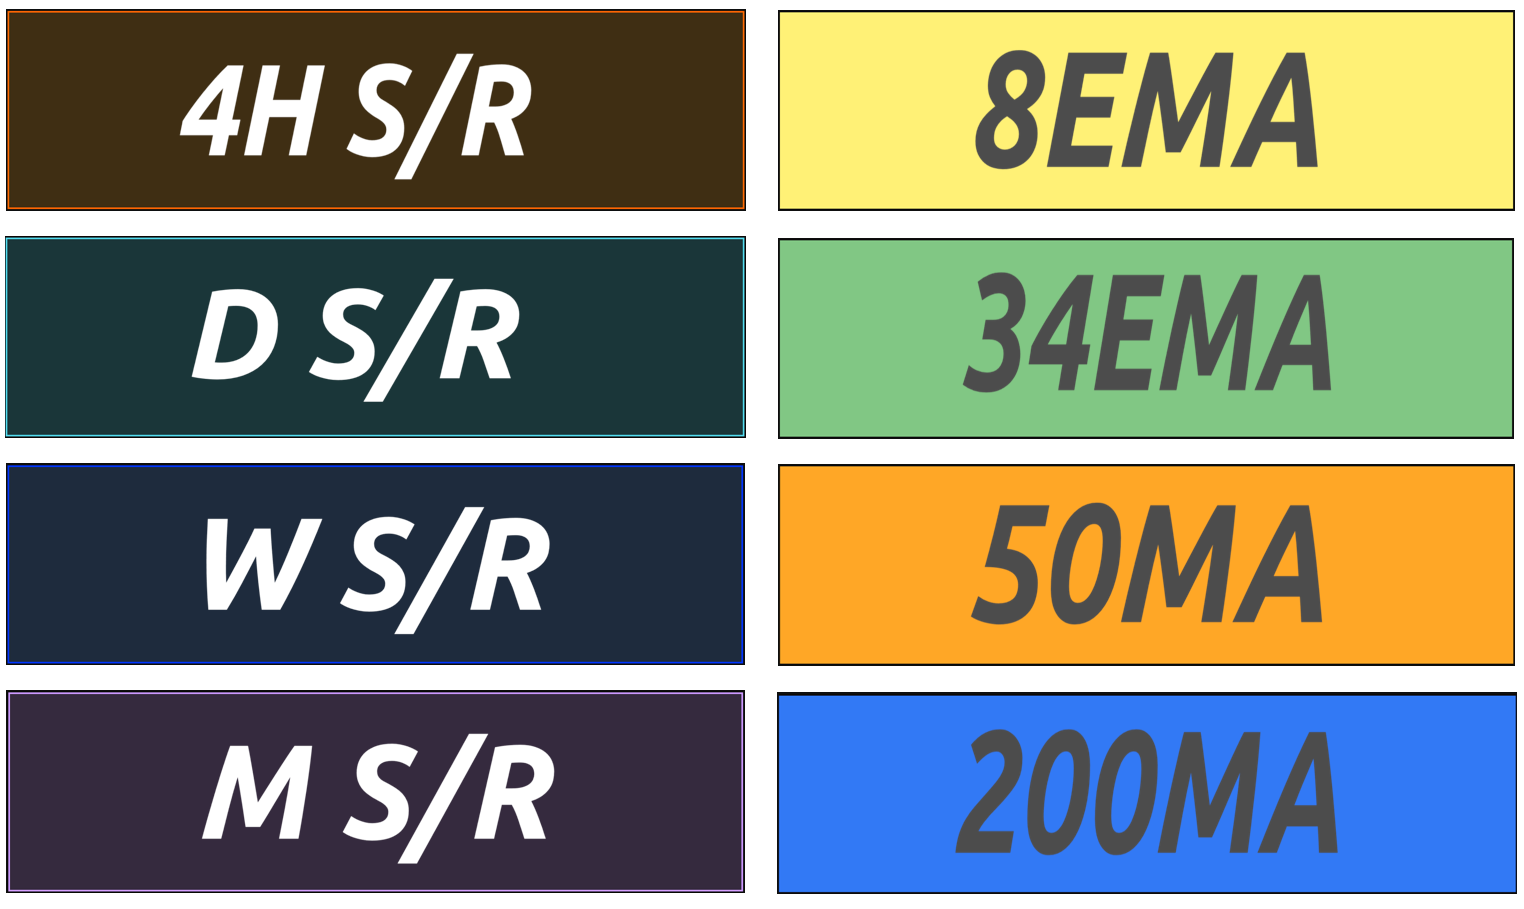
Another wild June highlight? Bitcoin traded above $100,000 USD for 45 straight days before dipping below that historic benchmark for a quick dip.
Increased chatter’s buzzing that the top’s in—price couldn’t hold above recent highs, so the bears are howling. I’m not buying it. Price is more likely ranging through the summer, taking a breather after the June rally. Zoom out to the monthly chart, and you see gradual higher closes, not the tight range you’d expect on weekly or daily timeframes. June’s candle? A spinning top—small body, balanced wicks—screaming indecision. It’s like Bitcoin’s shrugging, hinting at a reversal or just a pause to sip some coffee.
Next candle’s the decider: bearish could signal a reversal, while bullish points to consolidation. Remember that gem from the last newsletter: “Historically, bear market price action tends to emerge when monthly candles start closing below the 8EMA. As of now, we’re not there yet.”
You can learn more about spinning tops (and other patterns) here from Bullkowski.
Weekly
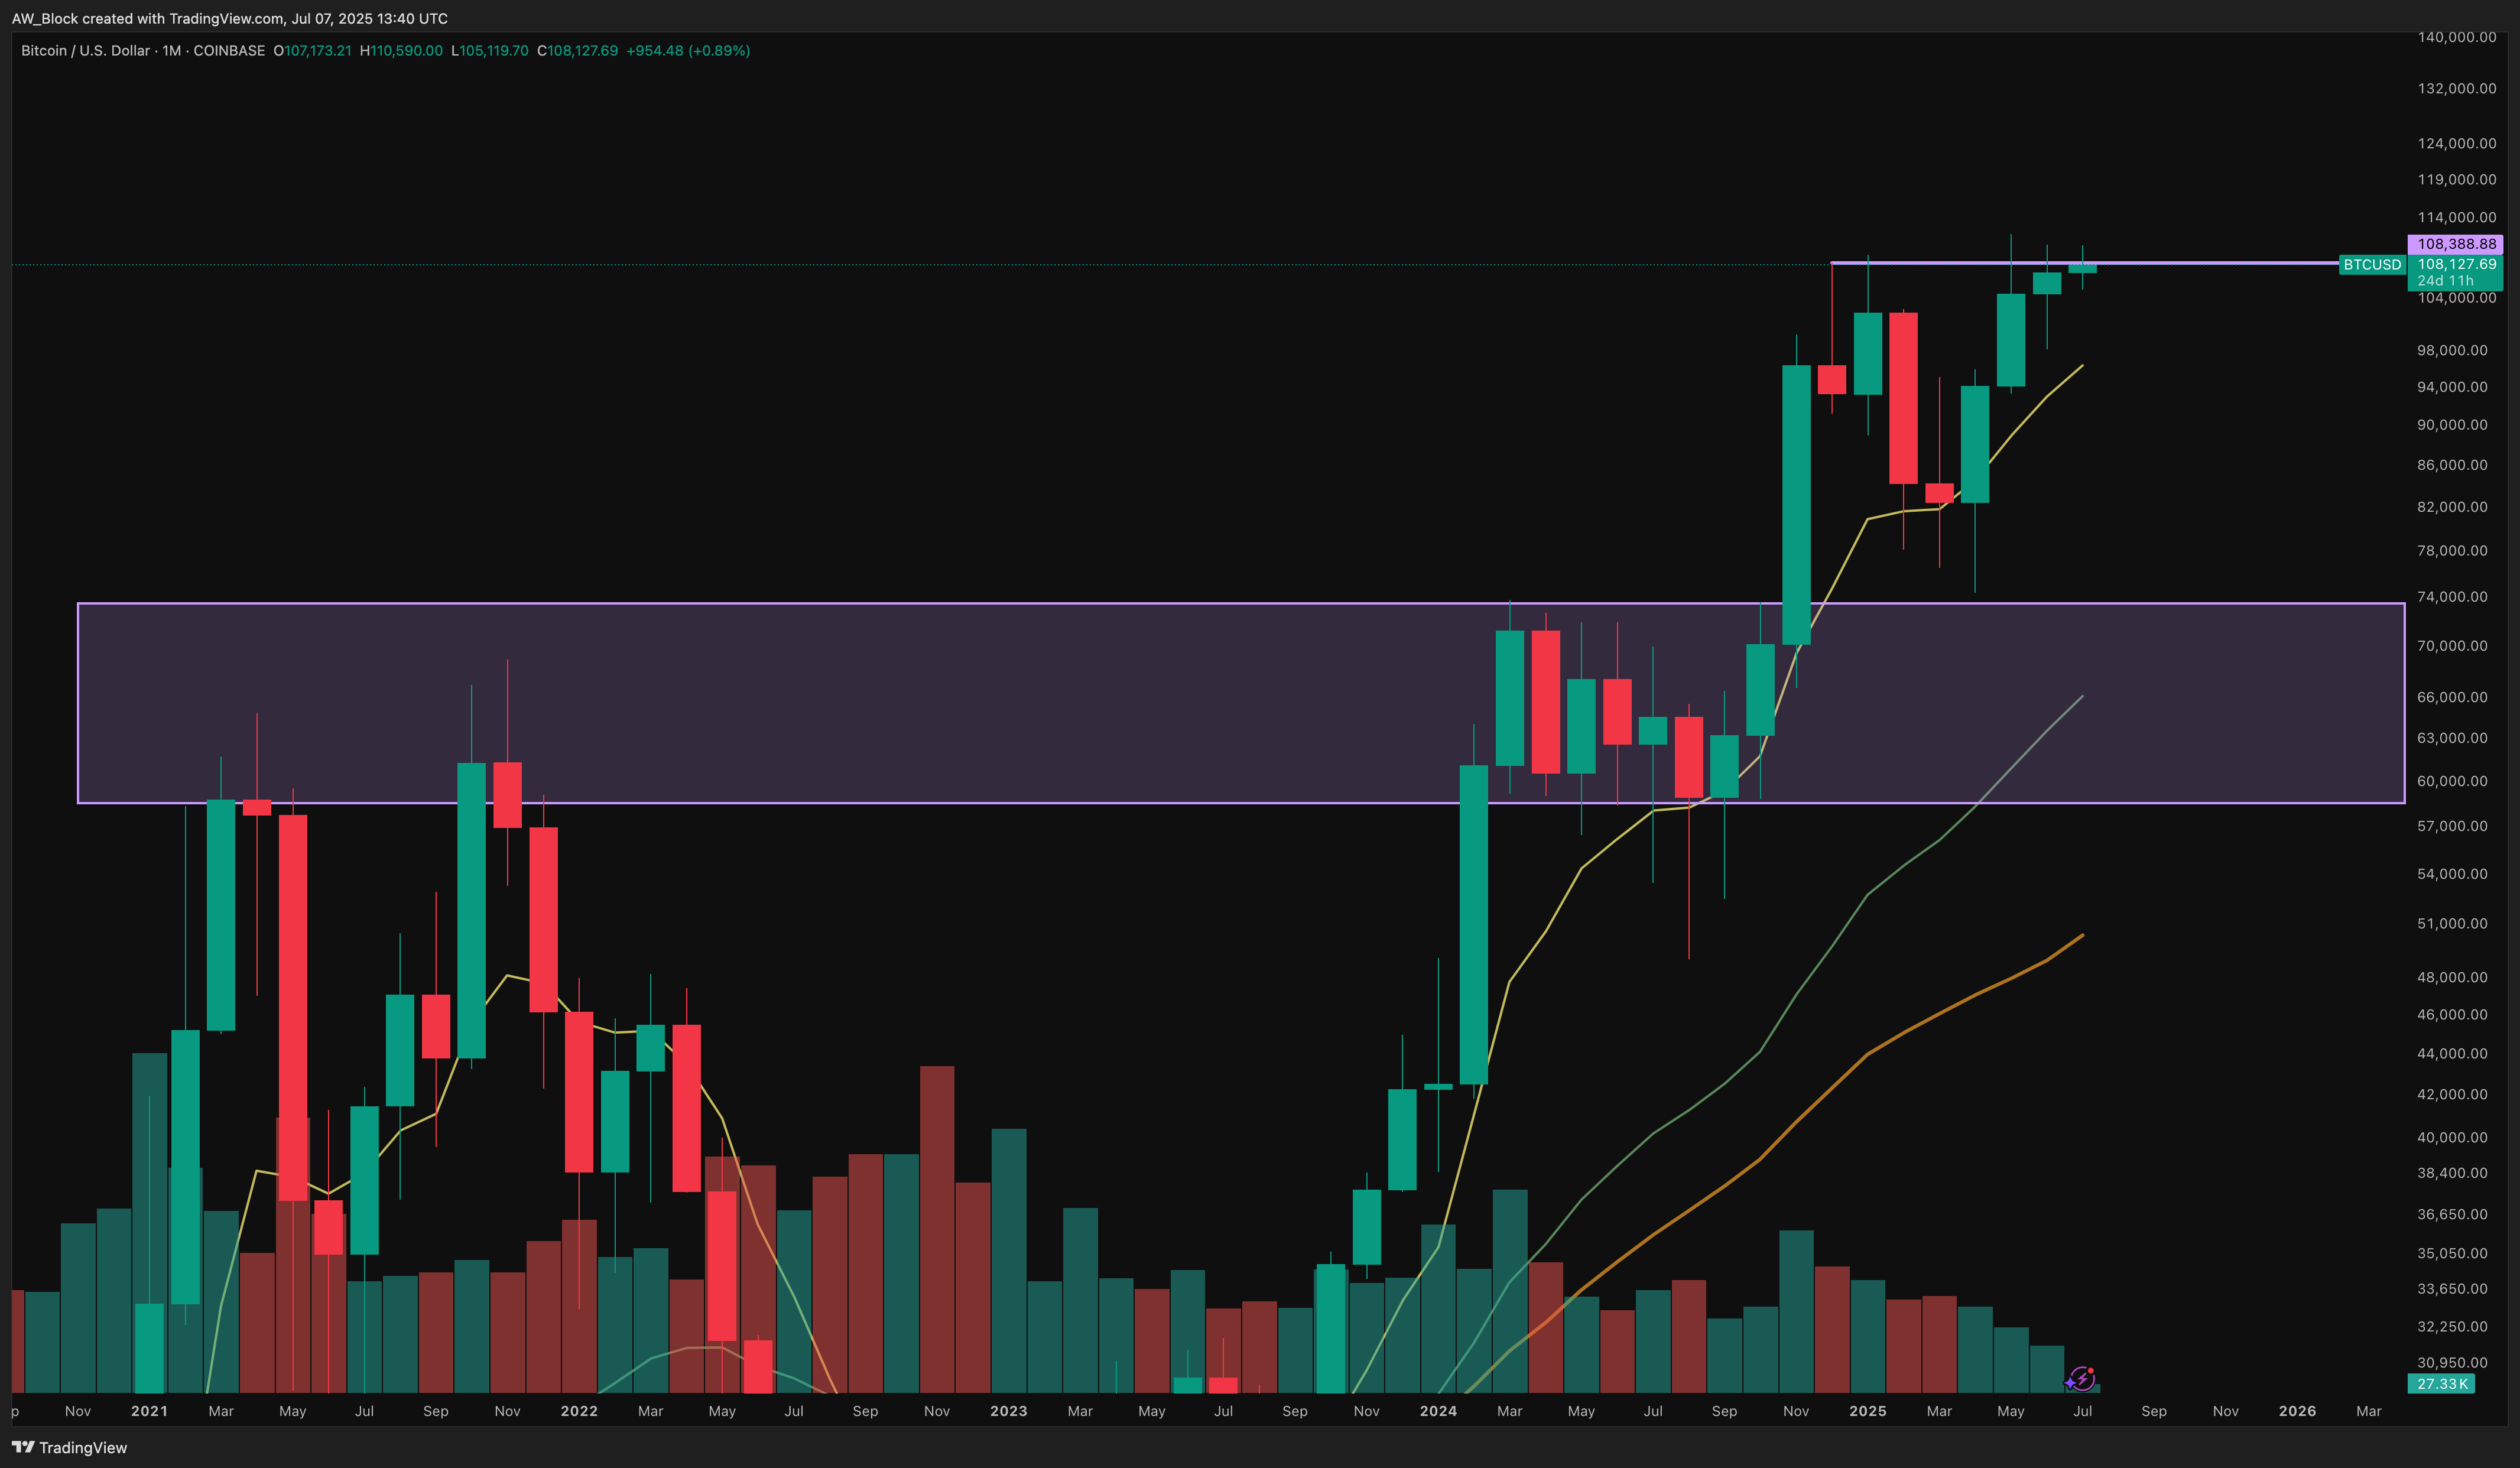
Bitcoin continues to grind just beneath the key weekly resistance zone between $107K and $112K. Price has been consolidating in this range for several candles now. While structure remains bullish, it still hasn’t managed to break cleanly through the top of that blue box. Momentum is clearly tilted upward—but so far, follow-through has been underwhelming.
The 8EMA is curling up beneath price, offering support to this consolidation. Still, make no mistake: the $109K–$112K area is acting as firm resistance. Bitcoin’s tested this zone several times before, only to get rejected. A decisive weekly close above it would open the door for a push toward $120K and beyond.
On the flip side, if buyers don’t step in soon, a pullback to the $105K area seems likely. That would be a healthy retest of the breakout structure and could reset some overheated short-term indicators. If that breaks, next major support sits in the $92K–$94K zone—where previous resistance flipped to support and the 34EMA is now creeping up. Bulls still have control, but they’ll need to show conviction—and soon.
Daily
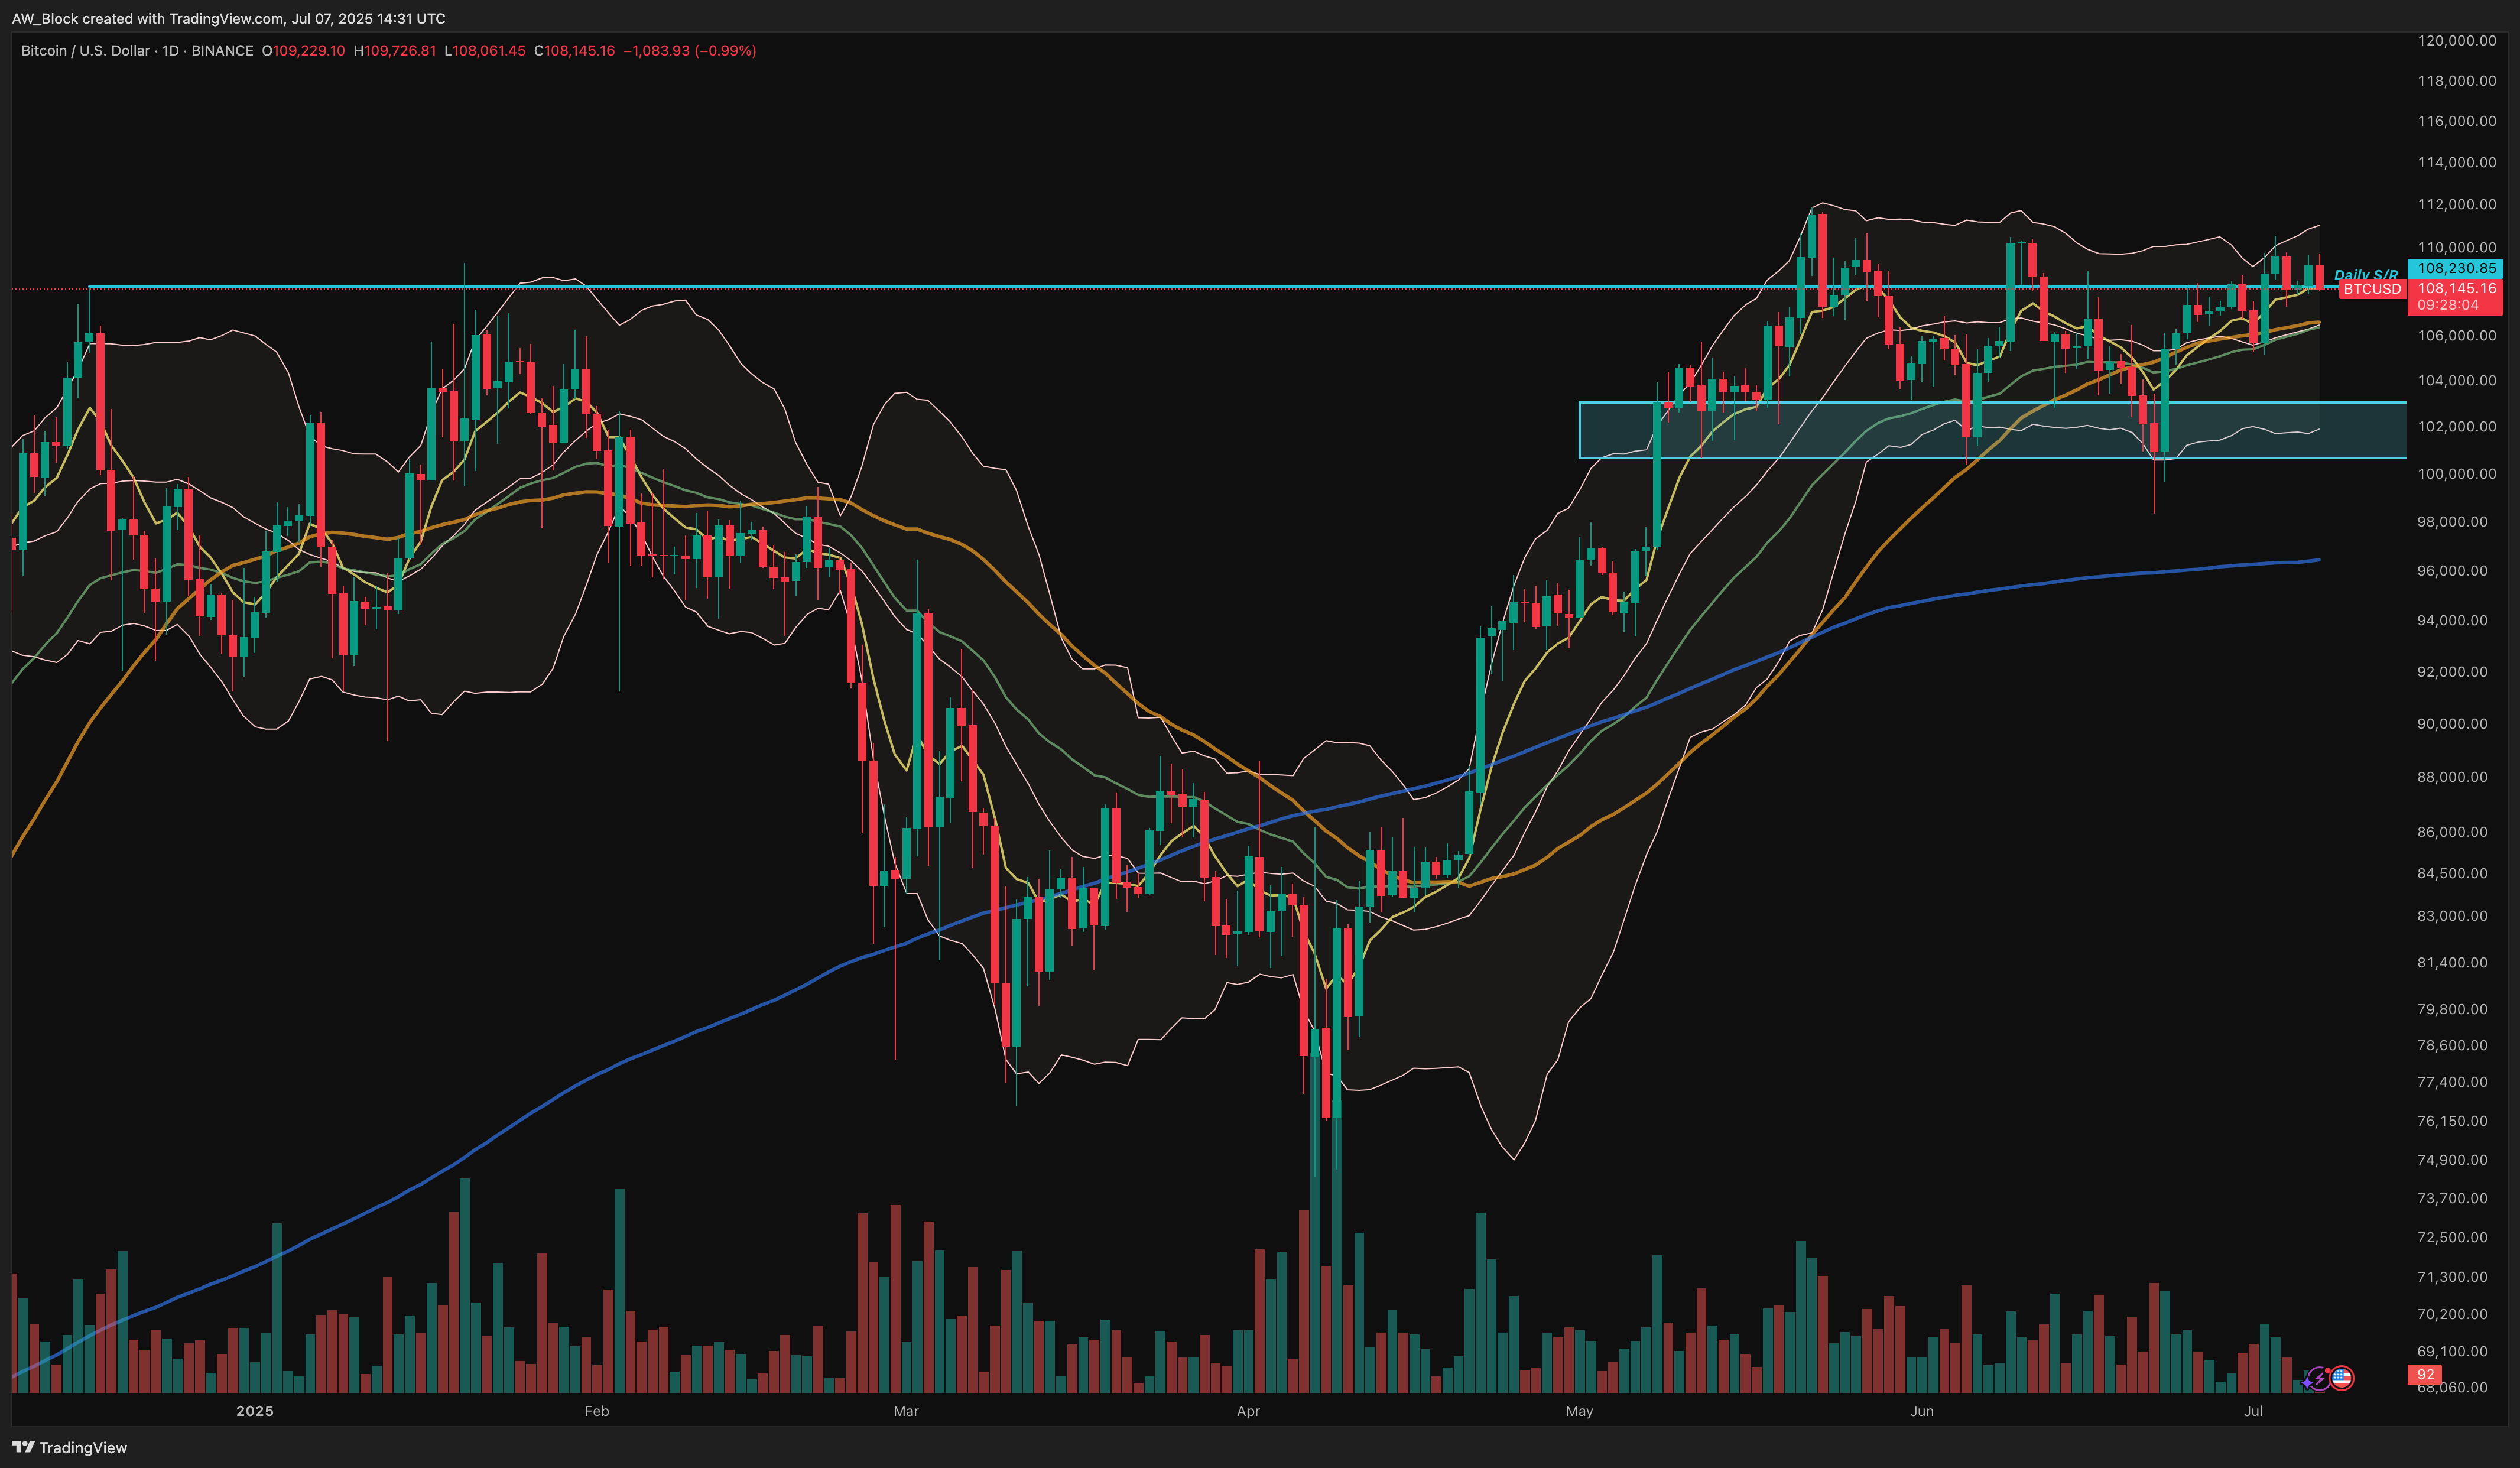
Bitcoin has been chopping sideways in a relatively tight range, but the daily chart still leans bullish—for now. The uptrend off the April low remains intact, and despite some volatility, price continues to hold above the key daily demand zone in the low $100Ks. This zone has been tested multiple times and consistently acts as a springboard for price.
The 8EMA (yellow) and 34EMA (green) are both sloping upward and holding well on pullbacks, reinforcing trend momentum. The 50MA (orange) is also climbing and now sits just beneath price as dynamic support. As long as BTC stays above the $106K–$107K region and prints higher lows, the bulls remain in control.
Price is also hugging the upper half of the Bollinger Bands, with several candles tapping or piercing the top band—signs of strength, albeit with some caution. The middle band (20 SMA) is acting as a median support level. A decisive break below it could open the door for a deeper retest toward the 200MA (blue), but for now, the structure holds firm.
In short, Bitcoin is consolidating at elevated levels while respecting key trend indicators. Until the $103K–$104K zone or major EMAs break down, the path of least resistance remains to the upside.
The Fundamentals
Hashrate
This monthly Bitcoin hashrate chart tells a story of long-term strength, resilience, and relentless growth in the network’s security. Since the 2021 China mining ban, which caused a major temporary drop in hashrate, the chart has carved out a sharp and consistent uptrend—one that has continued even through major bear markets, price drawdowns, and most recently, the 2024 halving.
Although we just saw a notable monthly pullback of over 11%, the broader structure remains intact. Hashrate has consistently printed higher highs and higher lows for over three years, indicating that miner confidence and infrastructure investment are still expanding over time. This latest dip could be a short-term recalibration following the post-halving efficiency crunch, but unless this leads to a sustained breakdown in the trend, it’s not a reason for concern yet.
Hashrate is often referred to as Bitcoin’s backbone—and right now, that backbone still looks strong.
AVG Mining Cost
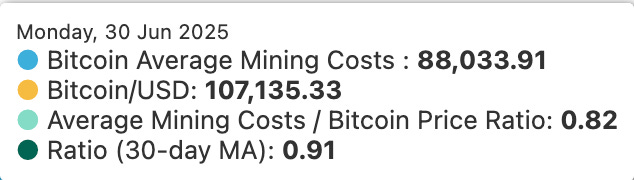
As of June 30, 2025, the average cost to mine one Bitcoin is roughly $88,000 USD — a slight dip of roughly ≈$3,000 from the last report.
Market Cap
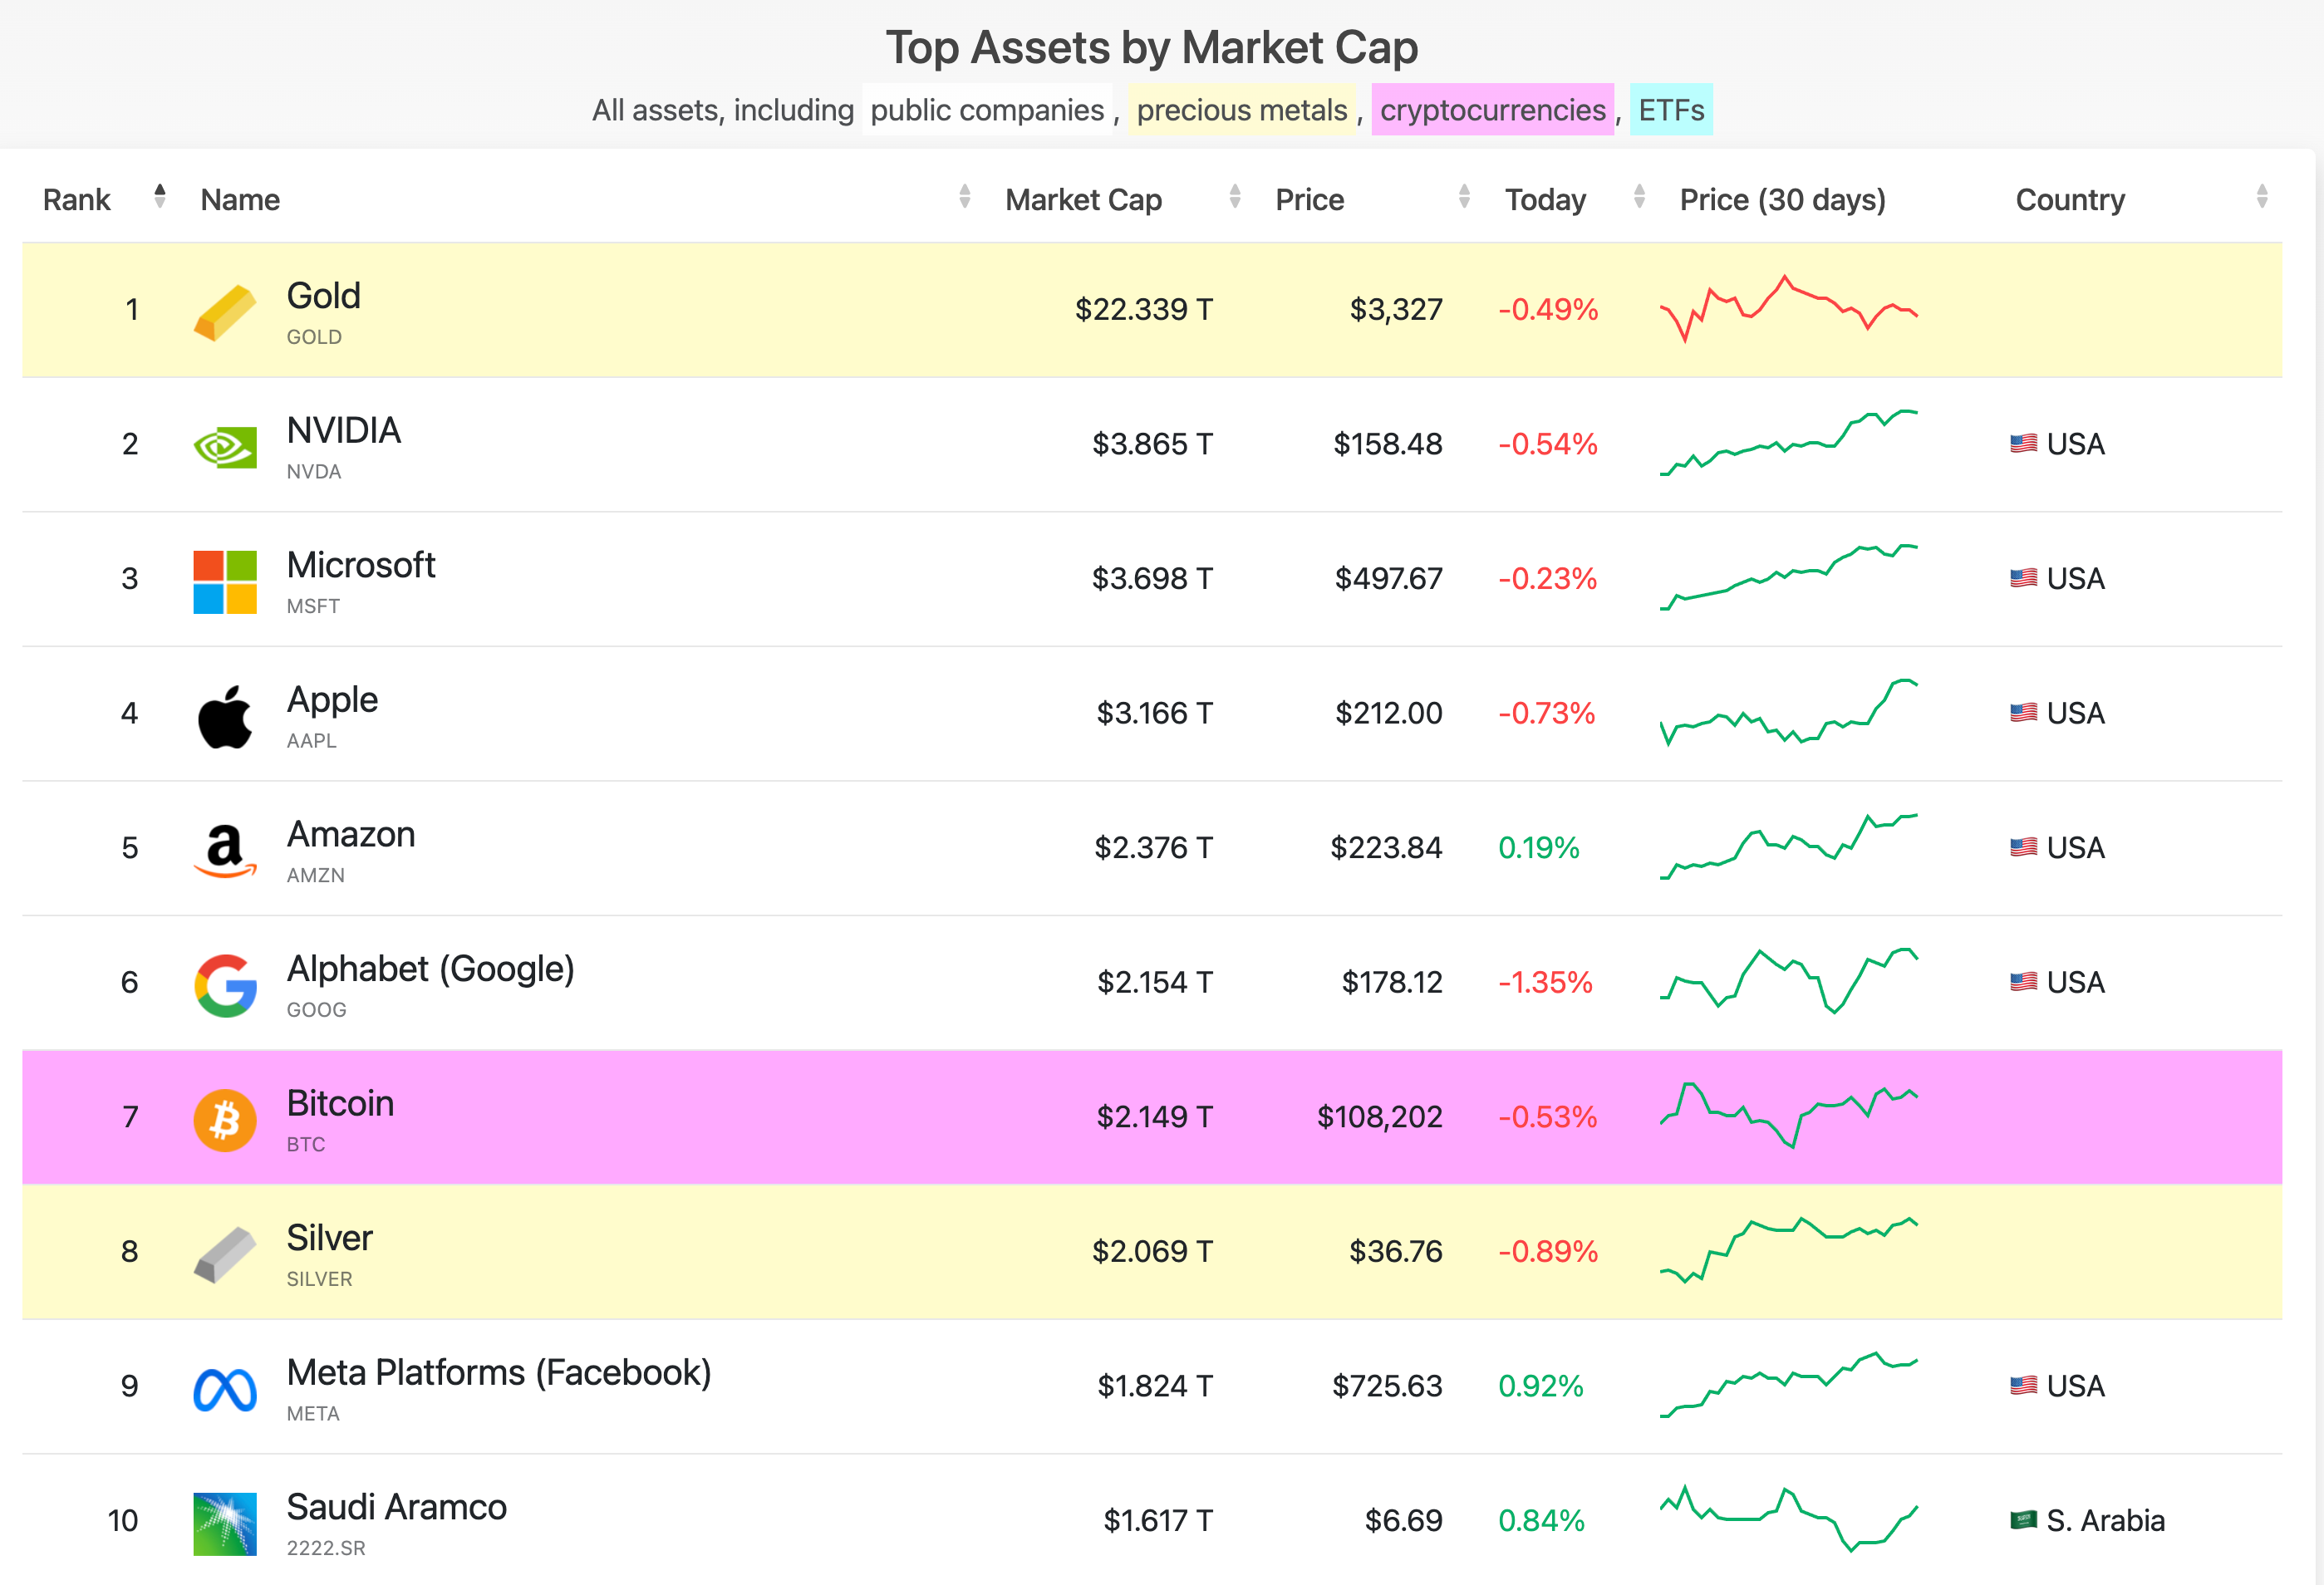
Bitcoin’s market cap is still holding above $2 trillion, currently sitting at $2.149 trillion — a 2.63% increase over the past month.
Bitcoin News
Highlights from the month of June
Texas Gov. Abbott Signs Bill to Create State Bitcoin Reserve
Anthony Pompliano’s ProCap BTC Buys $386M in Bitcoin
Japan’s Metaplanet Acquires 1,005 More Bitcoin, Total Holdings Reach 13,350 BTC
Trump Crypto Venture Raises $220 Million for Bitcoin Mining
Strategy Acquires $531.9 Million in Bitcoin, Now Holds 597,325 BTC
If you have any suggestions, feel free to reach out to me on X. I’m always looking to improve and add value in ways others might enjoy—just keep it Bitcoin only.
Live free and stack sats,
Will
“Bitcoin wasn’t created to make you rich. It was created so that you can opt out of a broken system” - Chairforce