

The Block Report #13
Macro price action, on-chain data, and market structure. No noise.

The Block Report #13 | April 6, 2026 | By William Sanchez Jr., Founder of A.W. Block
Bitcoin is in a confirmed macro markdown phase, and April is shaping up as the month that determines whether this is stabilization or continuation. The monthly candle swept liquidity at $64,960, rejected strength at $76,008, and is now compressing below $73,000. which was the level that broke in March and converted to overhead resistance. Until there is a monthly close above ≈$73,000, the trend reads one direction.
None of this is financial advice.
Don’t trust, verify.
Let’s dive in.
TL;DR — KEY TAKEAWAYS
Monthly structure: Confirmed LH/LL markdown from ATH; April is forming at the 34 EMA and lower monthly support ($61,000–$65,000); no change of character until a monthly close above ≈$73,000
Weekly structure: Clean bullish recovery candle off $65,692 — above the $63K–$65K support zone — but one day of data inside a broken structure; $73,000 remains the level that matters
BTC vs. Gold/Silver: Bitcoin held flat month-over-month ($1.387T to $1.397T) while Gold dropped from $36.83T to $32.61T and Silver from $4.95T to $4.12T; on a macro risk-off day, Bitcoin printed +3.53% against broad equity weakness
Hashrate: Network is in early stress — 830 EH/s represents a ~17% decline from Issue #12 and a one-third retracement from the late 2025 peak near 1,250 EH/s; proof-of-work moat intact, mining environment deteriorating
Mining cost vs. price: First month-over-month ratio compression since the corrective phase began — cost-to-price ratio moved from 1.35 to 1.20 — but production still costs 20% more than the market pays; capitulation conditions remain active
Market cap / rank: Bitcoin reclaimed #12 globally at $1.397T; the reclaim was driven by weakness in equities and precious metals, not Bitcoin strength
Primary scenario: Bearish structure intact below $73,000; the April monthly close relative to $71,000 is the single most important data point this month
The Technicals
Monthly
OHLC DATA
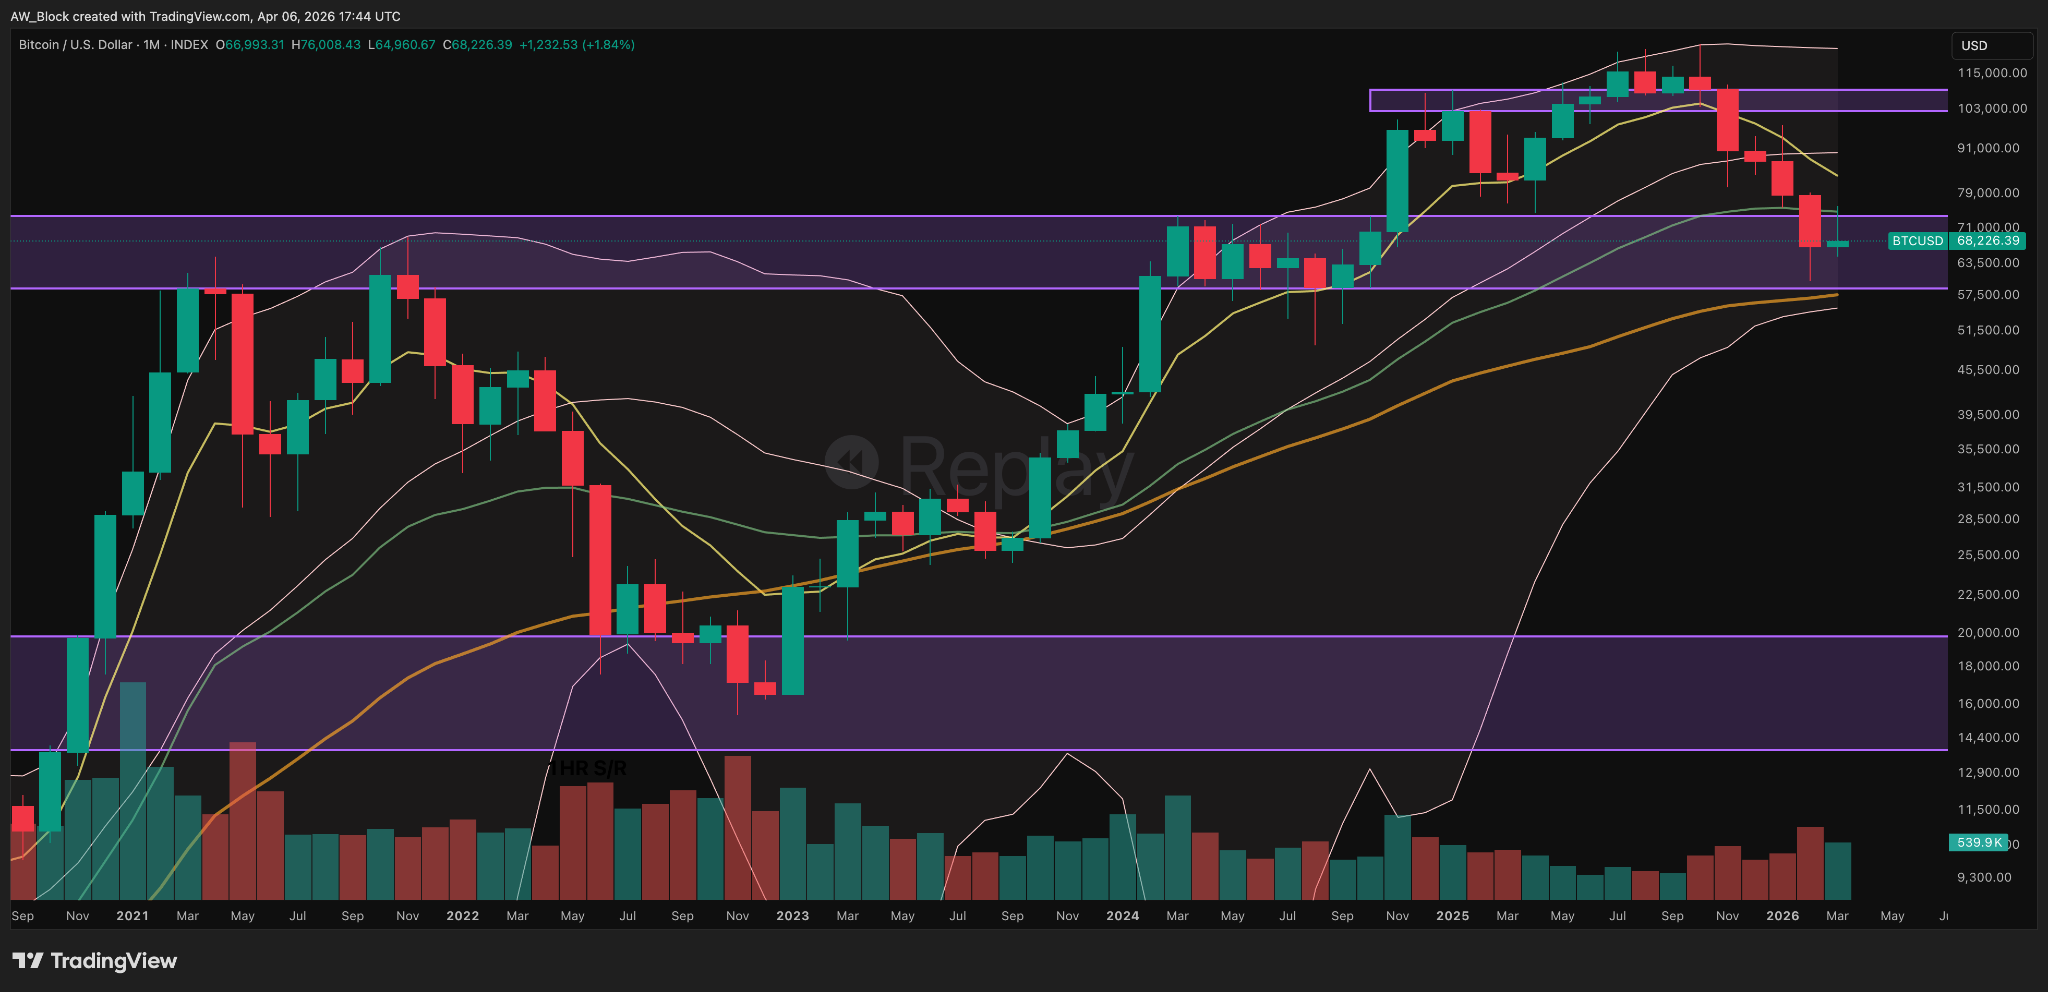
Open: $66,993.31
High: $76,008.43
Low: $64,960.67
Close: $68,226.39
CHART OVERVIEW
Bitcoin is in an active markdown phase on the monthly timeframe. Distribution from the ATH zone near $109,000 produced a confirmed sequence of lower highs and lower lows across successive monthly candles. That sequence has not been interrupted.
The February 2026 partial candle swept below $65,000 into the monthly support zone, then recovered toward around ≈$67,000. That’s the behavior of a liquidity flush and partial reabsorption within a declining trend — not a reversal. Price remains below the $71,000–$73,000 former support zone and below all declining short-to-medium term averages. Sellers control the monthly structure. Bollinger Bands remain wide with no compression signal in sight.
KEY LEVELS
Support/Resistance:
$103,000–$107,000 — Rejection origin and prior ATH consolidation zone; distribution ceiling
$71,000–$73,000 — Former structural support converted to overhead resistance; the current decision zone
$63,500–$65,000 — Near-term monthly support; lower boundary of the current price compression range
EMA / MA Levels:
8 EMA: ~$83,000 — Declining sharply; well above price; bearish monthly momentum confirmed
34 EMA: ~$74,000 — Price testing from above; this is the monthly equilibrium line and a critical hold/fail zone
50 MA: ~$57,000 — Rising; macro structural support well below current price
200 MA: Not visible at current monthly chart scale
Slope of averages: 8 EMA and 34 EMA both declining. 50 MA still rising. The EMA stack is bearish with no cluster confluence near price — no demand zone identified by averages at current levels.
MARKET STRUCTURE
The monthly sequence from the October 2025 ATH is a textbook LH/LL progression. The break of structure occurred when monthly closes failed to hold $103,000, followed by failure at $73,000 in March 2026. That failure confirmed the transition from distribution into markdown.
The April 2026 candle is forming at the 34 EMA and the lower monthly support zone ($63,500–$65,000). The intramonth flush to $64,960 is the first monthly close-proximity test of that zone. No change of character is confirmed. A monthly close above $71,000 is the minimum requirement before any higher-low structure can be evaluated. Until then: markdown continuation with compression developing at the lower monthly band.
CANDLESTICK BEHAVIOR
Wide-range candle with upper and lower shadow — classification pending end-of-month close.
Context: Forming at the monthly 34 EMA and the $63,500–$65,000 support zone, following an intramonth sweep of $64,960.
Implication: The candle structure tells a clear story. Early Marchstrength to $76,008 was rejected. A hard flush to $64,960 followed. Price has partially recovered to $68,226. The upper shadow at $76,008 signals supply re-entry on strength. The lower wick at $64,960 signals that buyers absorbed the initial panic flush. Neither side has produced acceptance. Month-end close is the only valid classification moment. A close above $71,000 shifts toward absorption. A close below $65,000 confirms markdown continuation.
PATTERN RECOGNITION
Post-distribution markdown — no discrete reversal formation identifiable at this stage.
Stage: Post-breakdown. Price is trading below the $71,000–$73,000 prior support zone with no retest confirmation.
Break Direction Probability: Continuation of the downtrend is the structural lean while price holds below $73,000.
Invalidation: A monthly close and sustained acceptance above $73,000 invalidates the markdown structure and opens the path toward structural repair.
VOLUME CONTEXT
Monthly volume during the January–March 2026 decline was elevated relative to the 2023–2024 accumulation phase — consistent with distribution-phase selling. The April partial candle’s volume is forming on a recovering session following an extreme flush. No exhaustion spike is visible on the current candle. Any reclaim of the $71,000–$73,000 zone requires volume expansion to confirm genuine demand absorption rather than a low-participation technical bounce.
MARKET PSYCHOLOGY
Participants who entered during the October 2024 – February 2025 range ($73,000–$103,000) are structurally underwater. The $76,008 intramonth high in April reflects residual buyer interest attempting to reclaim prior levels — that attempt was rejected by supply at the $76K region.
The flush to $64,960 produced forced exits from leveraged positions and stop-loss cascades from spot holders who entered during the 2024 expansion. The recovery to $68,226 is ambiguous. It may reflect accumulation-intent demand at the lower monthly zone. It may also be a technical recovery ahead of continued distribution. Without acceptance above $71,000, the crowd is operating in a fear-dominant, reactive state.
SCENARIOS
Bullish Scenario:
Condition required: April monthly close above $71,000 with continued strength in May
Key level to reclaim: $73,000 — former structural support must convert to acceptance zone
Structure shift needed: Monthly candle printing a higher high above $76,008 on the next bar to establish a confirmed HH
Bearish Scenario:
Condition required: Monthly close below $63,500
Key level to lose: $63,500–$65,000 support band
Continuation structure: Next structural targets at the 50 MA (~$52,000), followed by the $45,000–$48,000 measured move zone
SUMMARY
Bitcoin is in a confirmed macro markdown phase following ATH distribution. The April partial candle is forming at the 34 EMA and the lower monthly support zone, with the intramonth structure showing rejection of early strength and recovery from a liquidity flush. All short-to-medium term averages are declining and positioned above price. Sellers remain dominant. The $71,000–$73,000 overhead zone controls the directional bias.
WHAT MATTERS MOST
The April monthly close relative to $71,000 is the only number that matters right now. Anything below that level is not a change of character — it is noise inside a downtrend.
Weekly
OHLC DATA
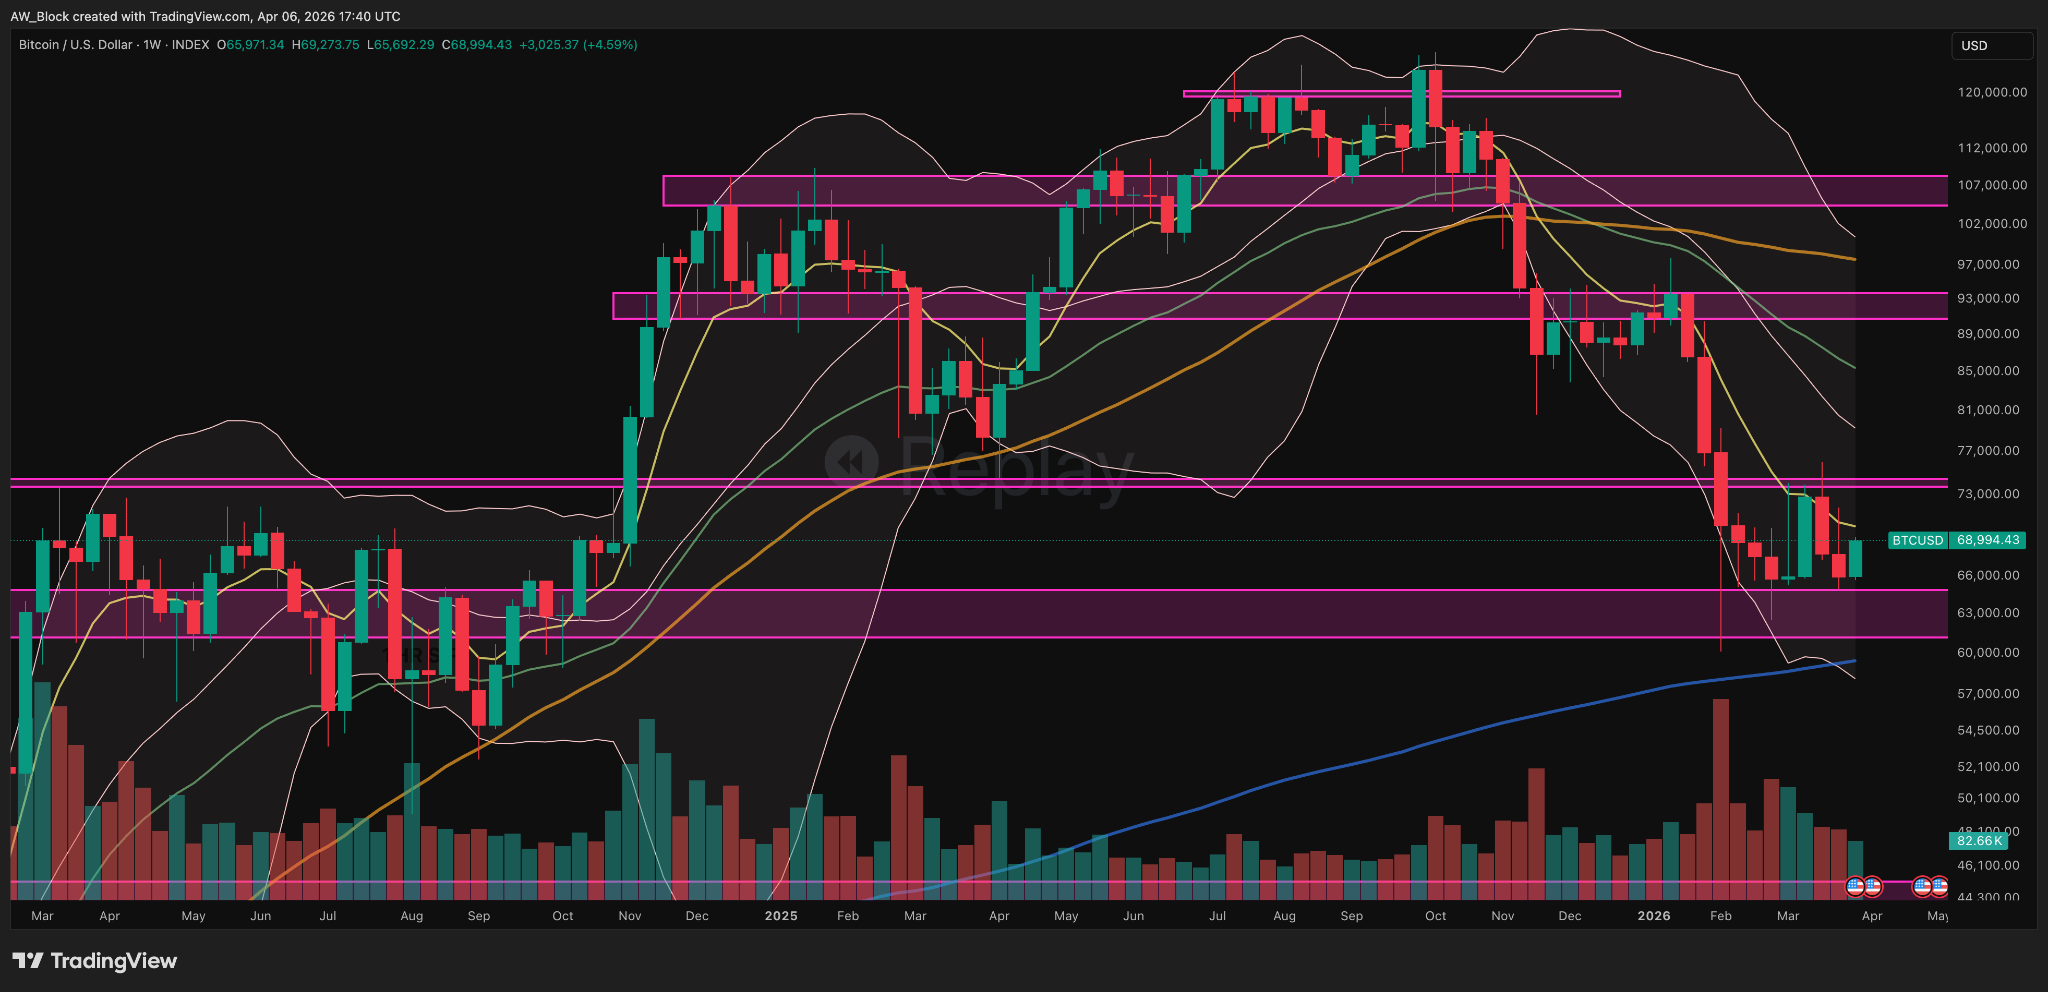
Open: $65,971.34
High: $69,273.75
Low: $65,692.29
Close: $68,994.43
CHART OVERVIEW
Bitcoin’s weekly structure remains a defined markdown sequence from the ATH. The $73,000 zone broke in February 2026 and converted to overhead resistance. That is the structural fact everything else is subordinate to.
The current weekly candle opened at $65,971, dipped marginally to $65,692, and has since rallied to $69,273, currently sitting at $68,994. The candle’s character is a clean bullish recovery bar: small lower wick, large upper body, close near the weekly high. The $63,000–$65,000 support zone was not tested. The $65,692 low held above it. Price is now pressing into the lower boundary of the $68,000–$73,000 contested zone with one trading day of data. Bollinger Bands remain wide — volatility expansion is the current regime.
KEY LEVELS
Support/Resistance:
$107,000–$109,000 — ATH zone and prior range peak; major overhead resistance
$93,000–$95,000 — Prior consolidation support
$73,000 — Critical structural level; former weekly support held for approximately 16 months (Oct 2024 – Feb 2026); broken and converted to overhead resistance
$61,000–$65,000 — Weekly support zone below price; convergence with monthly lower band
$47,000–$48,000 — Lower Bollinger Band zone; extended structural support
EMA / MA Levels:
8 EMA: ~$70,000 — Declining; well above price; bearish short-term momentum confirmed
34 EMA: ~$85,000 — Declining; significantly above price; trend control is bearish
50 MA: ~$97,000 — Declining; well above price; macro trend bias is bearish
200 MA: ~$60,000 — Rising; below price; long-term structural anchor rising toward price from below
Slope of averages: 8/34/50 are declining and stacked bearishly above price. The 200 MA is rising from below. Price is navigating a compression zone between $60K and $73K created by that structure.
MARKET STRUCTURE
The weekly sequence from the ATH is unambiguous: LH/LL at $107K, $93K, $73K — each level broken to the downside on successive weeks. The break below $73,000 is the defining event of this markdown phase. That zone held for approximately 16 months. Its loss was not minor.
No change of character has been confirmed. The current candle shows a recovery from $60,000 to $74,000. That is consistent with a relief bounce following an oversold flush, not a structural reversal. A weekly close and acceptance above $73,000 is the minimum condition before any shift in the LH/LL sequence can be evaluated. Until that happens, lower high attempts will attract sellers.
CANDLESTICK BEHAVIOR
Bullish recovery candle — small lower wick below the open, large upper body, close in the upper 90% of the week’s range.
Context: Forming at the $65,692 low, above the $61,000–$65,000 weekly support zone; week-opening strength off the prior week’s closing lows.
Implication: Per Nison, a candle closing in the upper portion of the range following a lower wick signals demand absorption. The marginal dip to $65,692 (0.4% below the open) and recovery to $68,994 indicates buyers responded immediately from the prior week’s closing level. This is not a hammer — the open and low are too close for that classification — but the close near the weekly high at $69,273 is a participation signal. Confirmation requires the following session to maintain above $68,000 and continue toward $73,000. A failure back below $65,692 negates the absorption read and signals an active test of the support zone.
PATTERN RECOGNITION
No discrete reversal pattern confirmed. The structure is a post-BOS relief bounce within a weekly channel breakdown.
Stage: Post-breakdown. Price is trading below the $73,000 neckline in a bearish flag/descending channel context.
Break Direction Probability: Continuation to the downside is the structural lean. The relief bounce requires acceptance above $73,000 to alter probability.
Invalidation: Weekly close above $73,000 on elevated volume invalidates the continuation structure and signals structural repair potential.
VOLUME CONTEXT
Weekly volume during the January–March 2026 decline was progressively elevated — consistent with distribution and forced liquidation. The week’s volume profile shows elevated activity on the recovery move from $65,692 to $68,994. That is a positive participation signal. One day of data is insufficient to draw conclusions from it. Volume must remain elevated through a close above $73,000 for the participation to carry structural weight. Declining volume on any move toward $73,000 signals a low-conviction test.
MARKET PSYCHOLOGY
The break of $73,000 in March 2026 trapped a significant cohort of buyers who entered during the 2024 bull expansion. Those participants are now underwater. The flush to $65,692 this week expelled weak hands and triggered margin calls, resetting positioning toward neutral or short-biased.
The sharp recovery to $68,994 — nearly erasing the entire weekly flush — reflects short covering and opportunistic demand. The crowd is now binary: those who held through the flush are relieved, and new sellers are treating $73,000 as the next distribution opportunity. That creates a contested zone between $68K and $73K that will resolve directionally on the weekly close.
SCENARIOS
Bullish Scenario:
Condition required: Weekly close above $69,273 (current week high) with continuation into $73,000
Key level to reclaim: $73,000 — full structural reclaim converts former support to acceptance zone
Structure shift needed: Weekly candle printing a higher high above the most recent LH to break the LH/LL sequence
Bearish Scenario:
Condition required: Failure to hold $68,000 into the weekly close, reversal back below $65,692
Key level to lose: $61,000–$65,000 support zone
Continuation structure: Measured move from the $73K breakdown targets $55,000–$57,000; 200 MA (~$60,000) is the first structural magnet below
SUMMARY
Bitcoin’s weekly structure is a confirmed LH/LL markdown sequence with the $73,000 break as the defining event. The current weekly candle is a clean bullish recovery bar off $65,692, closing near the weekly high. All short-to-medium term averages are declining and above price. The 200 MA (~$60,000) is the only rising structure, approaching from below. The $61,000–$74,000 zone is the active battleground. Sellers remain structurally dominant above $73,000.
WHAT MATTERS MOST
The $65,692 low held above the $63,000–$65,000 support zone. Whether this week closes above $69,000 and continues toward $73,000 — or reverses back into the prior week’s closing level — defines the near-term weekly thesis.
The Fundamentals
Hashrate
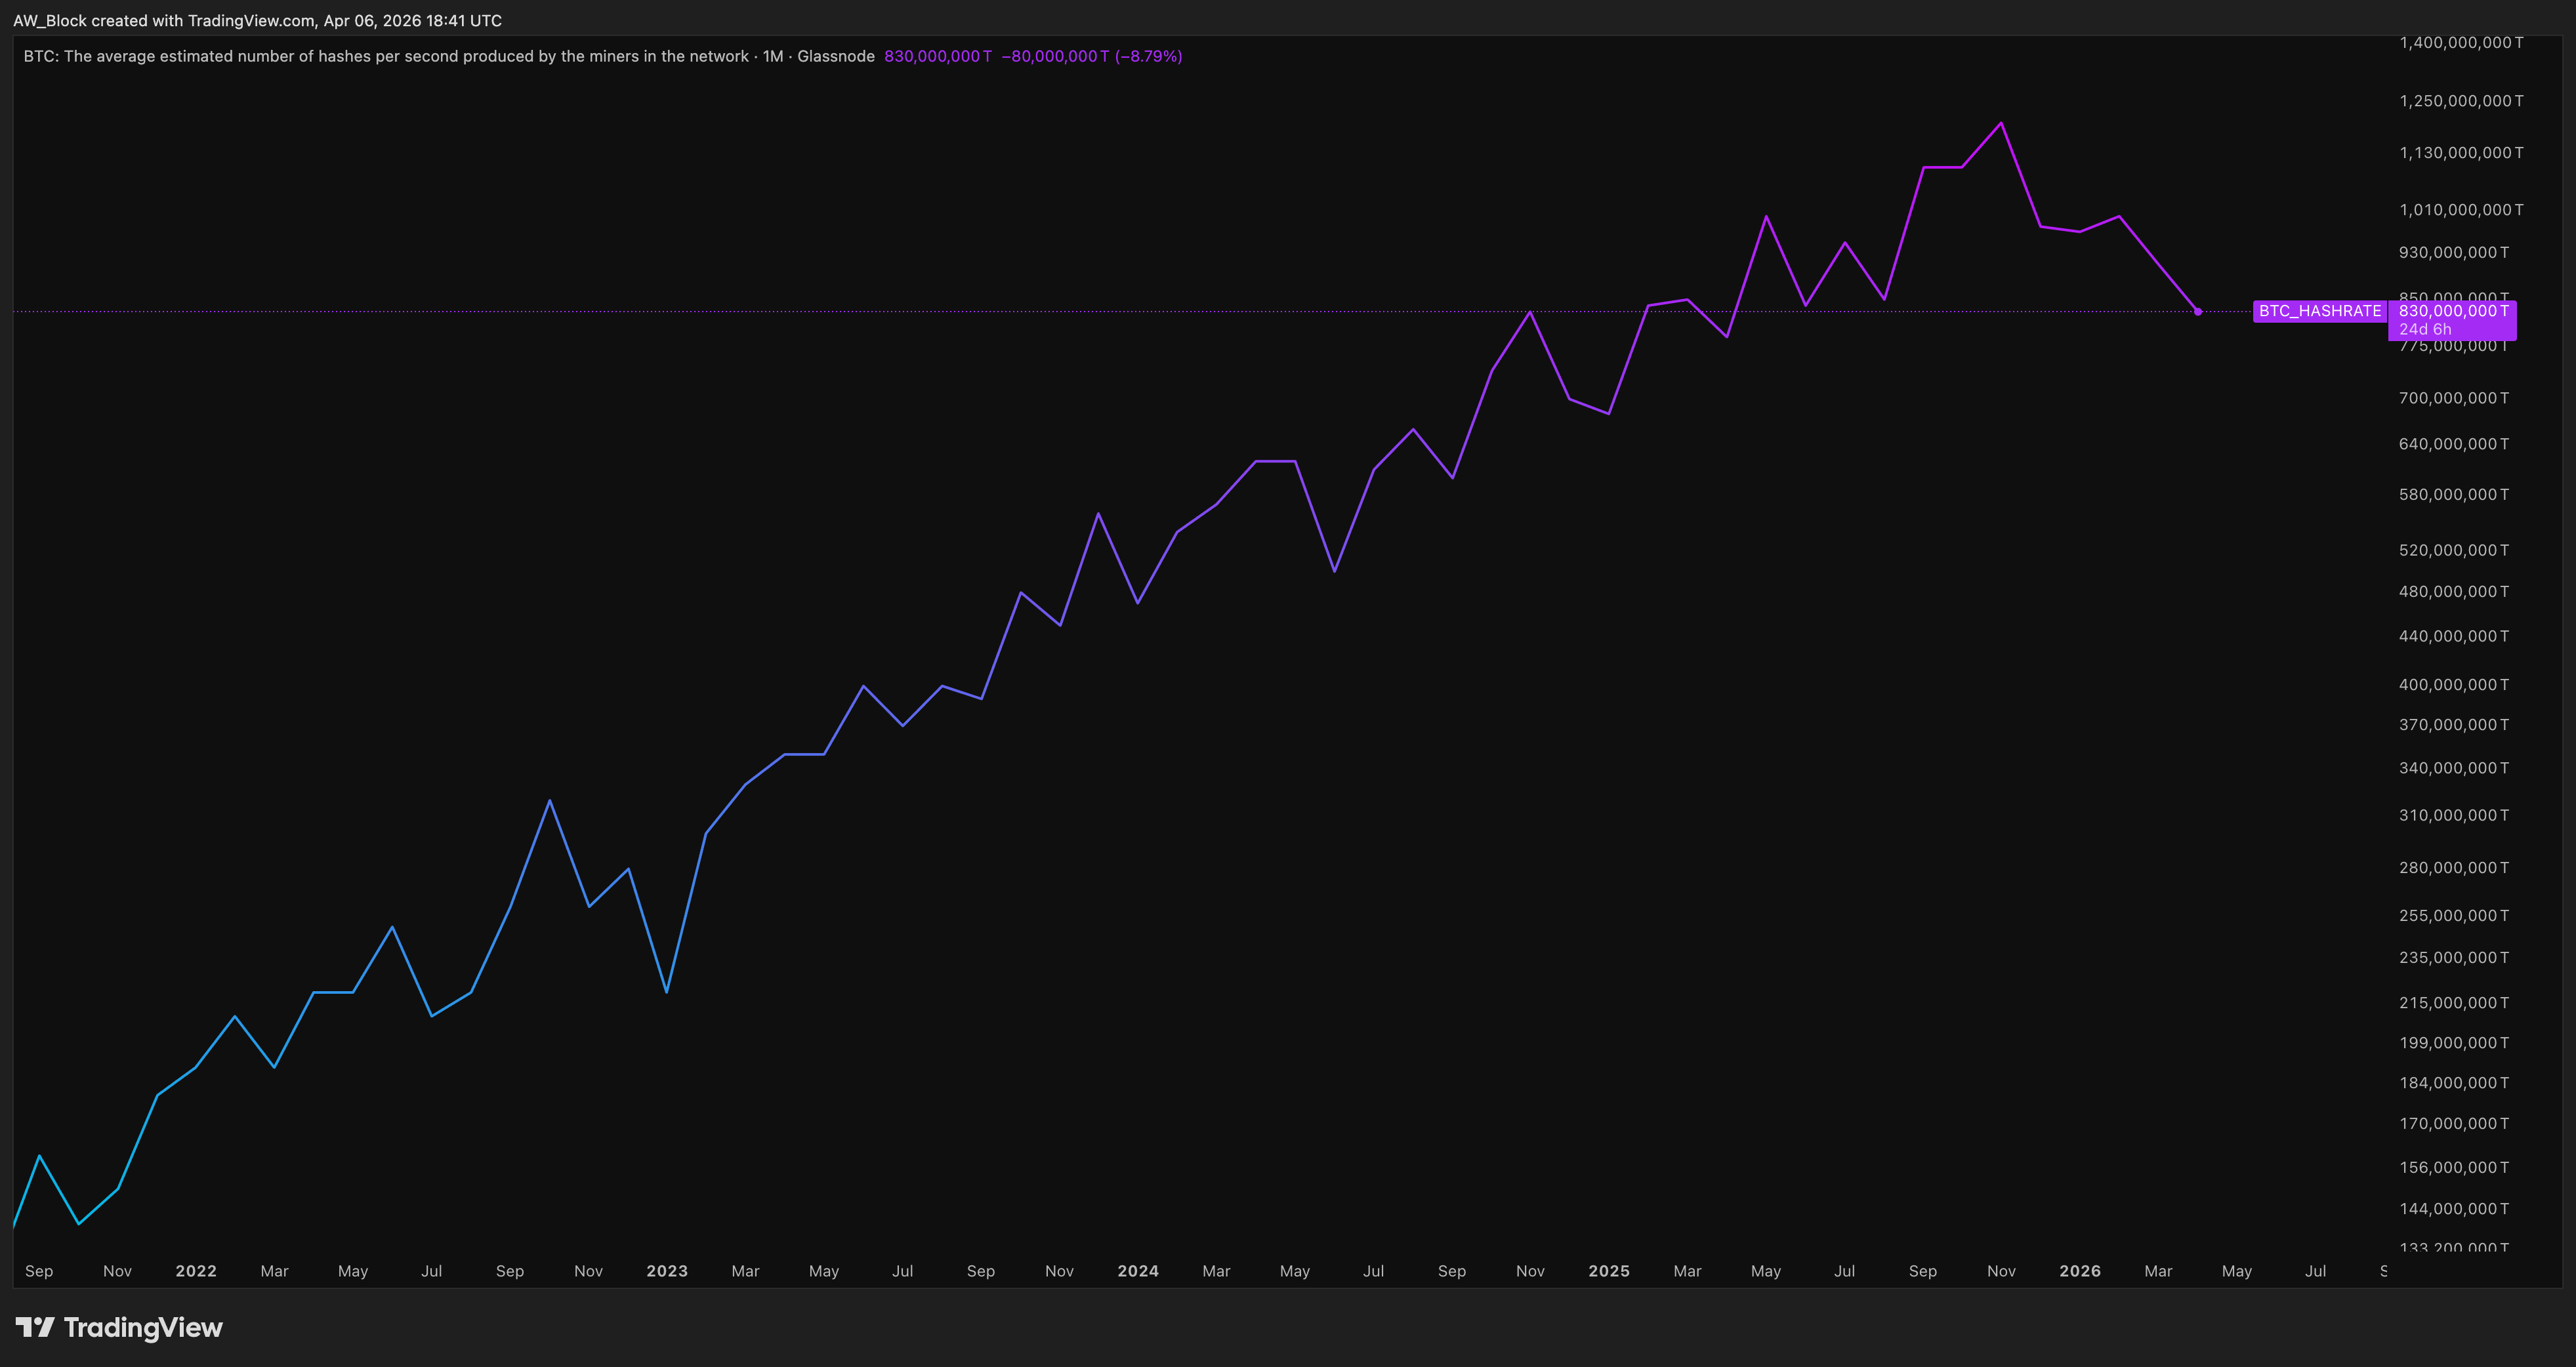
Issue 12 noted that hashrate had pushed to near 1 zettahash per second — a historic milestone — before pulling back modestly. The read at that time was normalization, not collapse. The conclusion was that price was correcting. The network was not.
That read requires an update.
The current reading is 830,000,000 TH/s, down 8.79% from the prior period and roughly 17% below the level referenced in Issue #12. The Glassnode 1M chart shows the peak near 1,250,000,000 TH/s in late 2024, with a sustained and accelerating decline now approaching the 2024 breakout zone near 830–850 EH/s. This is no longer a modest pullback after a surge. Hashrate has retraced approximately one-third of its peak value, and the monthly trend is pointing lower.
The network is not in catastrophic failure. Block production is ongoing and difficulty is adjusting. But the characterization from Issue #12 no longer applies. Miners producing at or above average cost are under structural revenue pressure, and the hashrate decline reflects that reality.
Verdict: the network has moved from normalization into early stress. The proof-of-work moat remains intact, but the mining environment is deteriorating.
Avg Mining Cost
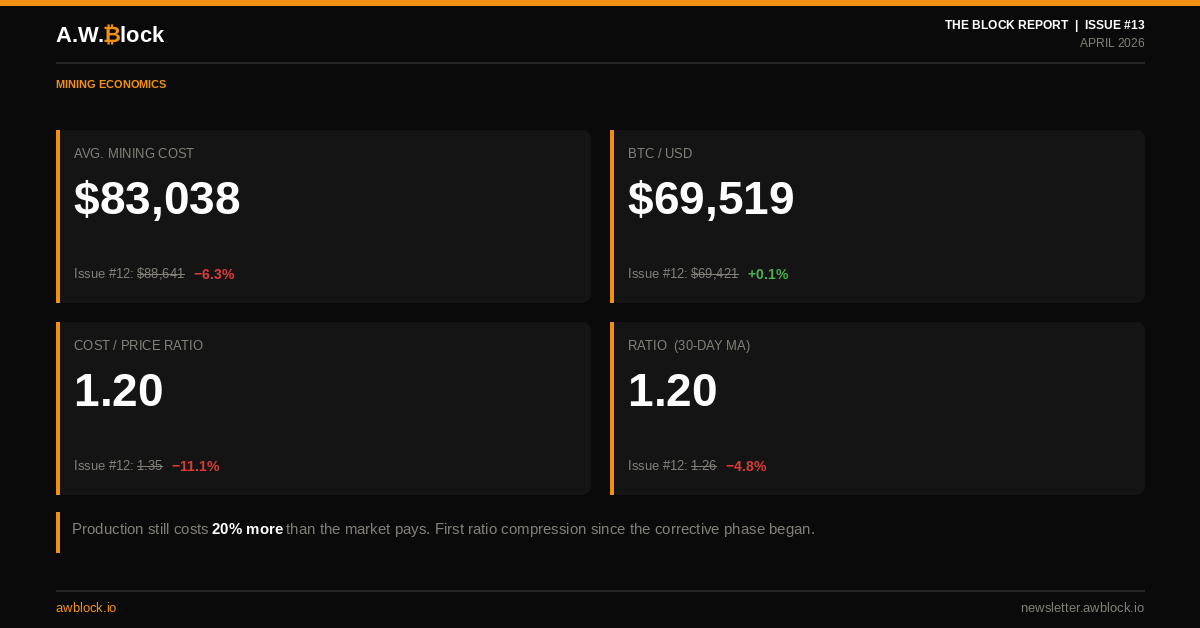
Last month, the average cost to mine one Bitcoin stood at $88,641 with a spot price of $69,720. The conclusion was meaningful deterioration in miner economics driven by price falling faster than costs could compress. The imbalance was revenue-driven, not cost-driven.
The current reading shows improvement on both sides of that equation.
As of April 5, 2026, the average mining cost has declined to $83,038 — down $5,603 from the March reading. Current spot is $69,519. The cost-to-price ratio has contracted to 1.20 from 1.35, and the 30-day MA ratio has settled at 1.20 as well, down from 1.26. This is the first month-over-month ratio compression since the corrective phase began. The driver is cost reduction outpacing spot weakness, efficiency improvements and difficulty adjustments are starting to close the gap.
The environment remains structurally unprofitable. A ratio of 1.20 means production still costs 20% more than the market will pay. Higher-cost operators continue to face forced selling and potential exit. The pressure is easing at the margin, but capitulation conditions are not absent, they are present and ongoing.
Top Assets by Market Cap
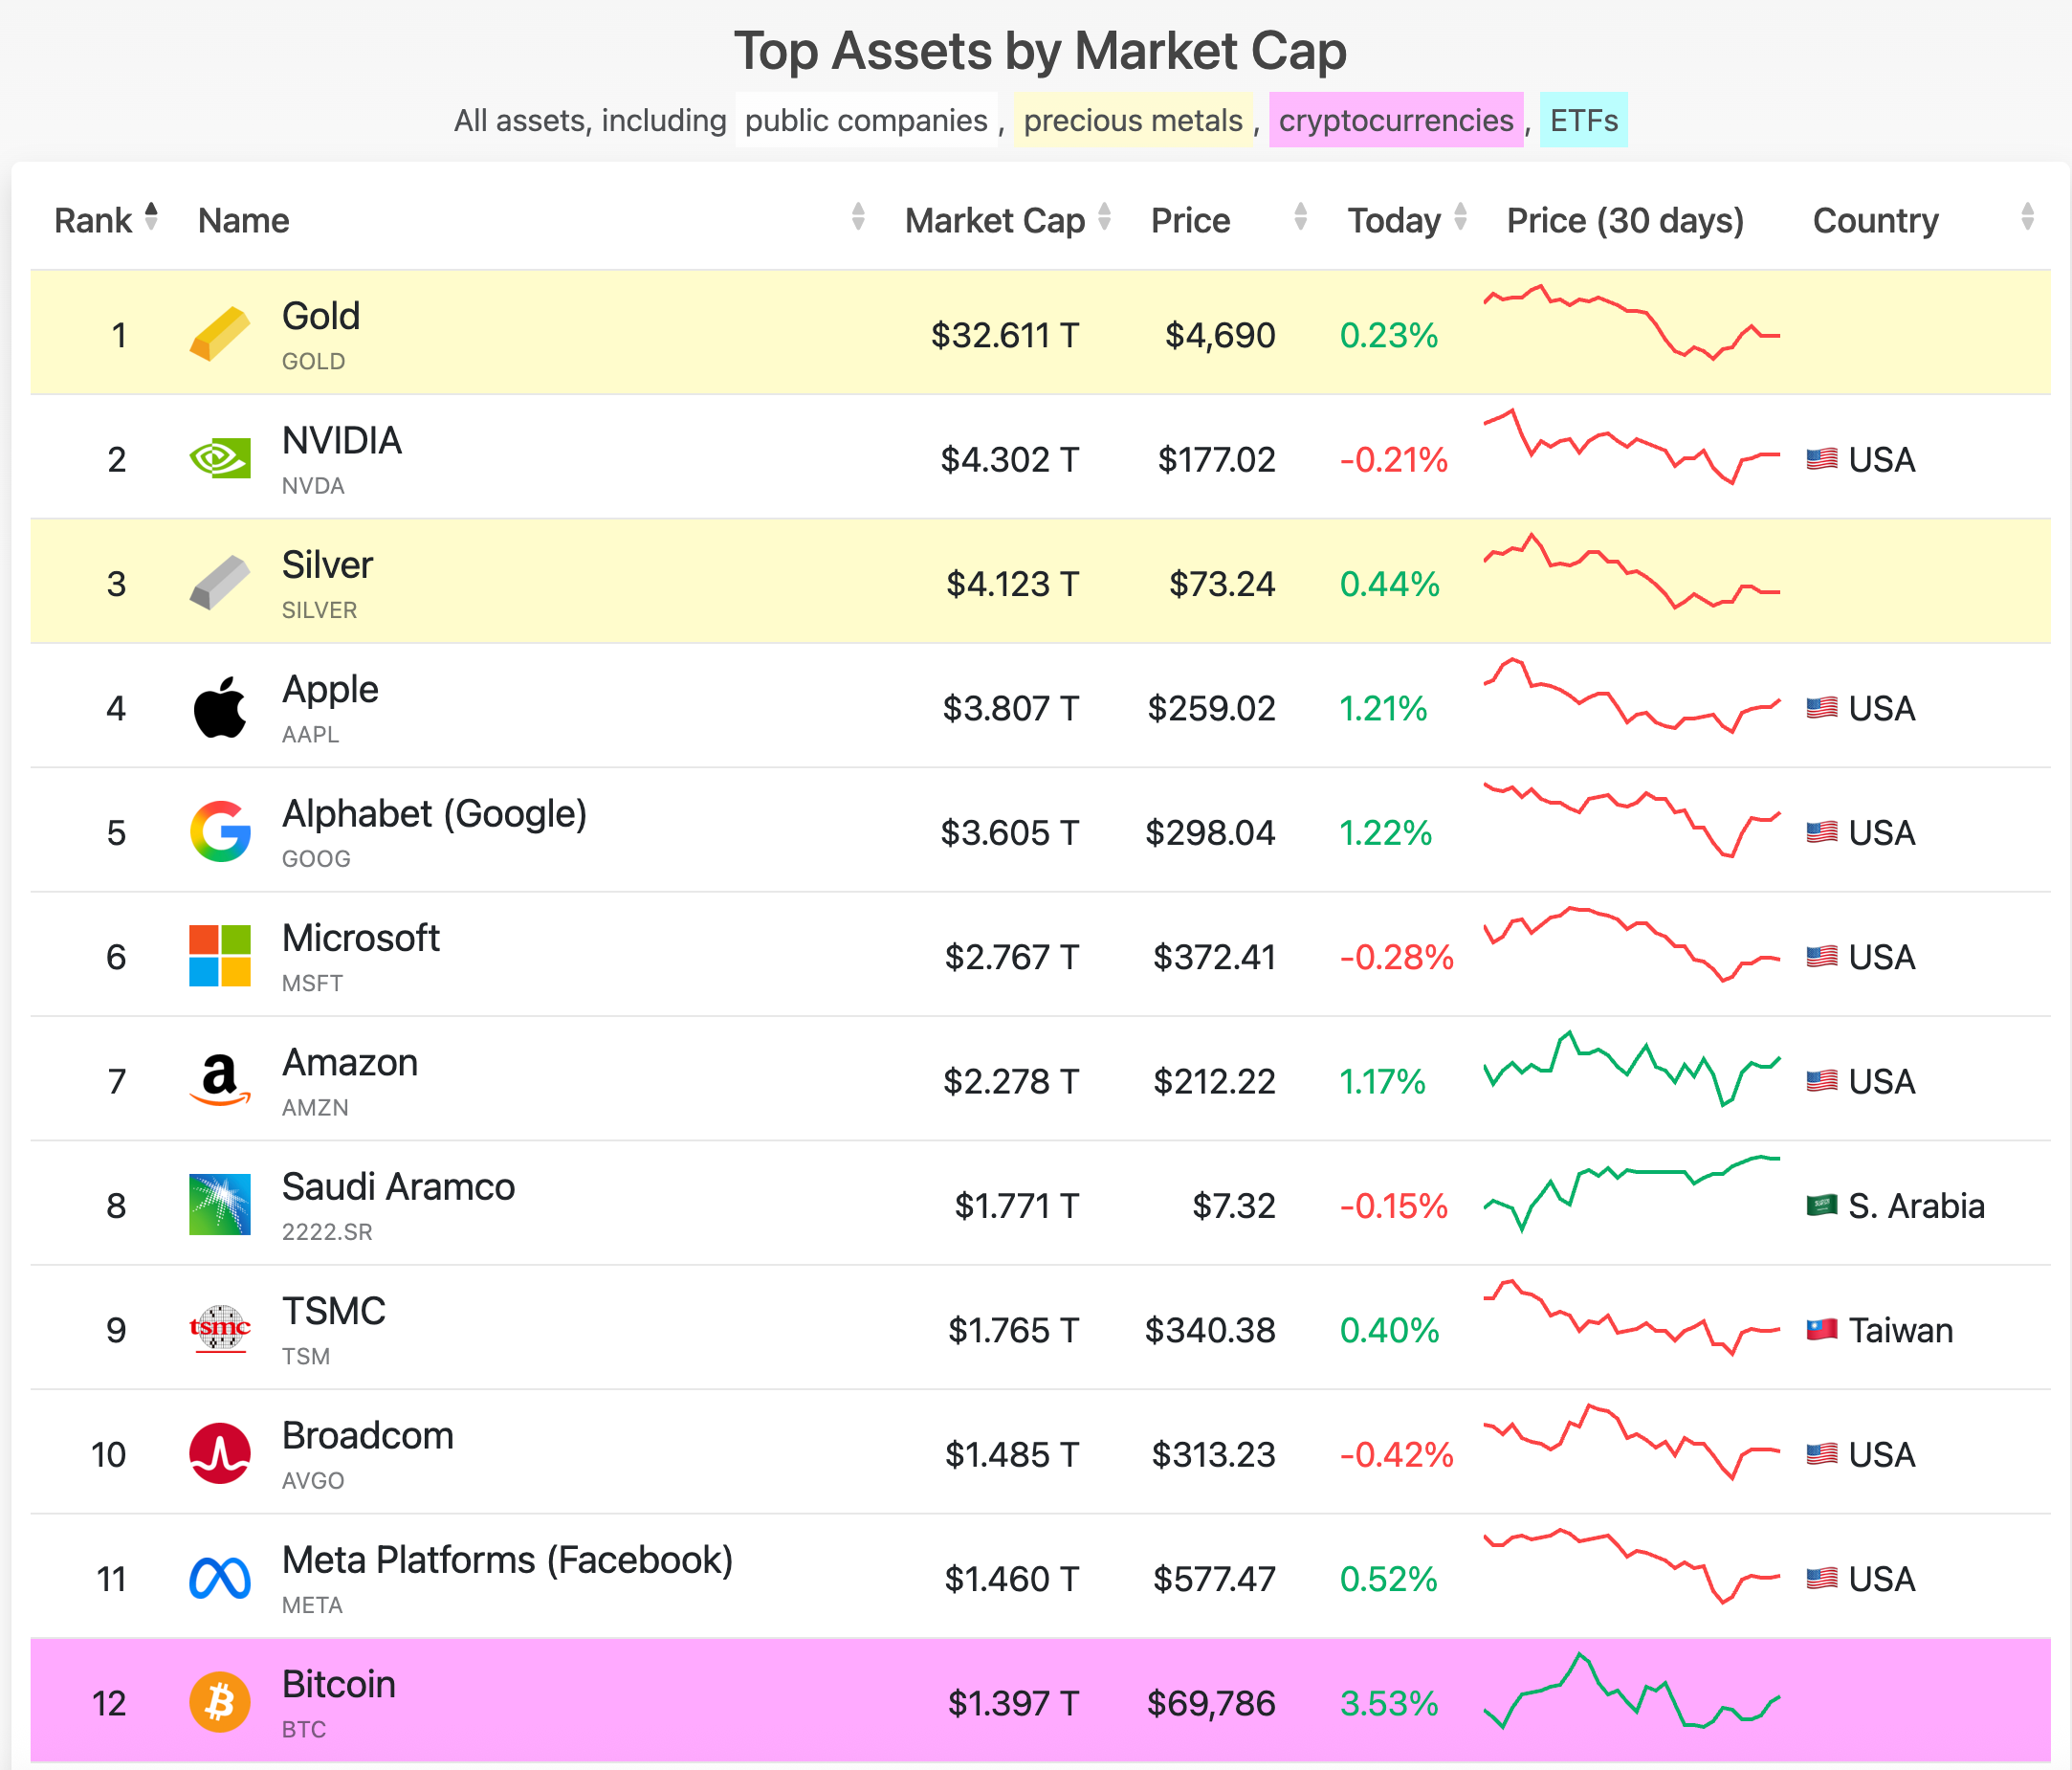
As of April 6, 2026, Bitcoin sits at rank #12 with a market cap of $1.397 trillion and a price of $69,786. The vehicle for the rank reclaim was not a Bitcoin surge, it was equity and precious metal weakness. On a day defined by a macro risk-off event driven by tariff policy, most of the top 15 assets by market cap registered declines: NVIDIA down 0.21%, Microsoft down 0.28%, Broadcom down 0.42%. Bitcoin printed +3.53%, alongside modest gains in Gold (+0.23%) and Silver (+0.44%).
Gold’s market cap has contracted from $36.83 trillion in March to $32.61 trillion currently. Silver moved from $4.95 trillion to $4.12 trillion. Both reflect broad precious metal price weakness over the intervening weeks despite today’s partial recovery. Bitcoin’s market cap is essentially flat over the same period ($1.387T to $1.397T), meaning it held relative value better than either over the past month.
The behavioral data point worth documenting: on a day when global equities sold and traditional safe-haven assets posted mixed performance, Bitcoin moved higher in a meaningful way. Whether this is early structural decoupling from risk assets or a short-term anomaly driven by short covering will require several weeks of confirmation. The rank reclaim from #13 to #12 is, as stated in Issue 12, a function of cycle dynamics. But the correlation behavior on April 6 is worth tracking.
Bitcoin News
Highlights from the month of March
AI Agents Show Strong Preference for Bitcoin Over Fiat, BPI Study Finds
Kraken Secures Federal Reserve Master Account, Marking First Ever for Crypto Firms
Buy a Home With Bitcoin: Coinbase, Fannie Mae Bring Crypto Mortgages to Mainstream Buyers
If you have any suggestions, feel free to reach out to me on X @WillSanchezJr. I’m always looking to improve and add value in ways others might enjoy — just keep it Bitcoin only.
Live free and stack sats,
Will
"The nature of Bitcoin is such that once version 0.1 was released, the core design was set in stone for the rest of its lifetime." - Satoshi Nakamoto
What Is A.W. Block?
A.W. Block is a digital asset estate investigation and advisory firm. We provide technical support for attorneys, probate administrators, and fiduciaries navigating Bitcoin and digital asset estates — asset identification, blockchain investigation, and court-ready documentation.
awblock.io
Found value? Share, subscribe, and/or send sats here: bc1qrlgzu0m94wdrsnxjg8qym7jtnudelgfypmjmaa