


Every four years, half the country decides the other half just voted to destroy the dollar. Then the dollar keeps getting destroyed, at a rate the party in office turns out not to predict, and nobody checks.
I checked. I pulled the Federal Reserve’s money supply series, the Treasury’s debt series, and the BLS price index, lined them up against every inauguration since Nixon closed the gold window on August 15, 1971, and sorted the results by party. The result isn’t that one side is worse. The result is that the question is wrong.
What the Dollar Has Actually Lost
Start with the number everyone argues about and nobody states. By the CPI, a dollar from August 1971 buys 12 cents of goods today. The dollar has lost 87.9% of its purchasing power since the gold window closed. Measure from April 1933, when Roosevelt’s Executive Order 6102 made hoarding gold a federal crime, and the loss is 96.3%. Measure from the Fed’s founding in December 1913 and it’s 97.0%.
Price the dollar in the thing it was supposed to be redeemable for and it gets worse. Gold was $35 an ounce by law in 1971, though the London market was already trading it near $44. The London afternoon fix on October 13, 2026 was $4,169.50. Against gold, the dollar has lost 99.2% of its value in 55 years, and 99.5% since 1933.
Those CPI figures are the published ones, and the method behind them isn’t the 1971 method. Housing switched to rental equivalence in 1983, hedonic quality adjustment spread through the 1990s, and in 1999 BLS adopted a geometric-mean formula it estimated would cut the measured annual rate by about 0.2 percentage points. BLS keeps a separate research series because, as its own page puts it, “historical price index series are not adjusted to reflect the improvements.” I covered that in The Ruler Is Shrinking. The point here is different: whatever the exact number, both parties took turns producing it.
Eleven Presidencies, One Direction
Since the gold window closed there have been six Republican presidents and four Democrats. Eleven presidencies, counting Trump’s two separately. Republicans held the office 31.2 of the 55.2 years. Democrats, 24.0.
Here’s what happened to the broad money supply (M2), the federal debt, and prices under each of them. Money and price figures are the inauguration month’s observation. Debt is Treasury’s daily figure on or just before inauguration day from 2001 on. Before that, when daily data doesn’t exist, it’s the first quarter-end after the inauguration. Growth is annualized so a two-year term and an eight-year term can be compared.
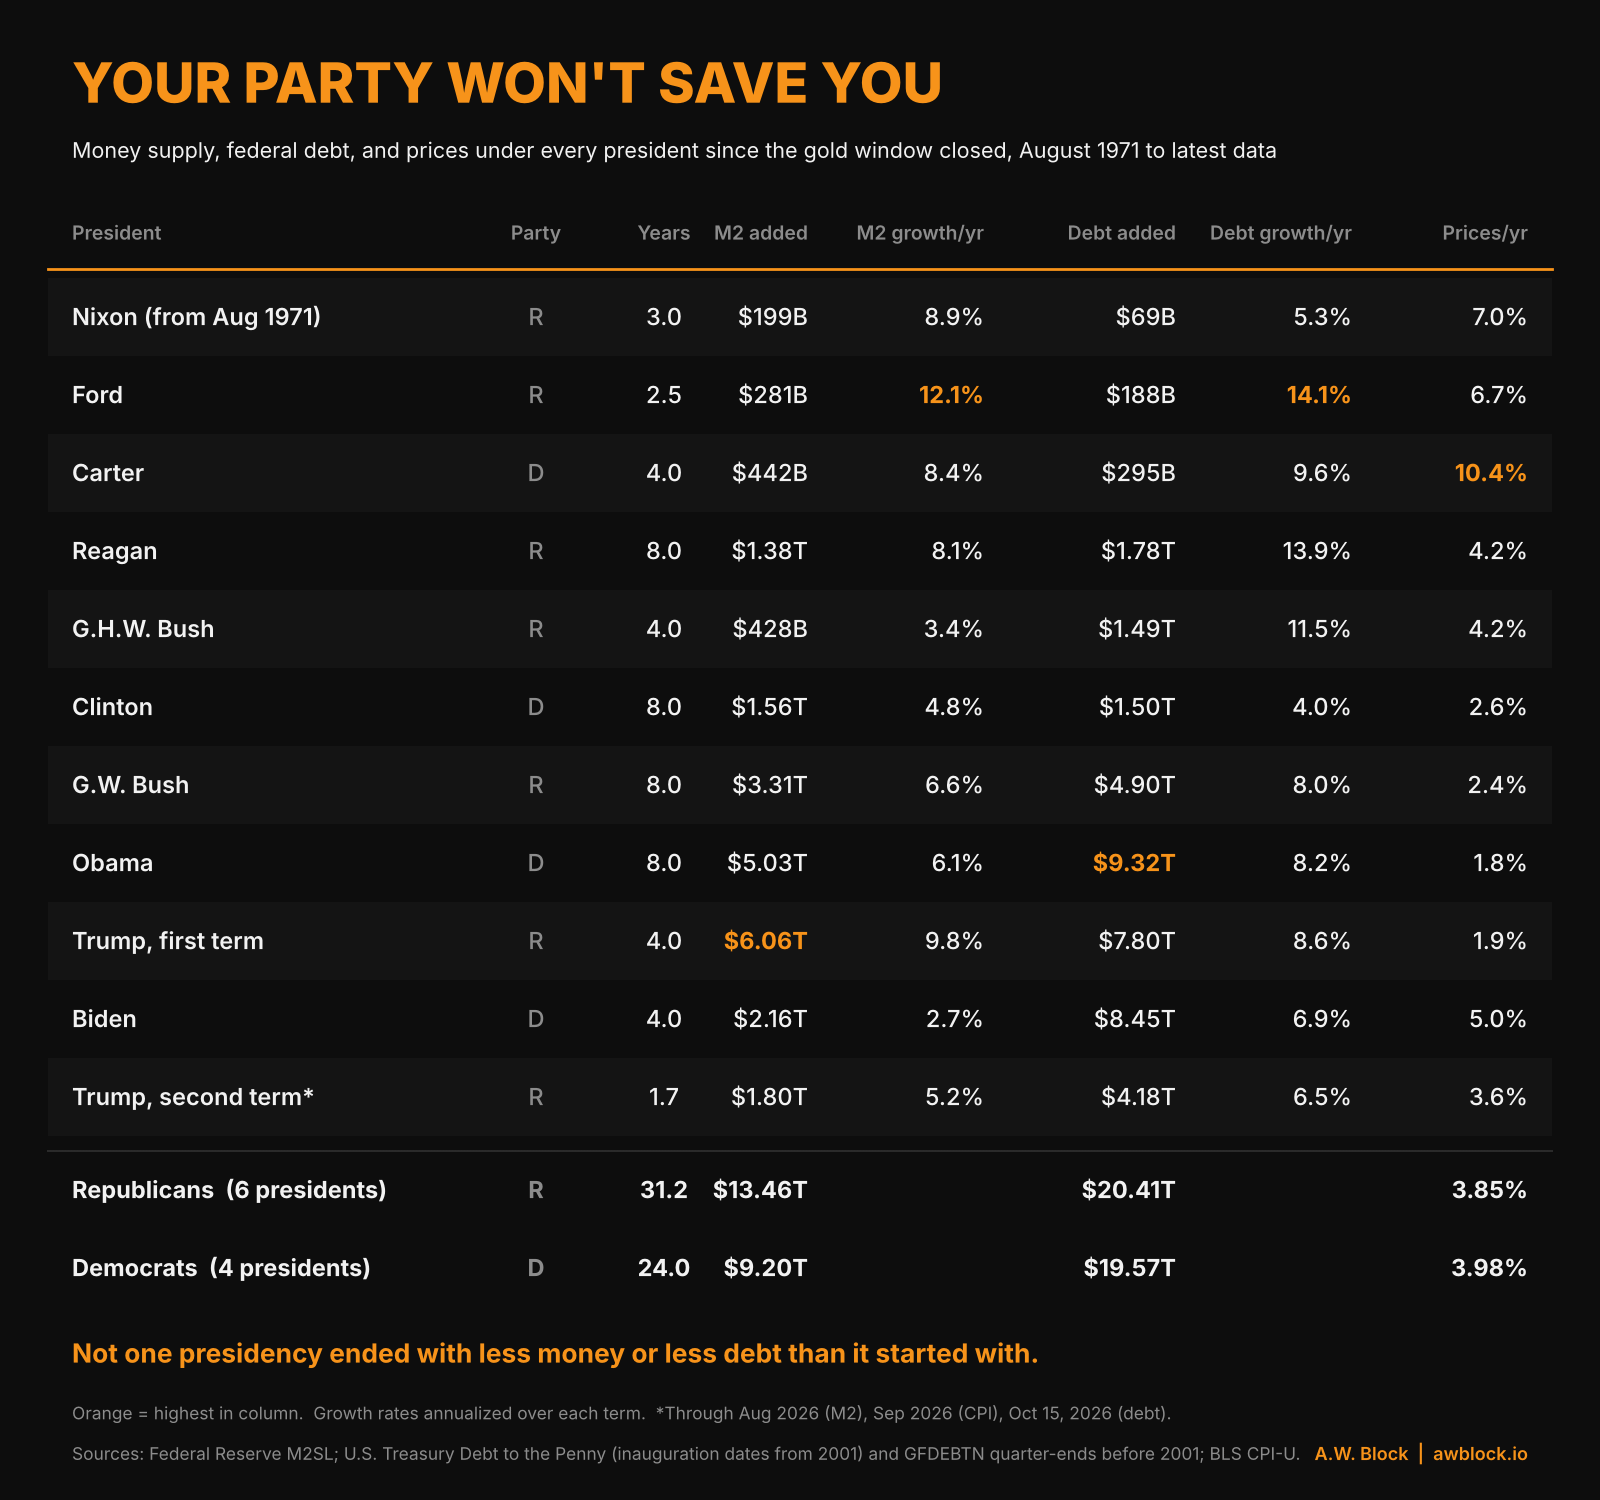
Read down the M2 column and the debt column. Not one negative number. Not one term in 55 years ended with less money in circulation or less debt outstanding than it started with. Control of the White House changed parties eight times. The direction never did.
The Party Totals
Add it up by party and you get the numbers that should end most arguments at Thanksgiving.
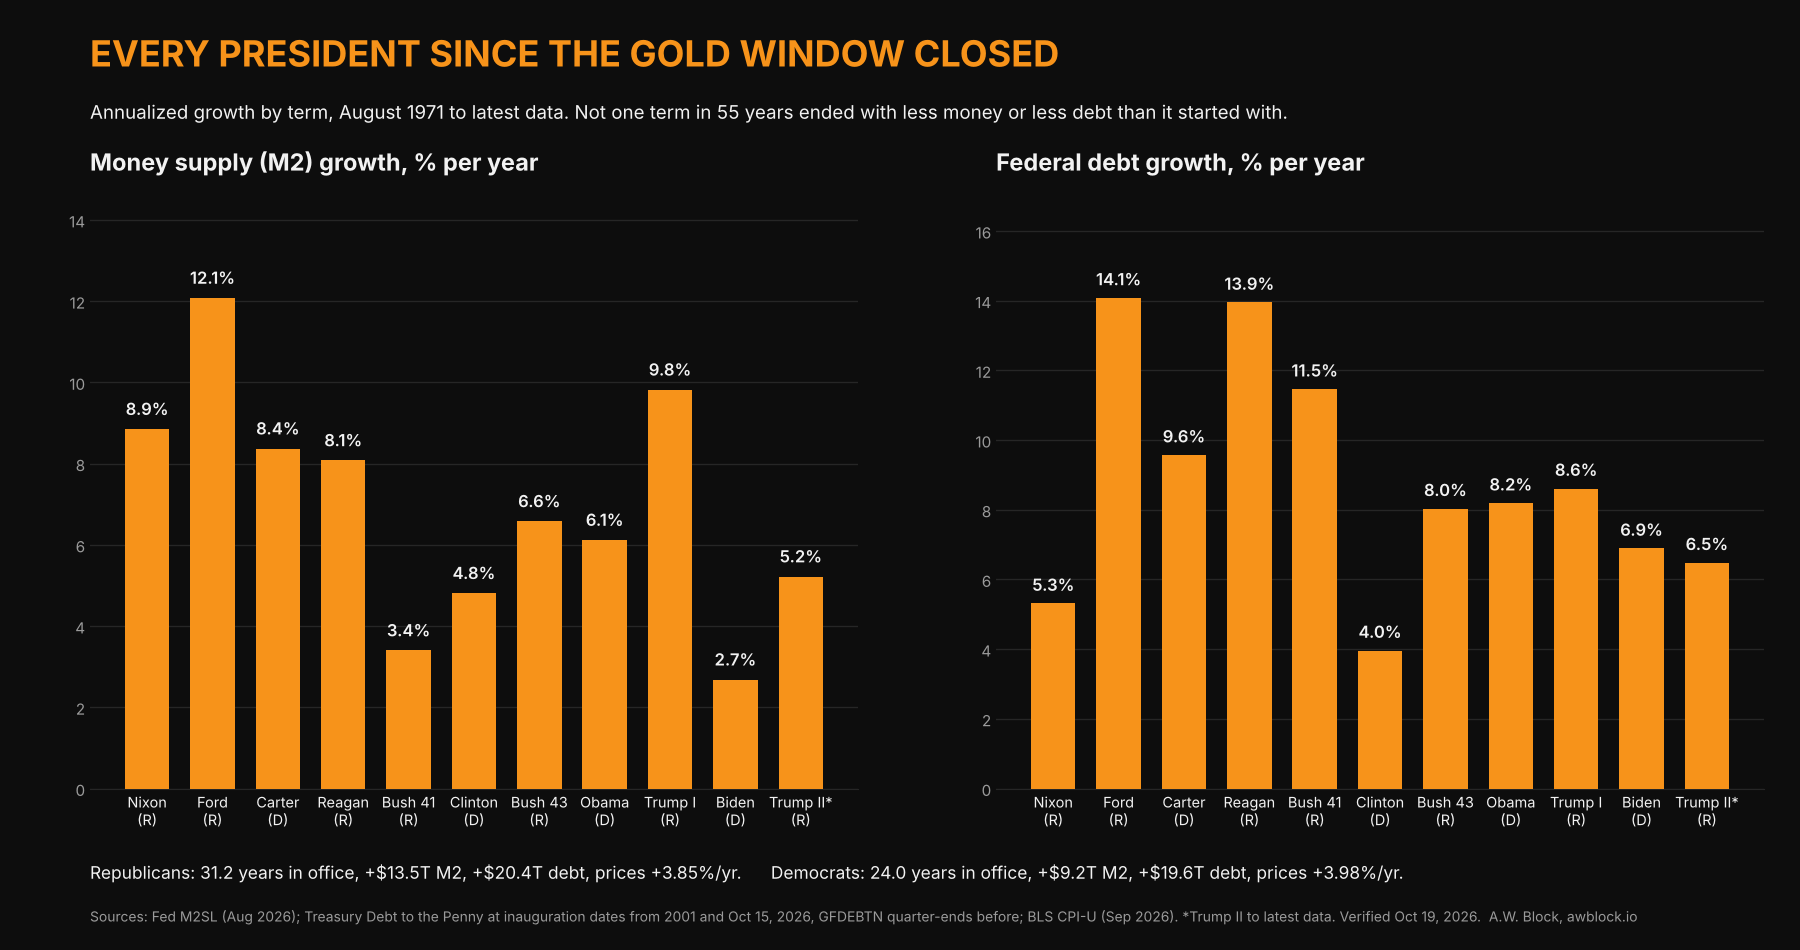
Republicans presided over $13.5 trillion of new M2, 59% of the total since 1971. Democrats presided over $9.2 trillion, 41%. Republicans held office 56.5% of the time. The split tracks their share of the calendar within three points.
On debt it’s 51 to 49, five points off the calendar in the other direction. Republicans added $20.4 trillion. Democrats added $19.6 trillion. Per year in office, Republicans added $432 billion of M2 and $655 billion of debt. Democrats added $383 billion of M2 and $815 billion of debt. Each party wins one column. Neither is in the same zip code as zero.
Then there’s the number that matters to anyone holding dollars: what prices did while each party had the office. Under Republicans, 3.85% a year. Under Democrats, 3.98% a year. The gap is 0.13 percentage points. Compound that over a four-year term and it’s about half of one percent on the price level. That’s the entire difference between the parties on inflation. A rounding error.
The Spikes Are Crises, Not Colors
Look at where money growth peaks. Ford, 12.1% a year, through the recession that ran from November 1973 to March 1975 and the recovery after it. Trump’s first term, 9.8%, about 65% of it between January 2020 and January 2021, when M2 went from $15.4 trillion to $19.4 trillion. Nixon, 8.9%, in the price-control years right after the gold window. Carter, 8.4%. Reagan, 8.1%. Three Republicans, a Democrat, and another Republican, and not one of them ran on it. The money was created in response to events, by a central bank and a banking system that don’t stand for election, and whoever was in the Oval Office got the credit or the blame.
The biggest dollar additions are recent and bipartisan. Trump’s first term added $6.06 trillion of M2 in four years, more than any presidency in the series. Obama added $5.03 trillion in eight. On debt: Obama $9.32 trillion in eight years, Biden $8.45 trillion in four, Trump $7.80 trillion in four. The current term has added $4.18 trillion in 21 months. That’s $2.4 trillion a year, a higher term-average pace than any in the series. Biden’s term ran $2.1 trillion a year. Trump’s first, with 2020 inside it, ran $2.0 trillion.
The labels don’t predict the numbers. Reagan, the fiscal conservative, nearly tripled the federal debt, 2.84 times in eight years, the fastest debt growth of any full term. Clinton, the Democrat, had the slowest at 4% a year, and gross debt still rose $1.5 trillion over his two terms. It rose across each of the four surplus fiscal years too, because the trust funds kept accumulating Treasuries. Biden’s M2 growth rate is the lowest in the table because the money supply fell in 2022 and again in 2023, the only two calendar-year declines since the series began in 1959. Prices still rose 21% over his term, because most of the money driving them was created in 2020 and 2021. That lag between creation and consequence is exactly why sorting by president misleads in both directions.
What the Money Did to What You Save For
Headline inflation is the gentlest way to measure this. From 1971 to 2025, median household income rose 9.7 times, from $9,030 to $87,460. Over the same stretch the CPI rose about 8 times. Real median income is up roughly a fifth in 54 years. About 0.4% a year. Now look at what people actually try to save into, measured to the latest data. The median new home rose 16.2 times, from $25,300 to $410,700. The money supply rose 34 times. The federal debt rose 98 times.
A new house cost 2.8 years of median income in 1971. It costs 4.7 years today. Houses did get bigger: the median new house completed was 1,525 square feet in 1973, the first year Census measured it, and 2,105 in the second quarter of 2026. Price it per square foot against median income and a new house still costs about a fifth more of a year’s pay than it did in 1971. Part of the ratio is a bigger house. The rest is a shrinking unit of account and an asset running ahead of the paycheck. That gap, between what wages buy at the grocery store and what they buy in the asset market, is the debasement. It shows up in no inflation release, and it’s why a family earning 9.7 times what their grandparents earned feels poorer.
One more. The federal minimum wage was $1.60 in 1971, set in February 1968 and not raised again until May 1974. That’s $13.21 in today’s dollars. It’s $7.25 today, unchanged since July 2009. That’s 88 cents in 1971 dollars. Fifty-five years of both parties, and the floor is lower in real terms than when they started.
Why Neither Party Stops It
The honest objection to all of this is that presidents don’t create money. The objection is correct. The Federal Reserve sets the monetary base and the price of credit. Commercial banks create most of what counts as M2 when they lend. The base is $5.4 trillion and M2 is $23.3 trillion, so the banking system carries more than four dollars of money for every dollar the Fed created. Congress passes the budgets Treasury borrows to cover. The president signs what reaches his desk and nominates a Fed chair every four years.
That’s the point, not a flaw in the method. The lever isn’t in the Oval Office. It’s spread across a central bank, a banking system, and a legislature, and every actor in that chain faces the same incentive regardless of party. Expanding gets rewarded now. Contracting gets punished now. The bill for expanding shows up later and lands on whoever’s in office then.
Ammous makes the structural argument in The Fiat Standard: after a century of fiat, a consensus formed among academics and policymakers that monetary contraction must be prevented at all costs, and that consensus guarantees the next expansion. He also notes the United States had the second-slowest money growth of 167 countries from 1960 to 2020, at 7.4% a year. One of the two best-behaved fiat currencies on earth still lost 88% of its value since 1971. Alden, in Broken Money, writes that the past fifty years, in which “United States, the Empire” grew while “United States, the Country” stagnated, were “largely a bipartisan phenomenon.” She describes the 1934 revaluation as a debt default carried out by redefining the dollar itself, and cites Reinhart and Sbrancia’s finding that governments liquidate debt through financial repression, a tax on savers paid in below-market real interest rates. Champagne, in The Book of Satoshi, lays out the three ways a government funds a deficit, taxes, borrowing, or inflation, and why governments tend to favor the third: it lets them blame the price increases on speculators.
Both parties built this. Roosevelt ordered gold turned in under threat of ten years in prison, and Nixon cut the dollar loose from it. Bush and Obama ran the 2008 rescue. Trump and Biden ran the pandemic ones. Every tool in the kit was assembled with both hands, and every election since 1971 has been a referendum on who holds the handle. Never on whether the tool should exist.
The Ballot That Counts
I’m not telling you not to vote. I’m telling you the vote that decides your purchasing power isn’t the one you cast in November. It’s the one you cast every payday, when you decide which money to hold your savings in.
Every unit of account in the table above is controlled by people whose incentive is to make more of it. There’s one asset whose supply schedule no president, party, or central bank gets a vote on. Twenty-one million, fixed in the code, verifiable by anyone willing to run the software and check. That’s not a political position. It’s the only exit from a system where both sides agree completely on the one thing that matters to your savings.
Fifty-five years of data say the next administration won’t fix this, whoever wins. The same data says you don’t have to wait for them.
“Fascism, socialism, or Bitcoin. Those are our choices.”
— Ansel Lindner
Sources: Federal Reserve Board, H.6 Money Stock Measures, M2SL, August 2026 observation released September 22, 2026; Federal Reserve Board, Monetary Base, BOGMBASE; Federal Reserve H.4.1 Total Assets, WALCL; U.S. Treasury, Total Public Debt, GFDEBTN (quarterly, end of period, used for boundaries before 2001) and Fiscal Data Debt to the Penny (inauguration dates from 2001 and October 15, 2026, $40.388 trillion); Bureau of Labor Statistics, Consumer Price Index September 2026, released October 14, 2026, all-items NSA index 336.940 and historical CPIAUCNS; U.S. Census Bureau, P60-84 (median household income 1971, $9,030) and release CB26-151 (median household income 2025, $87,460); Census/HUD Median Sales Price of New Houses Sold, MSPUS; Census, Median Square Feet of Floor Area, New One-Family Houses Completed (FRED COMPSFLAM1FQ, Q2 2026: 2,105) and Characteristics of New Housing (1973: 1,525); U.S. Department of Labor, History of Federal Minimum Wage Rates; LBMA PM gold fix, October 13, 2026, $4,169.50; NBER Business Cycle Dating Committee; Federal Reserve H.6 Technical Q&A on the 2020 M1 reclassification; Ammous, The Fiat Standard; Alden, Broken Money; Champagne, The Book of Satoshi; Executive Order 6102 (April 5, 1933); Gold Reserve Act (January 30, 1934); Public Law 93-373 (August 14, 1974); Nixon address of August 15, 1971. All series accessed via FRED and the Treasury Fiscal Data API on October 19, 2026.
What Is A.W. Block?
A.W. Block is a digital asset estate investigation and Bitcoin advisory firm. On the estate side, we support attorneys, probate administrators, and fiduciaries with asset identification, blockchain investigation, and court-ready documentation. On the advisory side, we work with individuals and institutions on Bitcoin custody, accumulation strategy, and education.
awblock.io
Found value? Share, subscribe, and/or send sats here: bc1qrlgzu0m94wdrsnxjg8qym7jtnudelgfypmjmaa