

Around the Block | 11
Bitcoin‑Only Macro & Technical Recap

Bitcoin has moved from digestion into decision.
What began as a controlled post-expansion correction has now progressed into a direct test of the cycle’s structural integrity. Monthly price action has carried Bitcoin into rising mid-trend support, weekly structure is pressing the final higher-low that defines the bull market, and short-term momentum has turned decisively bearish. This is no longer about whether Bitcoin is correcting. It is about where that correction resolves.
At the same time, the foundation beneath price remains intact. Hashrate, while cooling from cycle highs, continues to trend structurally higher. Miners are under renewed margin pressure, but capitulation remains absent. Bitcoin’s market capitalization has rotated lower relative to global peers, yet it remains firmly within the trillion-dollar asset class, reinforcing its maturity rather than undermining its relevance.
This issue breaks down that tension. We examine Bitcoin’s position across the monthly and weekly timeframes as it tests critical support, assess the ongoing mean reversion against gold, and evaluate whether network fundamentals are confirming stress or resilience. As always, this is Bitcoin-only analysis focused on structure, probability, and context. No narratives. No noise.
None of this is financial advice.
Don’t trust, verify.
Let’s dive in.
TL;DR
Bitcoin is deep into a mid-cycle correction, with monthly price now testing the rising 34 EMA near 75K, a historically important equilibrium level.
Weekly structure has broken below prior demand and is pressing the final macro higher-low at 73K–75K; the bull structure remains intact unless this level fails on a weekly close.
Short- and mid-term momentum are firmly bearish, but downside appears late-stage rather than early, increasing the importance of support response over continuation.
BTC/Gold is undergoing mean reversion, with gold leading short term while Bitcoin’s long-term relative structure remains intact above the 200 MA.
Hashrate has cooled from cycle highs but remains structurally elevated, signaling consolidation rather than miner capitulation.
Mining costs have fallen, but price has fallen faster, intensifying margin pressure without triggering network stress.
Bitcoin’s market cap has rotated out of the top ten but remains above $1.5T, consistent with historical mid-cycle drawdowns rather than loss of structural relevance.
The Technicals
Monthly
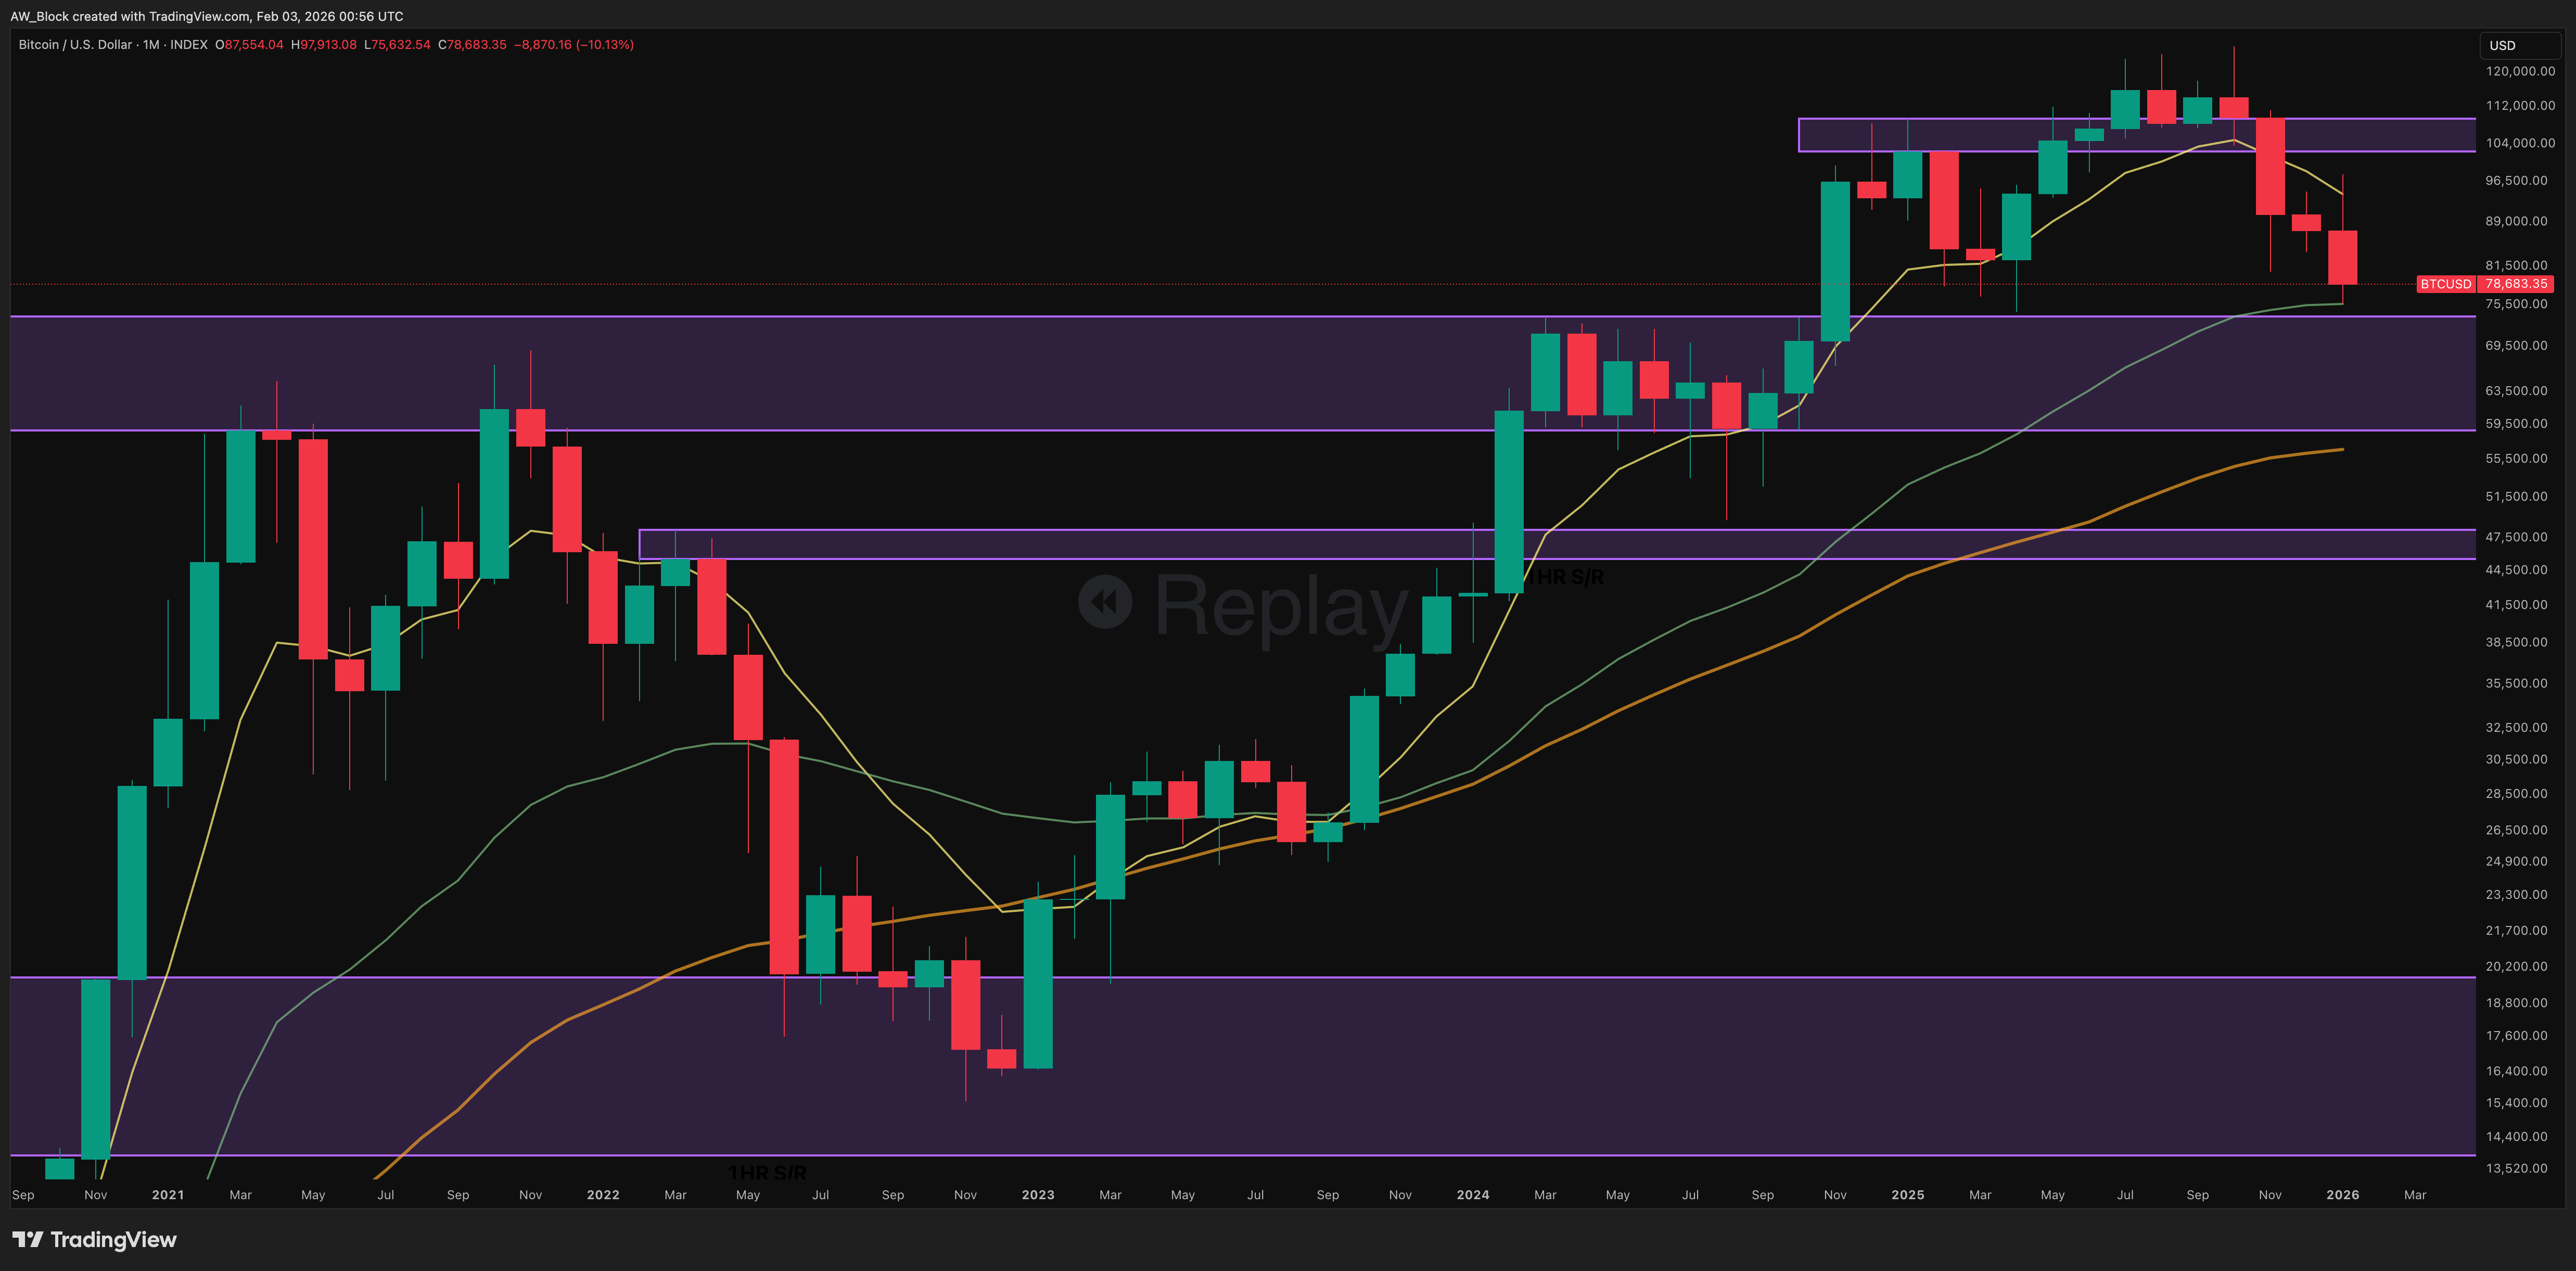
Bitcoin’s monthly structure has moved decisively into a corrective, mean-reversion phase following the failed expansion above the 121K–125K region. As of February 2026, price is trading near $78.7K, extending the downside sequence and pressing directly into a major structural demand zone.
This month’s developing candle carries a large bearish body, reflecting continued seller control, but the location now matters more than the direction. Price is now interacting with the rising 34 EMA near 75K, a level that has historically defined equilibrium during prior mid-cycle corrections.
Key Monthly Levels
• 102K–109K: Former support turned resistance and origin of the rejection
• 59K–74K: Final demand before deeper mean reversion
• 34 EMA (~75K): Rising mid-trend equilibrium and primary support reference
• 50 MA (~56K): Long-term structural trend anchor
Structure
The monthly sequence now reflects a textbook corrective leg within a secular uptrend. The market has completed a failed retest of former support, confirmed a breakdown through the mid-zone, and followed through toward rising trend support. Importantly, this behavior is proportional to the magnitude of the prior expansion and does not constitute a trend failure.
Higher-timeframe structure remains intact as long as price holds above the 70K–72K region on a monthly closing basis.
Candlestick Behavior
Recent monthly candles continue to show bearish continuation with expanding real bodies, confirming persistent selling pressure. However, early signs of balance are beginning to emerge:
• Lower wicks are appearing as price approaches the 34 EMA
• Selling remains orderly rather than climactic
From a Nison perspective, this reflects de-risking and profit-taking after a strong cycle advance, not panic or forced liquidation. The market is transitioning from trend to equilibrium.
Pattern Context
The post-high structure resembles a descending consolidation now entering its later stages. With price reaching the measured downside region aligned with rising trend support, pattern risk is diminishing rather than increasing. Bulkowski’s work supports stabilization once failed ranges resolve into rising averages, particularly within primary uptrends.
Trend and Moving Averages
• The 8 EMA is lost and declining, confirming the corrective regime
• The 34 EMA is rising and now under direct test, acting as the key decision point
• The 50 MA continues to rise, reinforcing intact macro structure
Trend state is best described as correction approaching equilibrium, not reversal.
Weekly
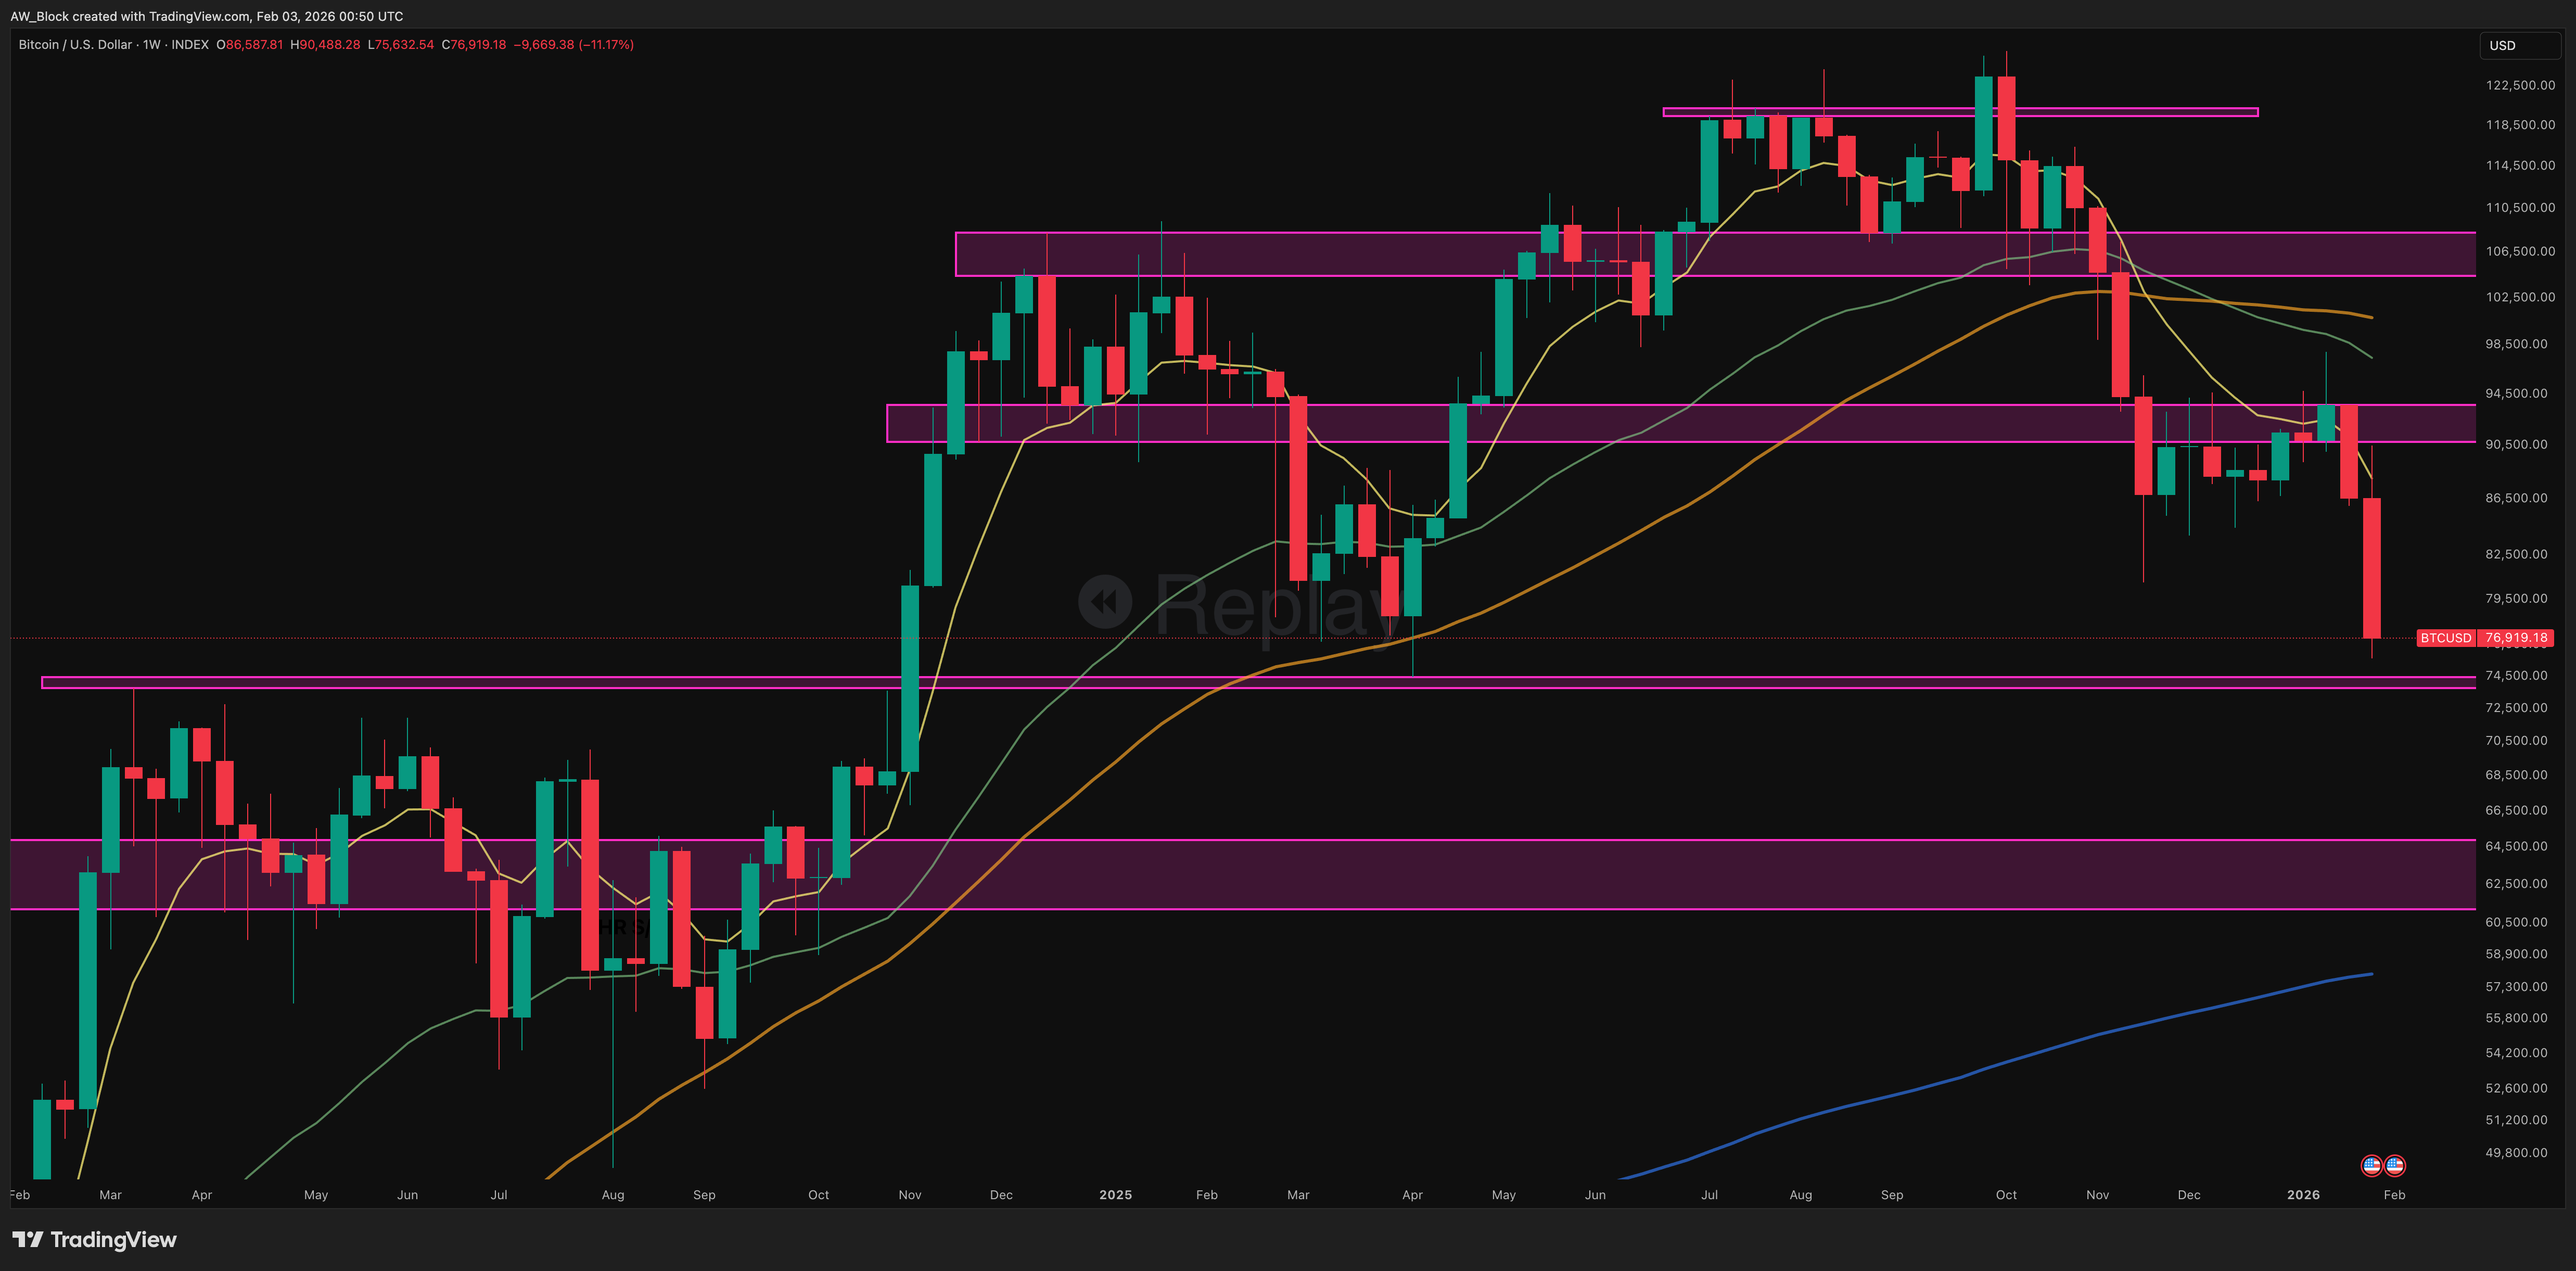
Bitcoin closed the week near $77,000, printing a wide-range bearish expansion that pushed price decisively lower and shifted the weekly structure into a true structural test phase.
This was not a drift lower. It was a momentum-driven move that carried price through former demand and accelerated the corrective sequence that began after the failed expansion above cycle highs.
Key Weekly Levels
• $121K–$125K: Cycle high and distribution ceiling
• $104K–$108K: Failed reaccumulation zone
• $91K–$94K: Former demand, now decisively lost
• $73K–$75K: Macro higher-low and structural line in the sand
The loss of the $91K–$94K zone confirms that this is no longer a shallow retracement. Bitcoin is now unwinding toward the last confirmed weekly higher-low, which continues to anchor the broader bull market structure.
Structure
Price is accelerating into the $73K–$75K region, the most important level on the weekly chart. That level has not yet been broken, and until it is, the macro bull structure technically remains intact.
Everything between $90K and $73K represents corrective unwinding, not a confirmed trend reversal. This behavior is consistent with classical post-distribution market structure following failed range expansions.
Candlestick Behavior
The latest weekly candle is a large bearish continuation bar with minimal lower wick. From a Nison perspective:
• This is not a hammer, doji, or reversal signal
• Selling pressure dominated the entire week
• No meaningful rejection has occurred yet
This type of candle typically appears in the late stages of a corrective leg, often preceding a reaction low rather than marking capitulation itself. Reversal conditions would require either a strong lower-wick rejection or evidence of multi-week basing near support. Neither has appeared so far.
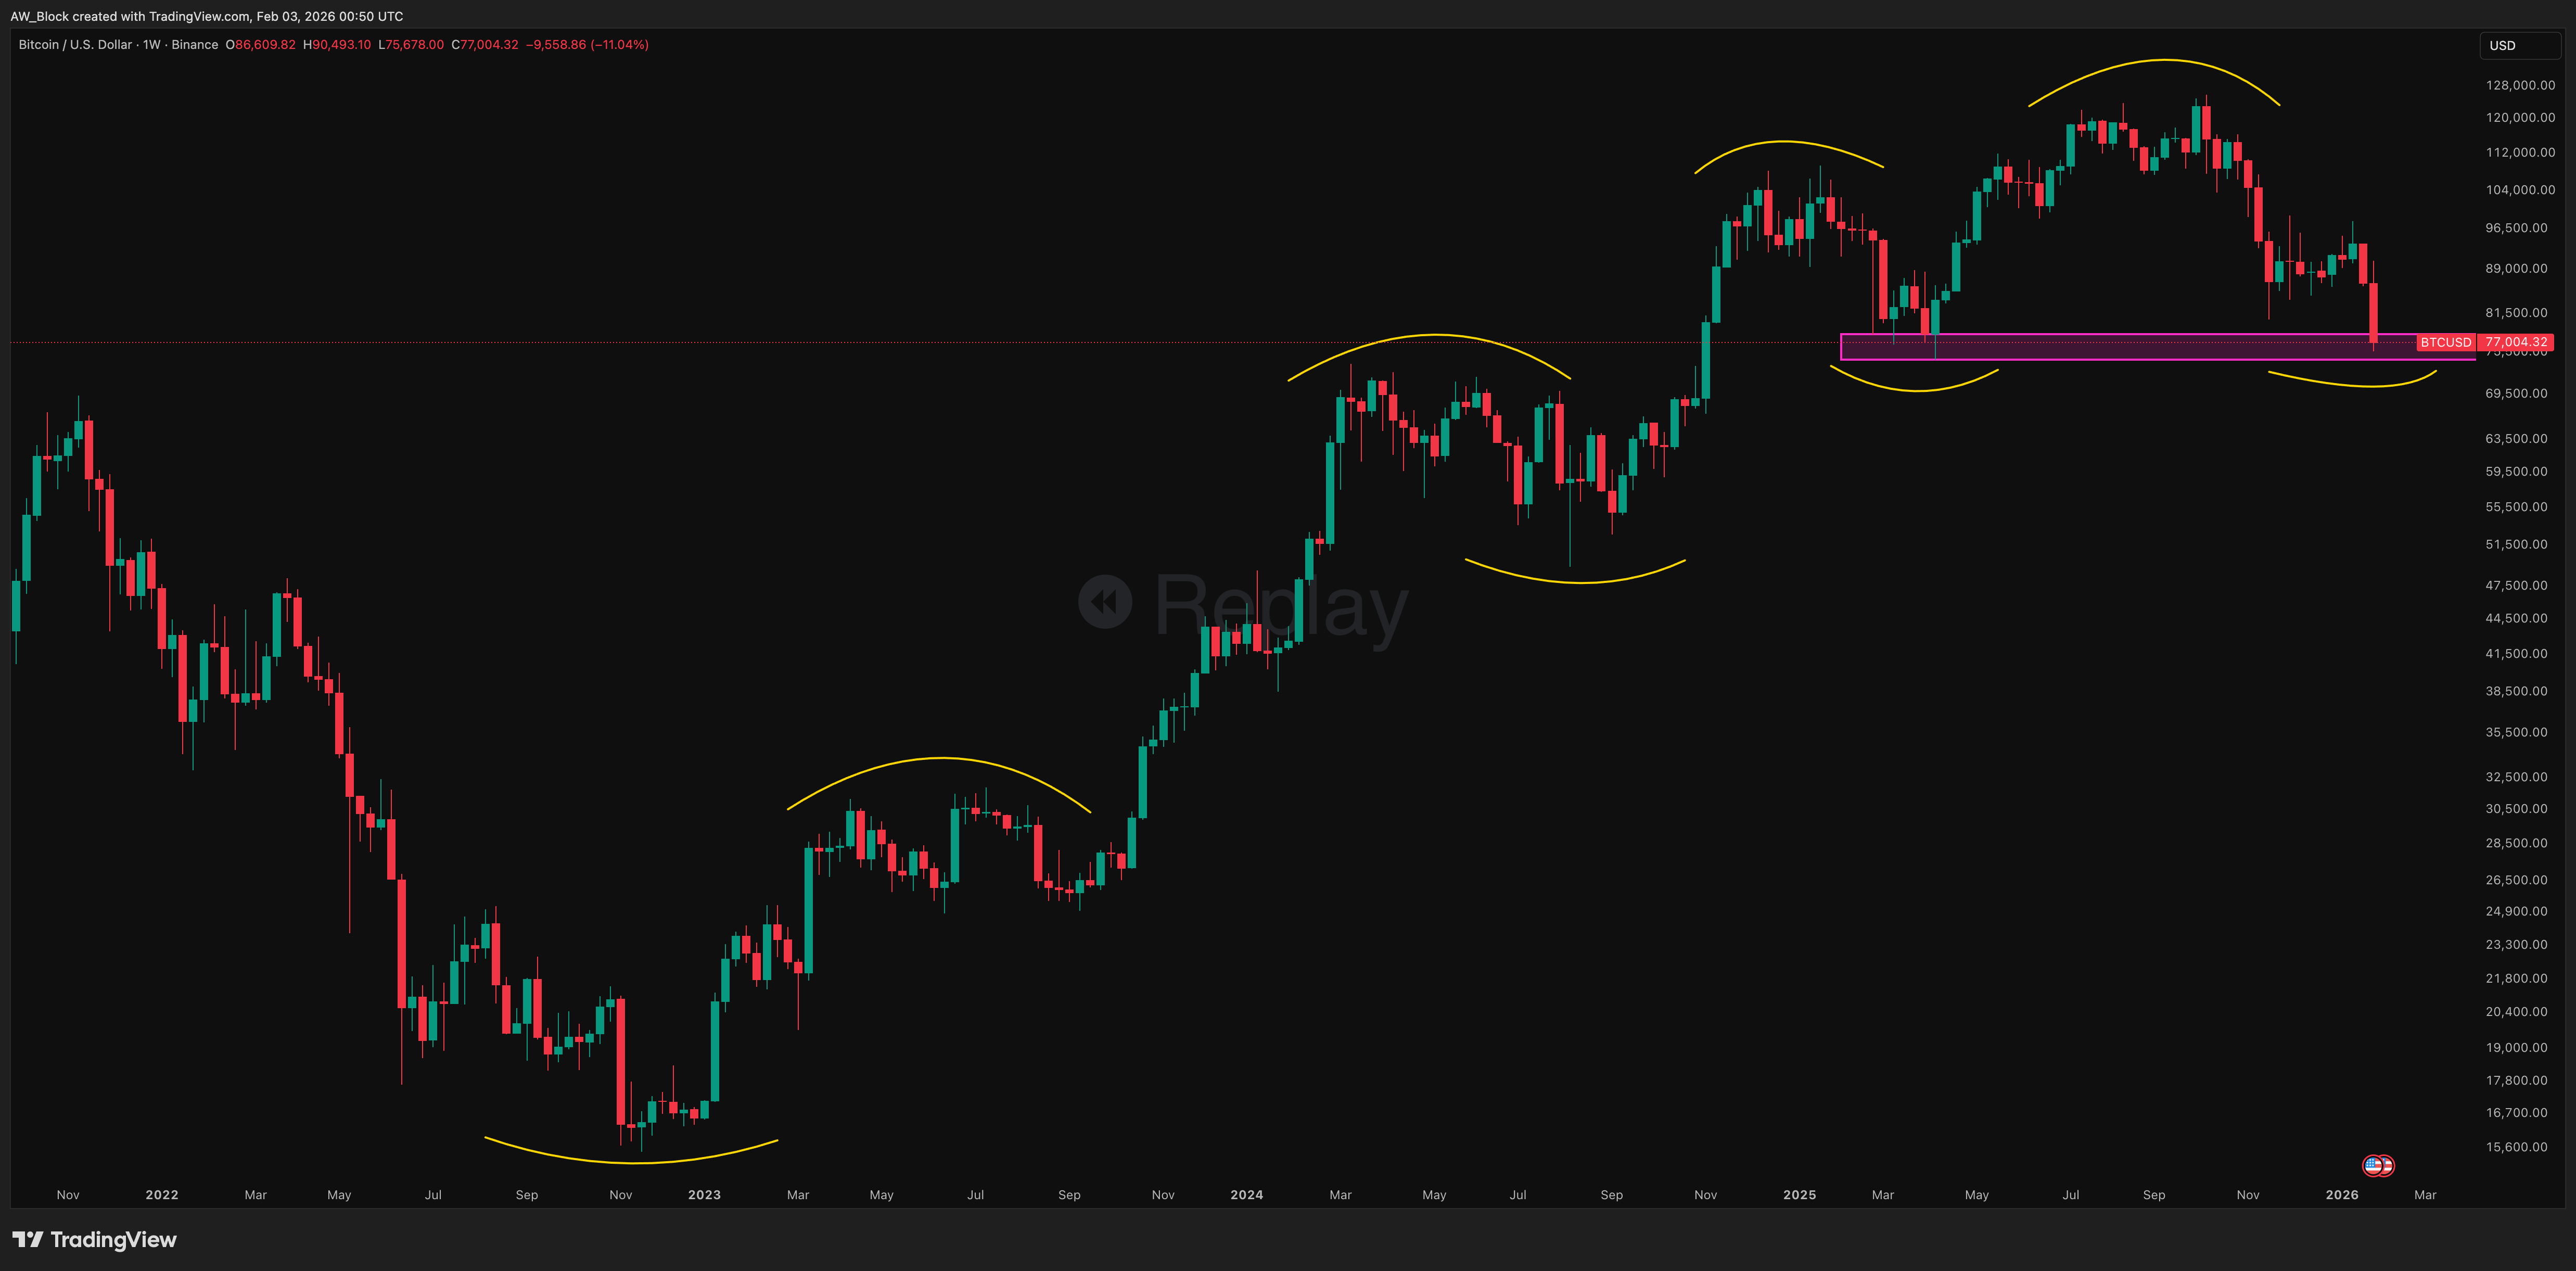
Pattern Context
The broader structure reflects a sequence of distribution resolving lower into a descending corrective channel. Bulkowski’s statistics show that failed continuation ranges inside bull markets commonly retrace 20–35% before stabilizing. Bitcoin is now approaching the upper end of that historical window.
Importantly, the longer-term structure still fits a cyclical correction, not a secular top.
Trend and Moving Averages
• 8 EMA: Lost and accelerating downward
• 34 EMA: Rolling over, confirming mid-trend momentum loss
• 50 MA: Now overhead, no longer supportive
• 200 MA: Rising well below price, macro trend intact
Short- and mid-term trends are firmly bearish, while the long-term trend remains structurally bullish. With that being said, it is now testing the integrity of its macro bull structure.
That structure still exists until ~$74K fails on a weekly close.
Bitcoin / Gold
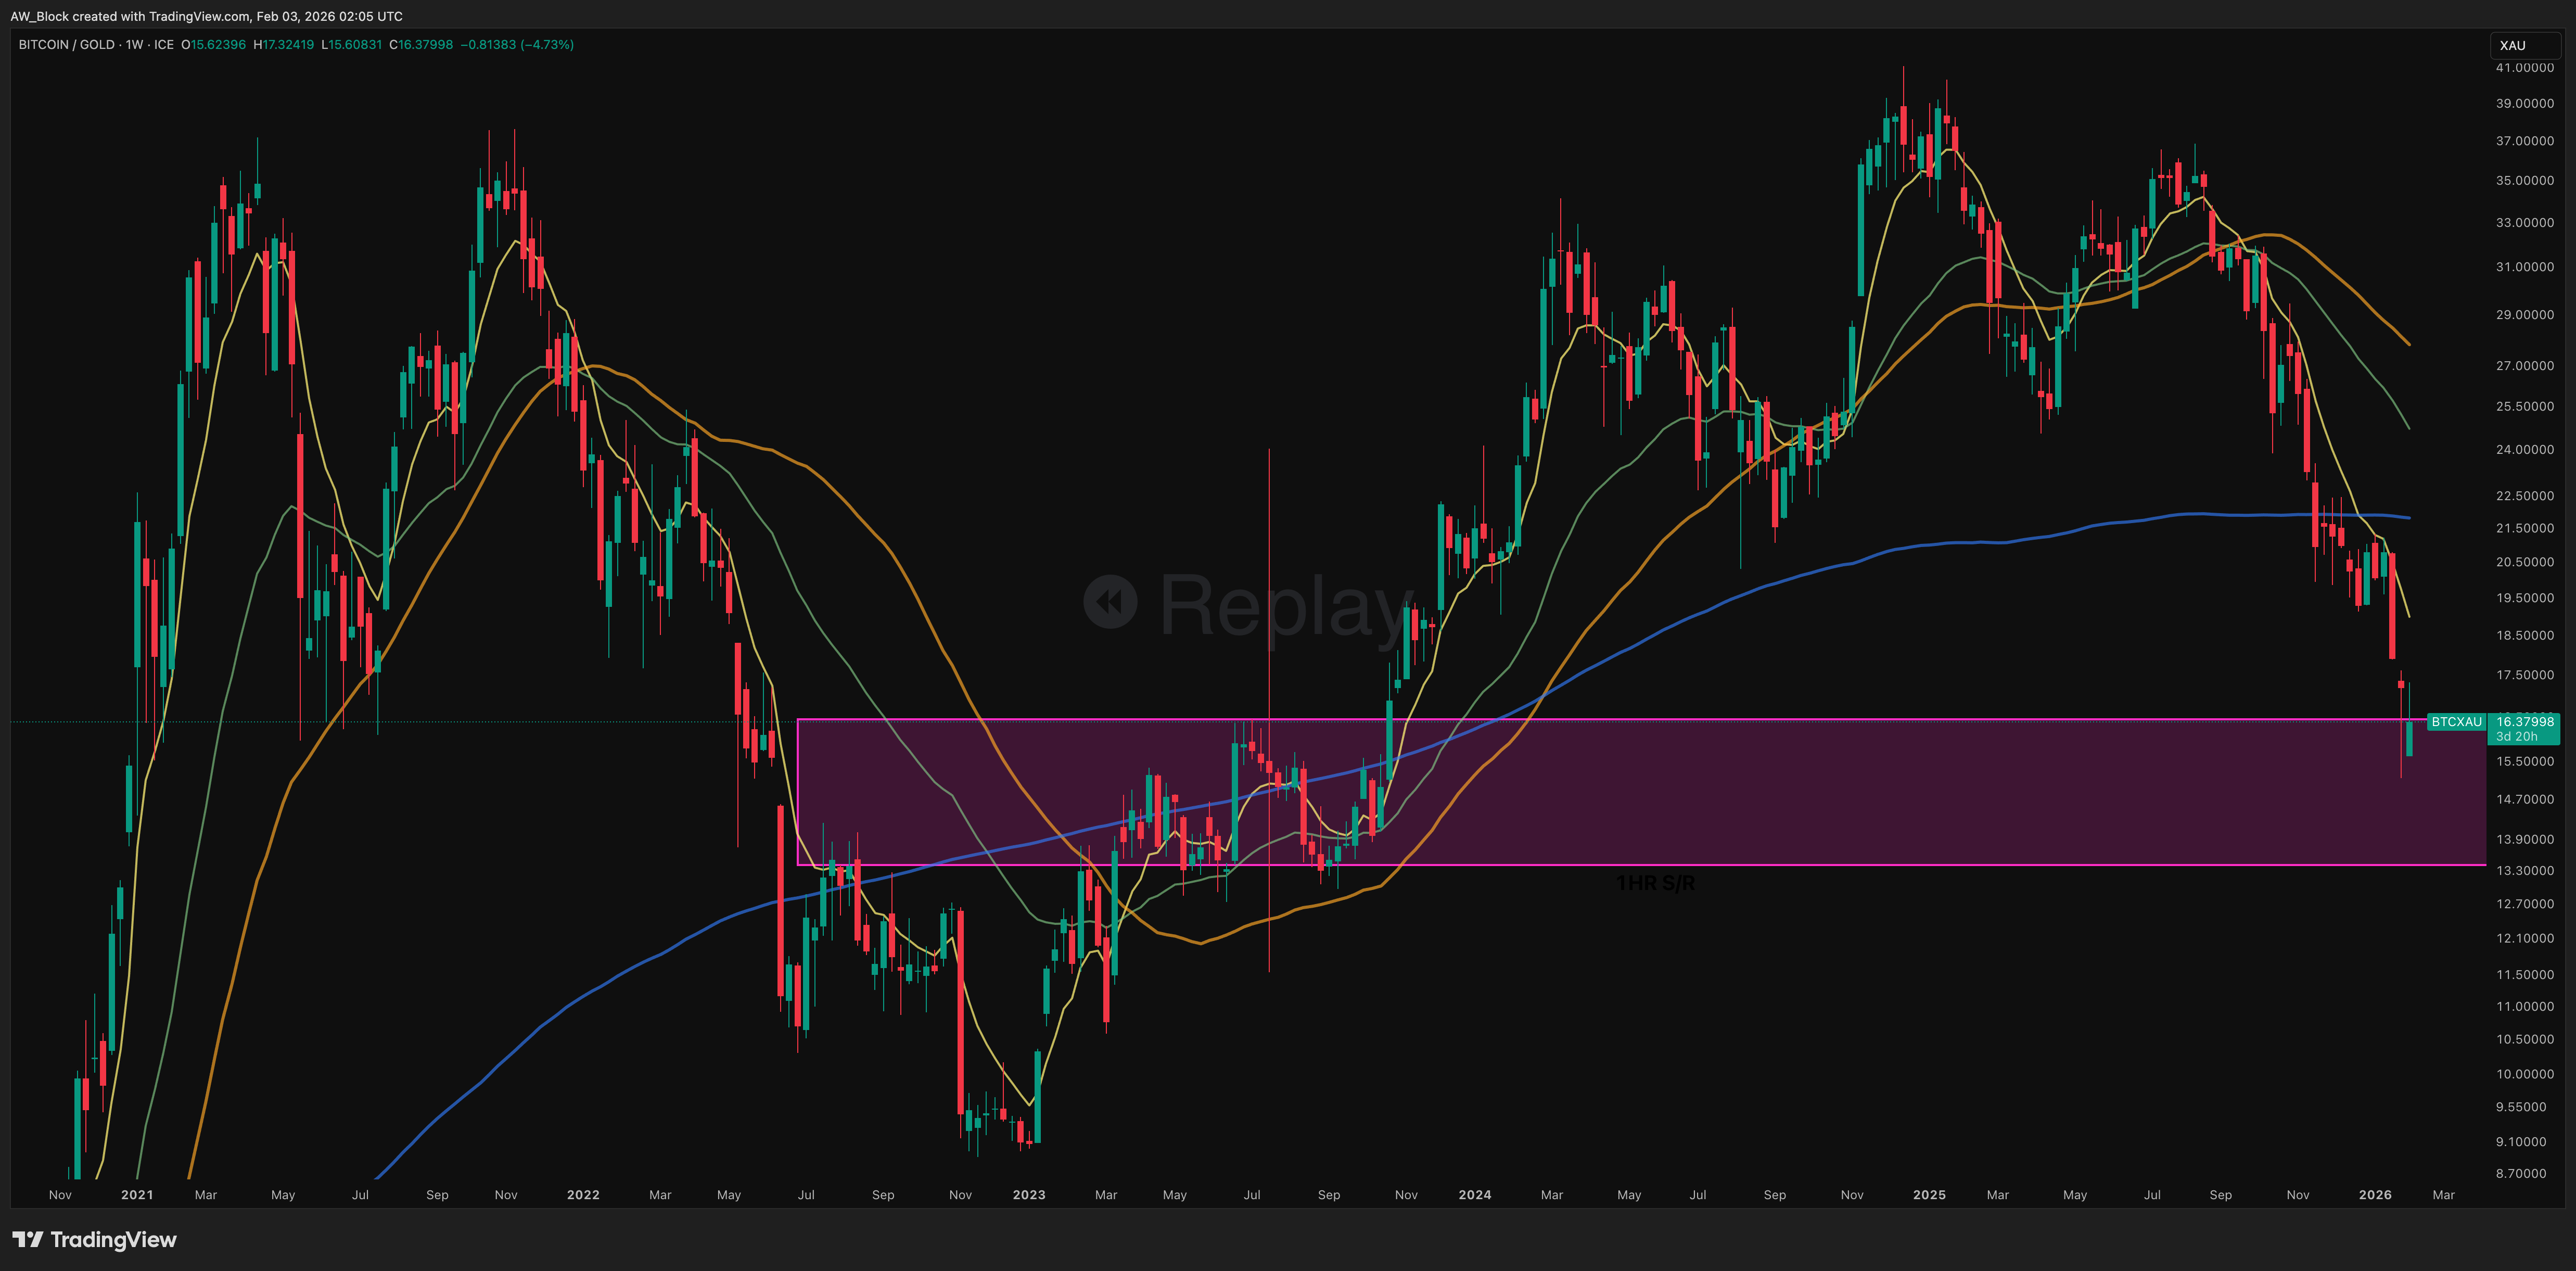
BTC/Gold remains in a corrective, mean-reversion phase following its 2024–early 2025 impulse, with the ratio now testing long-term support near the rising 200 MA. Momentum has shifted in gold’s favor in the intermediate term, but the broader multi-year structure remains intact.
Recent candles show persistent selling pressure, though the latest bar’s lower wick suggests early support probing rather than capitulation. Price action reflects digestion after a strong advance, not a topping formation or structural breakdown.
Short-term trend conditions remain neutral-to-bearish, while the long-term trend stays bullish as long as the 200 MA holds. Volume confirms rotation rather than regime change, and sentiment has reset from confidence to caution.
Bottom line: BTCXAU is undergoing mean reversion within a secular uptrend. Sustained recovery above the 34 EMA would signal momentum repair, while a failure to hold long-term support would open the door to a deeper corrective leg.
The Fundamentals
Hashrate
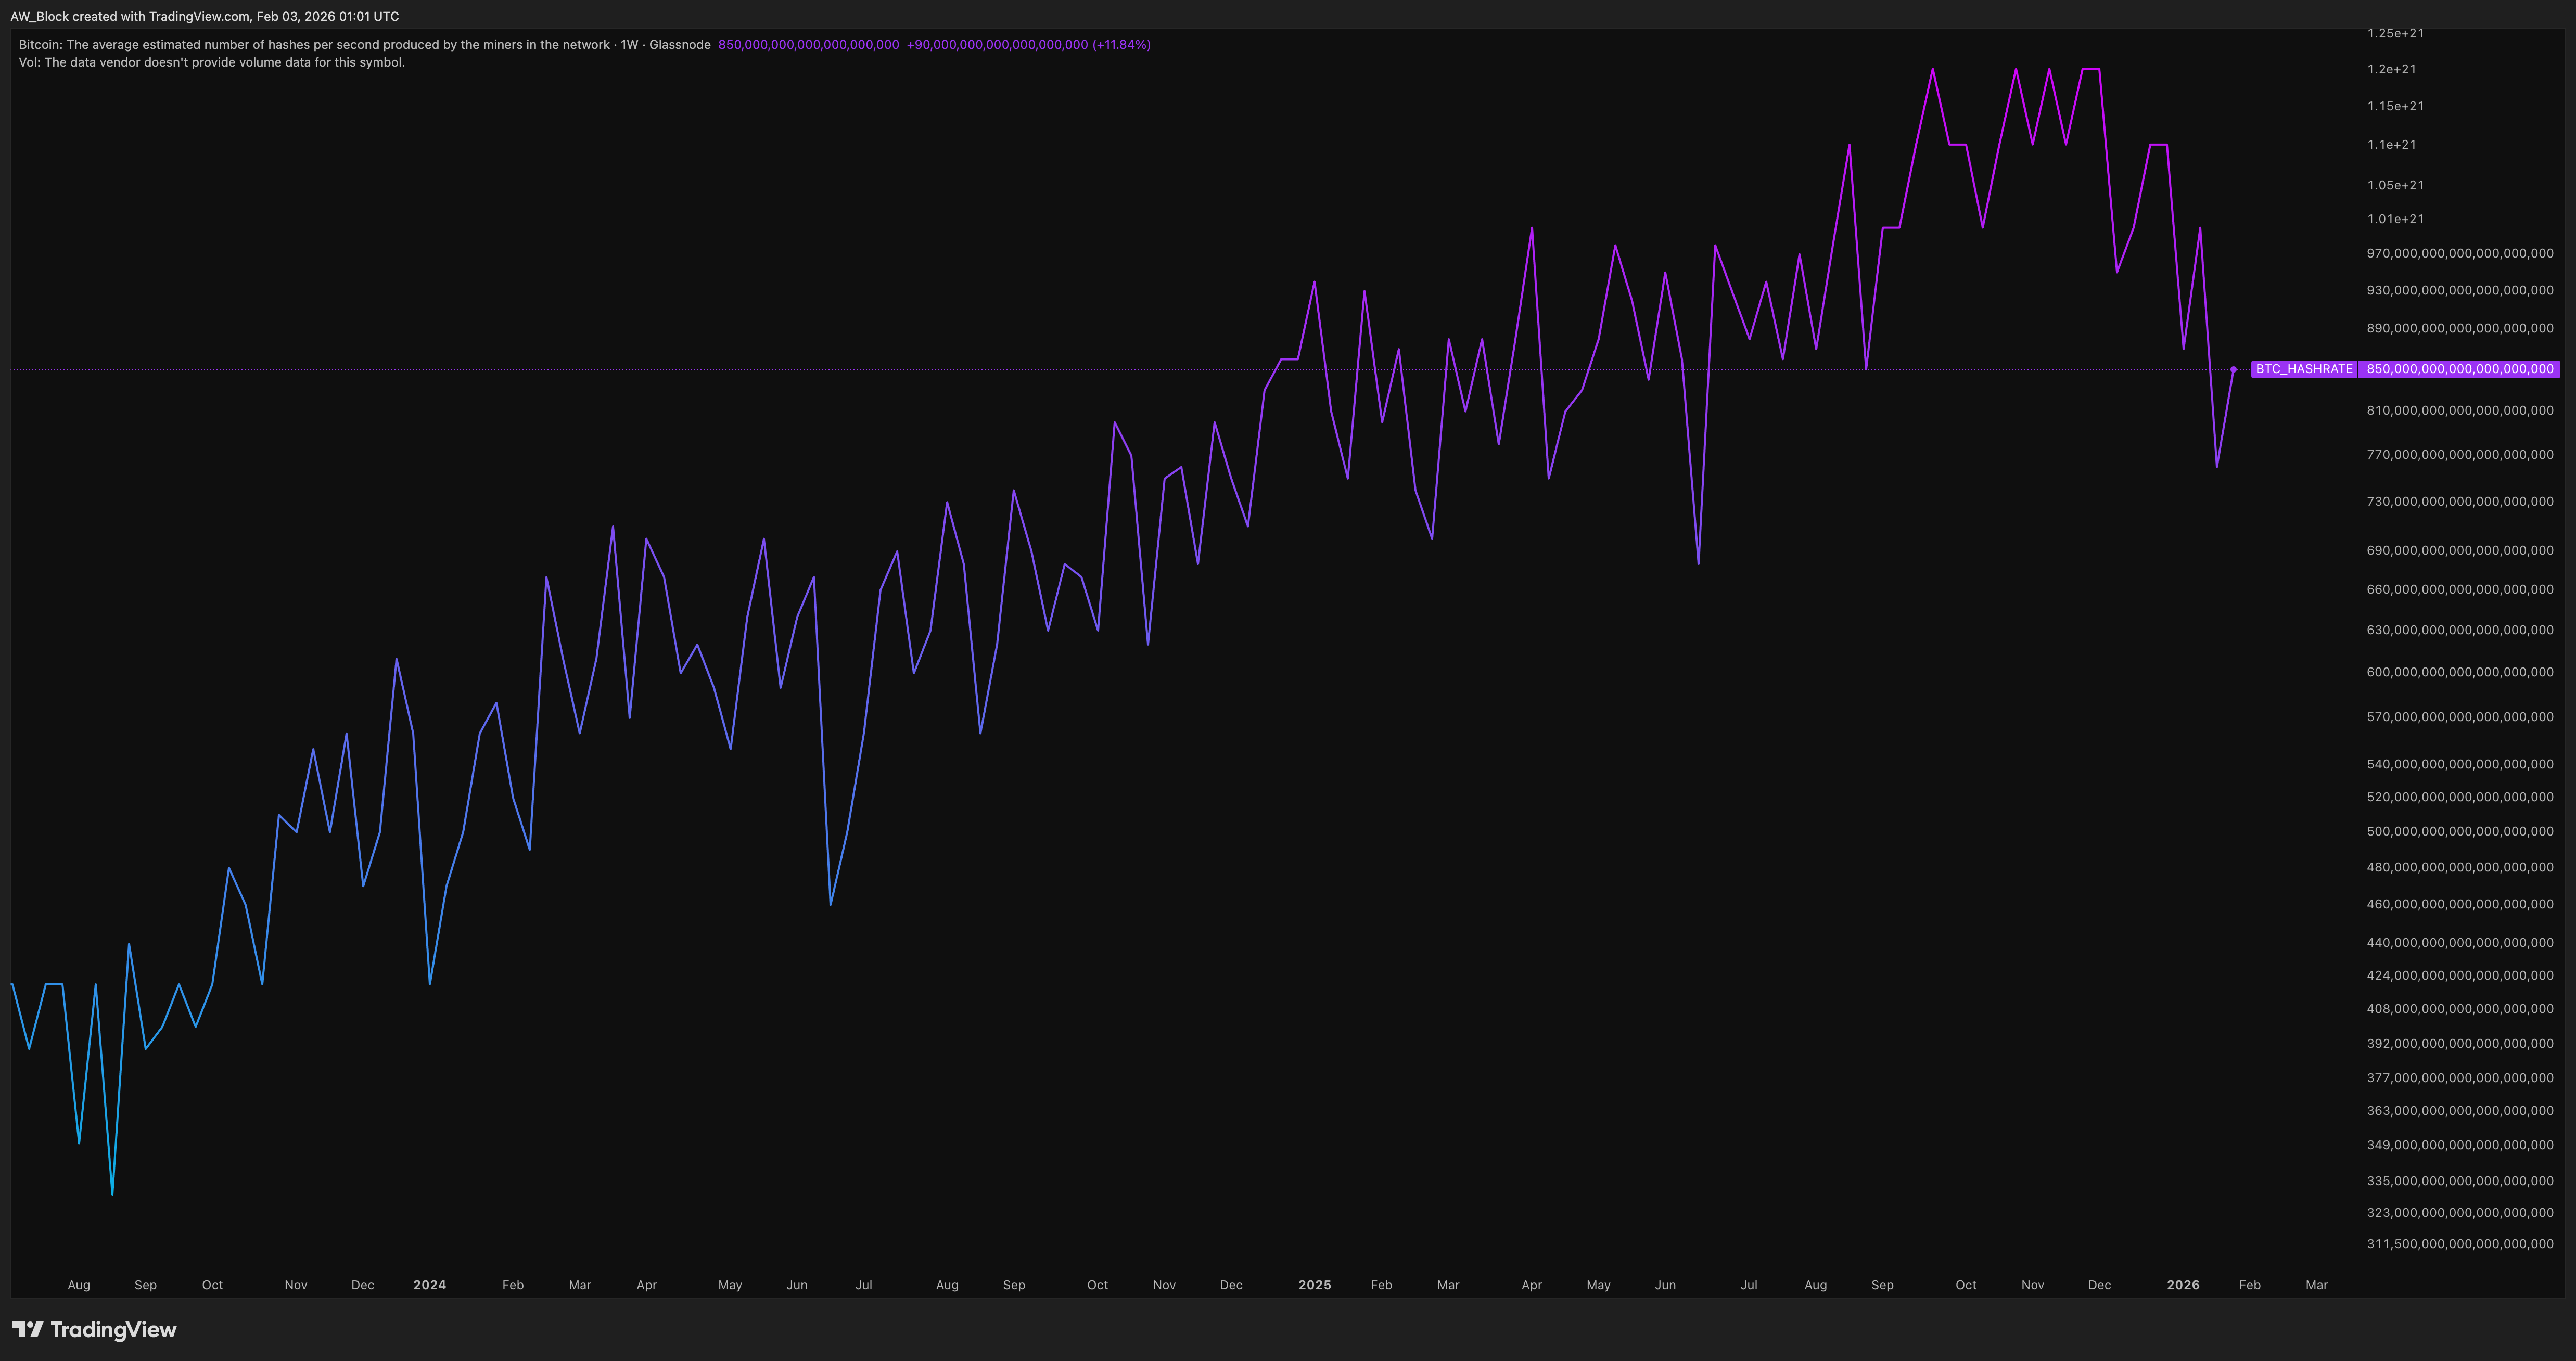
Bitcoin’s network hashrate has pulled back from recent cycle highs but remains structurally elevated, holding near 850 million TH/s on a weekly basis. The chart shows a clear sequence of higher highs and higher lows across the broader trend, with the recent decline representing a normalization after an extended period of aggressive expansion rather than a structural breakdown.
The key signal here is context. Hashrate did not collapse alongside price weakness. Instead, it retraced modestly from peak levels reached during late-cycle acceleration, consistent with post-expansion cooling. This behavior reflects temporary adjustments in miner participation and difficulty dynamics, not a loss of conviction.
Importantly, the long-term slope of hashrate remains upward. Even after the pullback, network security sits dramatically higher than prior cycle baselines, reinforcing Bitcoin’s proof-of-work moat. Miners continue to deploy capital selectively, favoring efficiency and scale over indiscriminate growth.
From a cycle perspective, this is typical mid-cycle behavior. Hashrate surges during expansion, pauses or retraces as margins compress, and then resumes its climb once equilibrium is restored. There is no evidence here of miner capitulation or systemic stress. The network remains robust, competitive pressure is healthy, and security continues to compound over time.
In short, hashrate is consolidating, not deteriorating. The network is digesting prior growth while maintaining a structurally strong foundation. This supports the broader thesis that Bitcoin is in a consolidation phase, not a weakening one, with underlying fundamentals remaining firmly intact.
Average Mining Cost
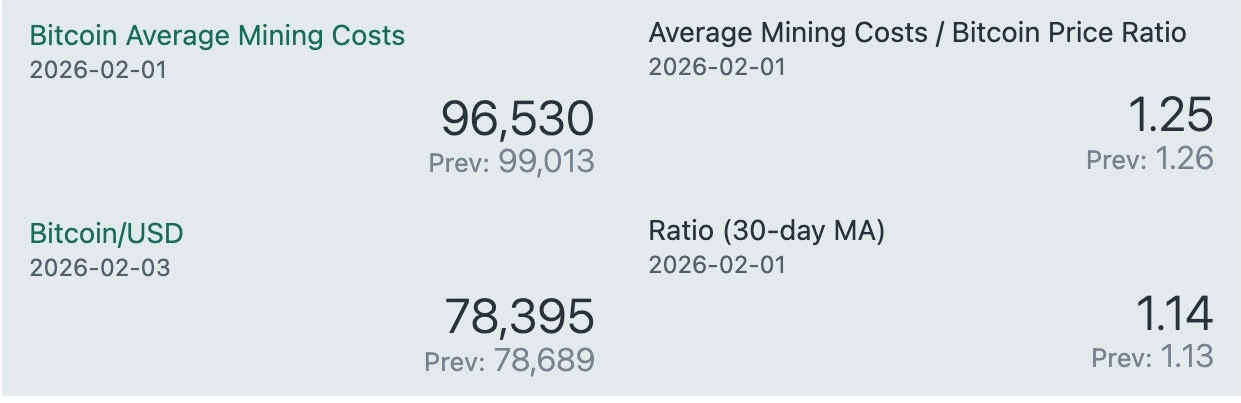
As of early February 1, 2026, the average cost to mine one Bitcoin has declined to approximately $96,530, down from $99,013 last month. While production costs have eased, Bitcoin’s spot price has fallen more sharply, now trading near $78,400. As a result, the mining cost-to-price ratio has widened to 1.25, with the 30-day moving average holding elevated around 1.14.
This marks a clear shift from January’s stabilization phase. Even though miners are benefiting from lower average production costs, price weakness has outpaced those improvements, pushing the network further below equilibrium. Margin compression has intensified again, particularly for higher-cost operators who remain exposed to sustained sub-cost pricing.
The decline in mining costs points to continued efficiency gains and favorable difficulty adjustments across the network. However, these improvements have not been sufficient to offset the magnitude of the recent price drawdown. The result is renewed financial pressure, not because costs are rising, but because revenue has fallen faster.
Despite this imbalance, there are still no clear signals of miner capitulation. Hashrate remains historically elevated, block production is steady, and network participation has not meaningfully rolled over. This continues to align with prior cycle behavior, where extended periods below average production cost acted as equilibrium zones rather than systemic stress events.
Historically, environments where Bitcoin trades materially below production cost tend to resolve through price recovery or prolonged consolidation, not immediate miner exit. As long as network security remains intact and hashrate holds near cycle highs, miner resilience and long-term confidence persist. Current conditions reflect heightened pressure within a corrective phase, not structural weakness in the network itself.
Top Assets By Market Cap
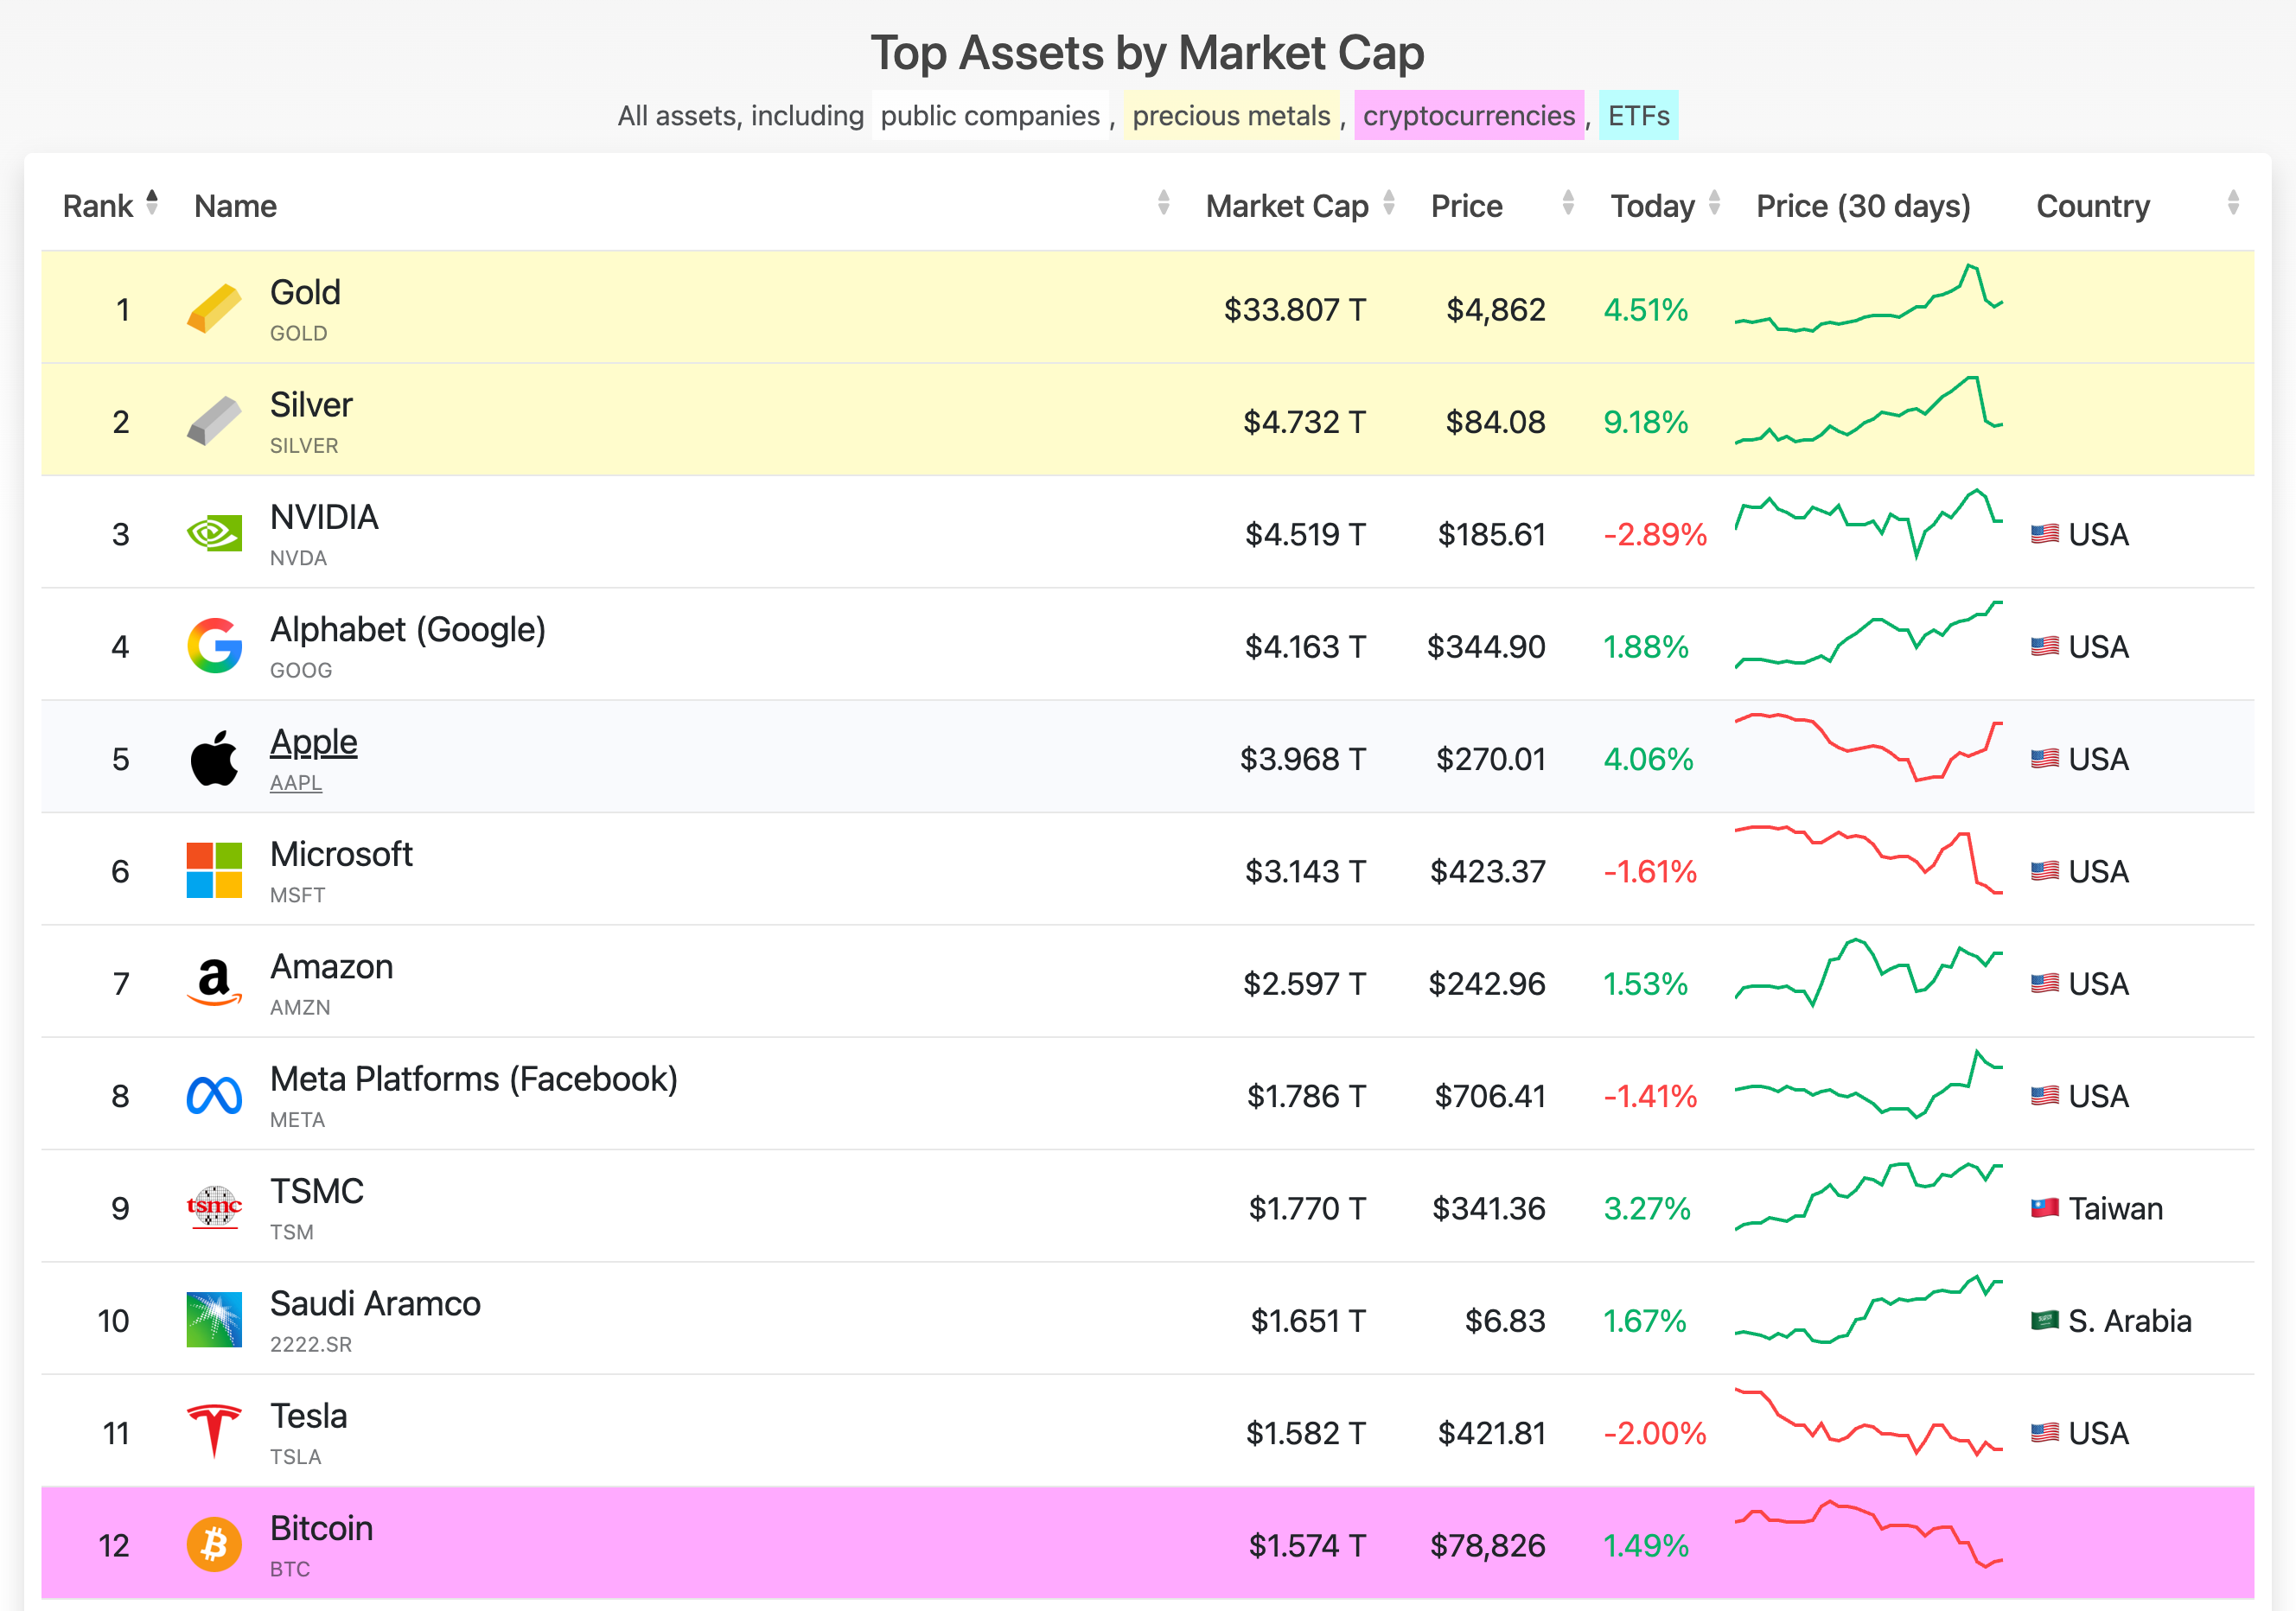
As of early February 2026, Bitcoin’s market capitalization has declined to approximately $1.57 trillion, placing it at #12 globally among the world’s largest assets. This marks a notable step down from last month’s ~$1.9 trillion valuation and reflects the continuation of the broader price correction, with Bitcoin now trading near $78K.
Bitcoin has slipped out of the top ten as capital rotated toward a mix of traditional equities and hard assets. Meta Platforms, TSMC, Saudi Aramco, and Tesla now sit above Bitcoin in the rankings, while gold and silver continue to command the top positions. Gold has expanded further to over $33 trillion, and silver has climbed above $4.7 trillion, highlighting renewed demand for traditional stores of value amid macro uncertainty.
Importantly, this shift in ranking reflects relative performance, not a loss of structural relevance. Bitcoin remains firmly in the trillion-dollar class, maintaining a market capitalization larger than many of the world’s most valuable corporations. The move from #8 to #12 is consistent with mid-cycle drawdowns observed in prior bull markets, where Bitcoin temporarily ceded rank during corrective phases before reasserting itself during the next expansion.
The broader leaderboard underscores a familiar dynamic. Equities such as NVIDIA, Alphabet, Apple, and Microsoft continue to benefit from equity-specific flows, while commodities capture renewed attention in inflation-sensitive environments. Bitcoin, by contrast, is operating within its own cyclical rhythm, digesting prior gains rather than competing for short-term capital rotations.
In short, Bitcoin is consolidating valuation rather than breaking down. Remaining above the trillion-dollar threshold through a deep corrective phase reinforces its maturation as a global monetary asset. Rank volatility at this stage of the cycle is expected, and history suggests that periods like this tend to precede renewed relative strength once market conditions stabilize and the next expansion phase takes hold.
Bitcoin News
Highlights from the month of January
White House to Host Crypto and Banking Executives for Talks on Stalled U.S. Crypto Bill
Steak ’n Shake Adds $5 Million in Bitcoin Exposure, Deepening Bitcoin Commitment
9% of U.S. Merchants Now Accept Crypto, PayPal Survey Finds
Steak ’n Shake Adds $10 Million in Bitcoin to Corporate Treasury
If you have any suggestions, feel free to reach out to me on X. I’m always looking to improve and add value in ways others might enjoy—just keep it Bitcoin only.
Live free and stack sats,
Will
p.s. If we get that break of market structure, look out for “Maximum Sats: The Bitcoin Bear Market Playbook | 2” shortly after that.
You can check out Edition 1 of Maximum Sats here.
“Bitcoin is radically changing the world by being unchangeable.” - Robert Breedlove
What is A.W. Block?
We’re a Bitcoin consulting firm helping clients navigate the complexities of the digital asset world with clarity and confidence. Whether it’s recovering lost funds, developing a long-term Bitcoin accumulation strategy, or mastering market cycles through advanced charting education—we’re here to make your crypto journey seamless, secure, and strategic.
If you’re ready to level up your understanding, protect your wealth, or take control of your Bitcoin future, let’s talk.
awblock.io