

Around the Block | 7
Bitcoin‑Only Macro & Technical Recap for September 2025 — Published October 6, 2025

Another month in the books, and Bitcoin continues doing what it does best—cutting through noise, consolidating strength, and reminding us why this asset doesn’t play by traditional rules. Whether you’re zoomed out on macro or locked in on microstructure, September gave us plenty to reflect on. In this issue, we’ll break down the technicals across multiple timeframes, check in on mining costs, hash rate, and market cap, and recap the most relevant Bitcoin news from the past month. As always, this is a Bitcoin-only space—no altcoins, no distractions.
None of this is financial advice.
Don’t trust, verify.
Let’s dive in.
Key Technical Terms
EMA (Exponential Moving Average):
A moving average that gives more weight to recent price data, making it react faster to short-term changes in market direction. Traders use EMAs (like the 8 or 34) to gauge momentum, identify pullbacks, and spot early trend shifts.
MA (Moving Average):
A smoothed line showing the average closing price over a chosen period (e.g., 50 or 200 candles). It filters out noise and helps identify the broader trend — whether the market is generally rising, falling, or consolidating.
Candlestick Patterns:
Visual formations created by individual or groups of candlesticks that represent market psychology — showing where buyers or sellers gained control. Examples include:
Hammer / Shooting Star: Potential reversal signals
Bullish / Bearish Engulfing: Momentum shift indicators
Doji: Market indecision
Together, EMAs, MAs, and candlestick patterns give a full picture of trend strength, momentum, and sentiment — essential for understanding where price may go next.
The Technicals
Monthly
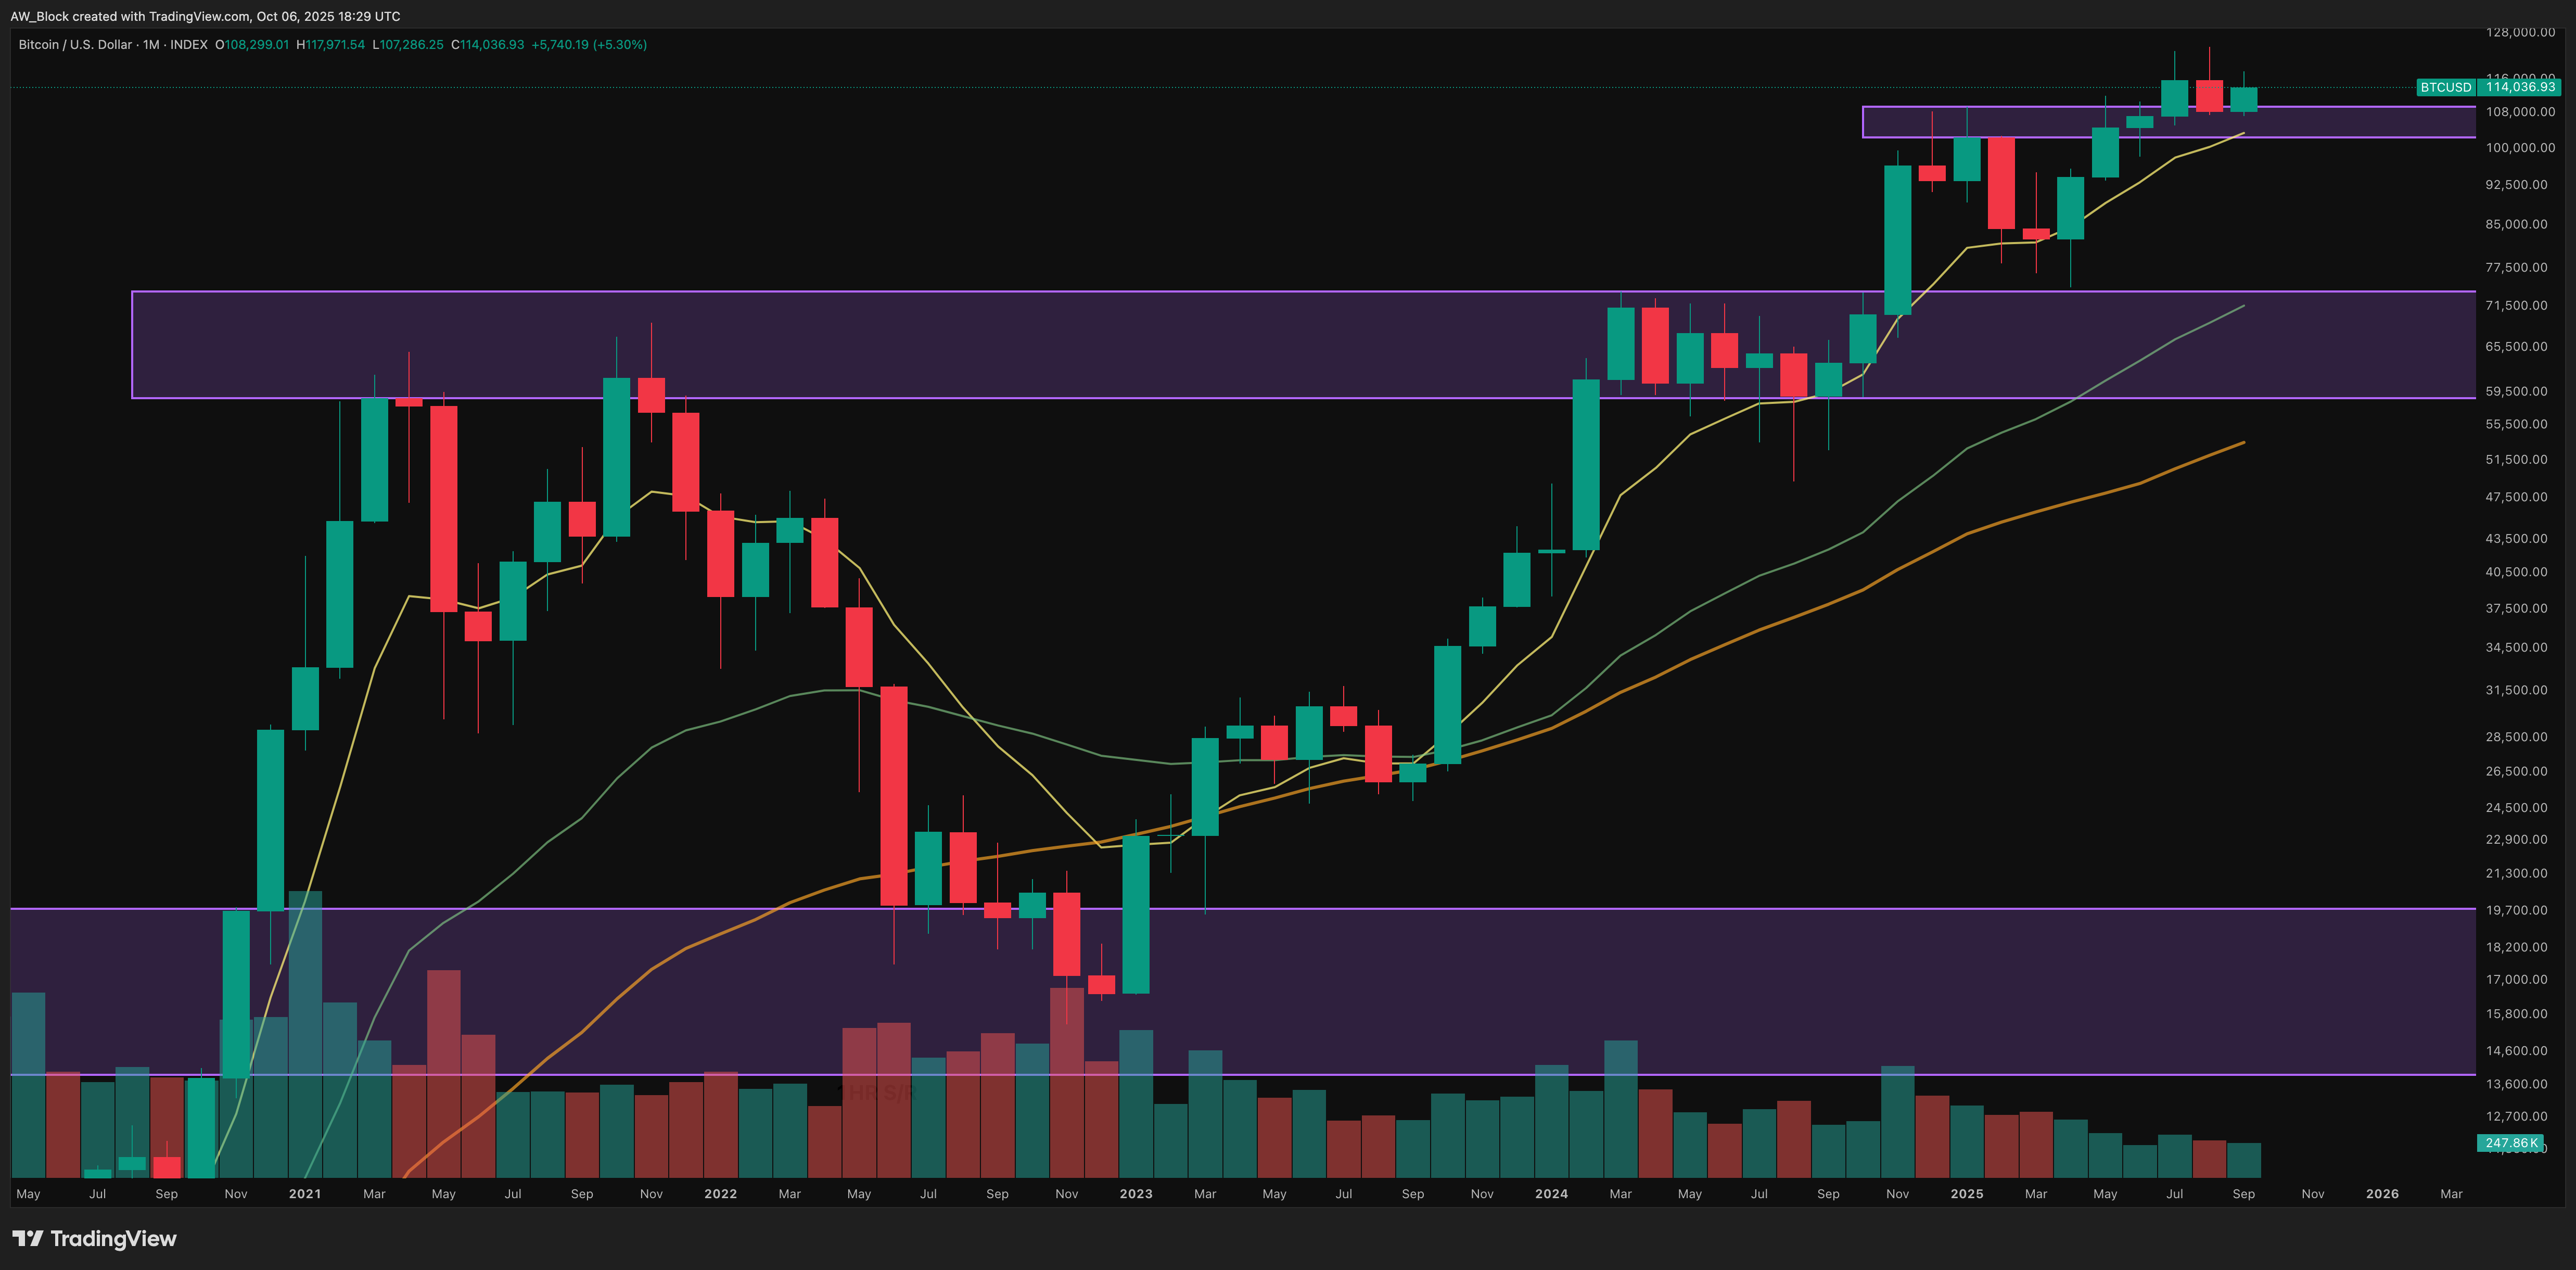
Monthly Chart Overview — Closing Price: ~$114,037
Key Monthly Levels:
$59,000–$74,000 (M S/R) – Major reclaimed macro zone from the previous cycle top.
$102,500–$109,500 – Current consolidation/resistance zone.
8 EMA (Yellow) – ~$103,400 → Acting as dynamic support.
34 EMA (Green) – ~$71,591 → Medium-term trend support.
50 MA (Orange) – ~$53,486 → Long-term structural anchor.
Structure & S/R Zones
Bitcoin has cleanly broken above the previous all-time high near $69K and is now trading within a broader monthly resistance band between ~$102K and ~$118K. This zone is showing signs of congestion, with multiple candles rejecting the upper boundary.
Meanwhile, the prior cycle top around $60K–$72K has flipped into support, forming a textbook Schabacker-style “change of polarity” — resistance turned support.
The macro trend remains bullish, defined by higher highs and higher lows. However, the last few candles suggest momentum is cooling, with smaller bodies and longer wicks developing near resistance. This type of price action often precedes either a breakout or a broader pause before continuation.
Candlestick Patterns
Recent price action forms a Three-Candle Consolidation Sequence:
One strong impulsive green candle,
Followed by two small-bodied candles within its upper range.
This is consistent with the “Rising Three Methods” bullish continuation pattern. A breakout and close above $118K would validate this setup. On the flip side, if price stalls further and rolls over, the sequence could evolve into a High Base or Evening Doji Star, hinting at a local top — confirmation would require a close below the 8 EMA (~$107K).
Chart Patterns
The current consolidation resembles an Ascending Range sitting at major resistance — a pattern that often resolves upward in strong trends, but can be vulnerable to false breakouts when volume dries up.
According to Bulkowski’s stats, High Base or Rectangle Top formations break upward about 68% of the time in bull markets — but fail 32%, particularly when accompanied by volume divergence.
So far, volume is contracting, suggesting low breakout energy unless renewed participation steps in.
Moving Averages
8 EMA (Yellow): Dynamic support at ~$103.5K. Holding this keeps BTC in “acceleration mode.”
34 EMA (Green): Medium-trend mean at ~$71.5K. Dips here remain structurally bullish.
50 MA (Orange): Deep macro anchor at ~$58K. This is the “line of defense” if broader weakness sets in.
All moving averages are bullishly stacked (8 > 34 > 50) — a strong trend confirmation in any market.
Volume Context
Volume peaked during the breakout in November 2024 and has since declined, a typical sign of consolidation rather than distribution. This is in line with Bulkowski’s observation: low-volume consolidations at highs often precede breakout continuation — as long as key support zones hold.
Market Psychology
Right now, sentiment is balanced between greed and disbelief. Many market participants remain anchored to the memory of the $69K top in 2021 — hesitant to accept new highs.
This aligns with Mark Douglas’ view:
“Confidence is the absence of fear. The trader who trusts the trend does not interpret consolidation as threat.”
As long as Bitcoin holds above the 8 EMA, bulls maintain structural control. Any retest of the $102K–$107K zone may serve as a launchpad, barring a breakdown on volume.
Weekly
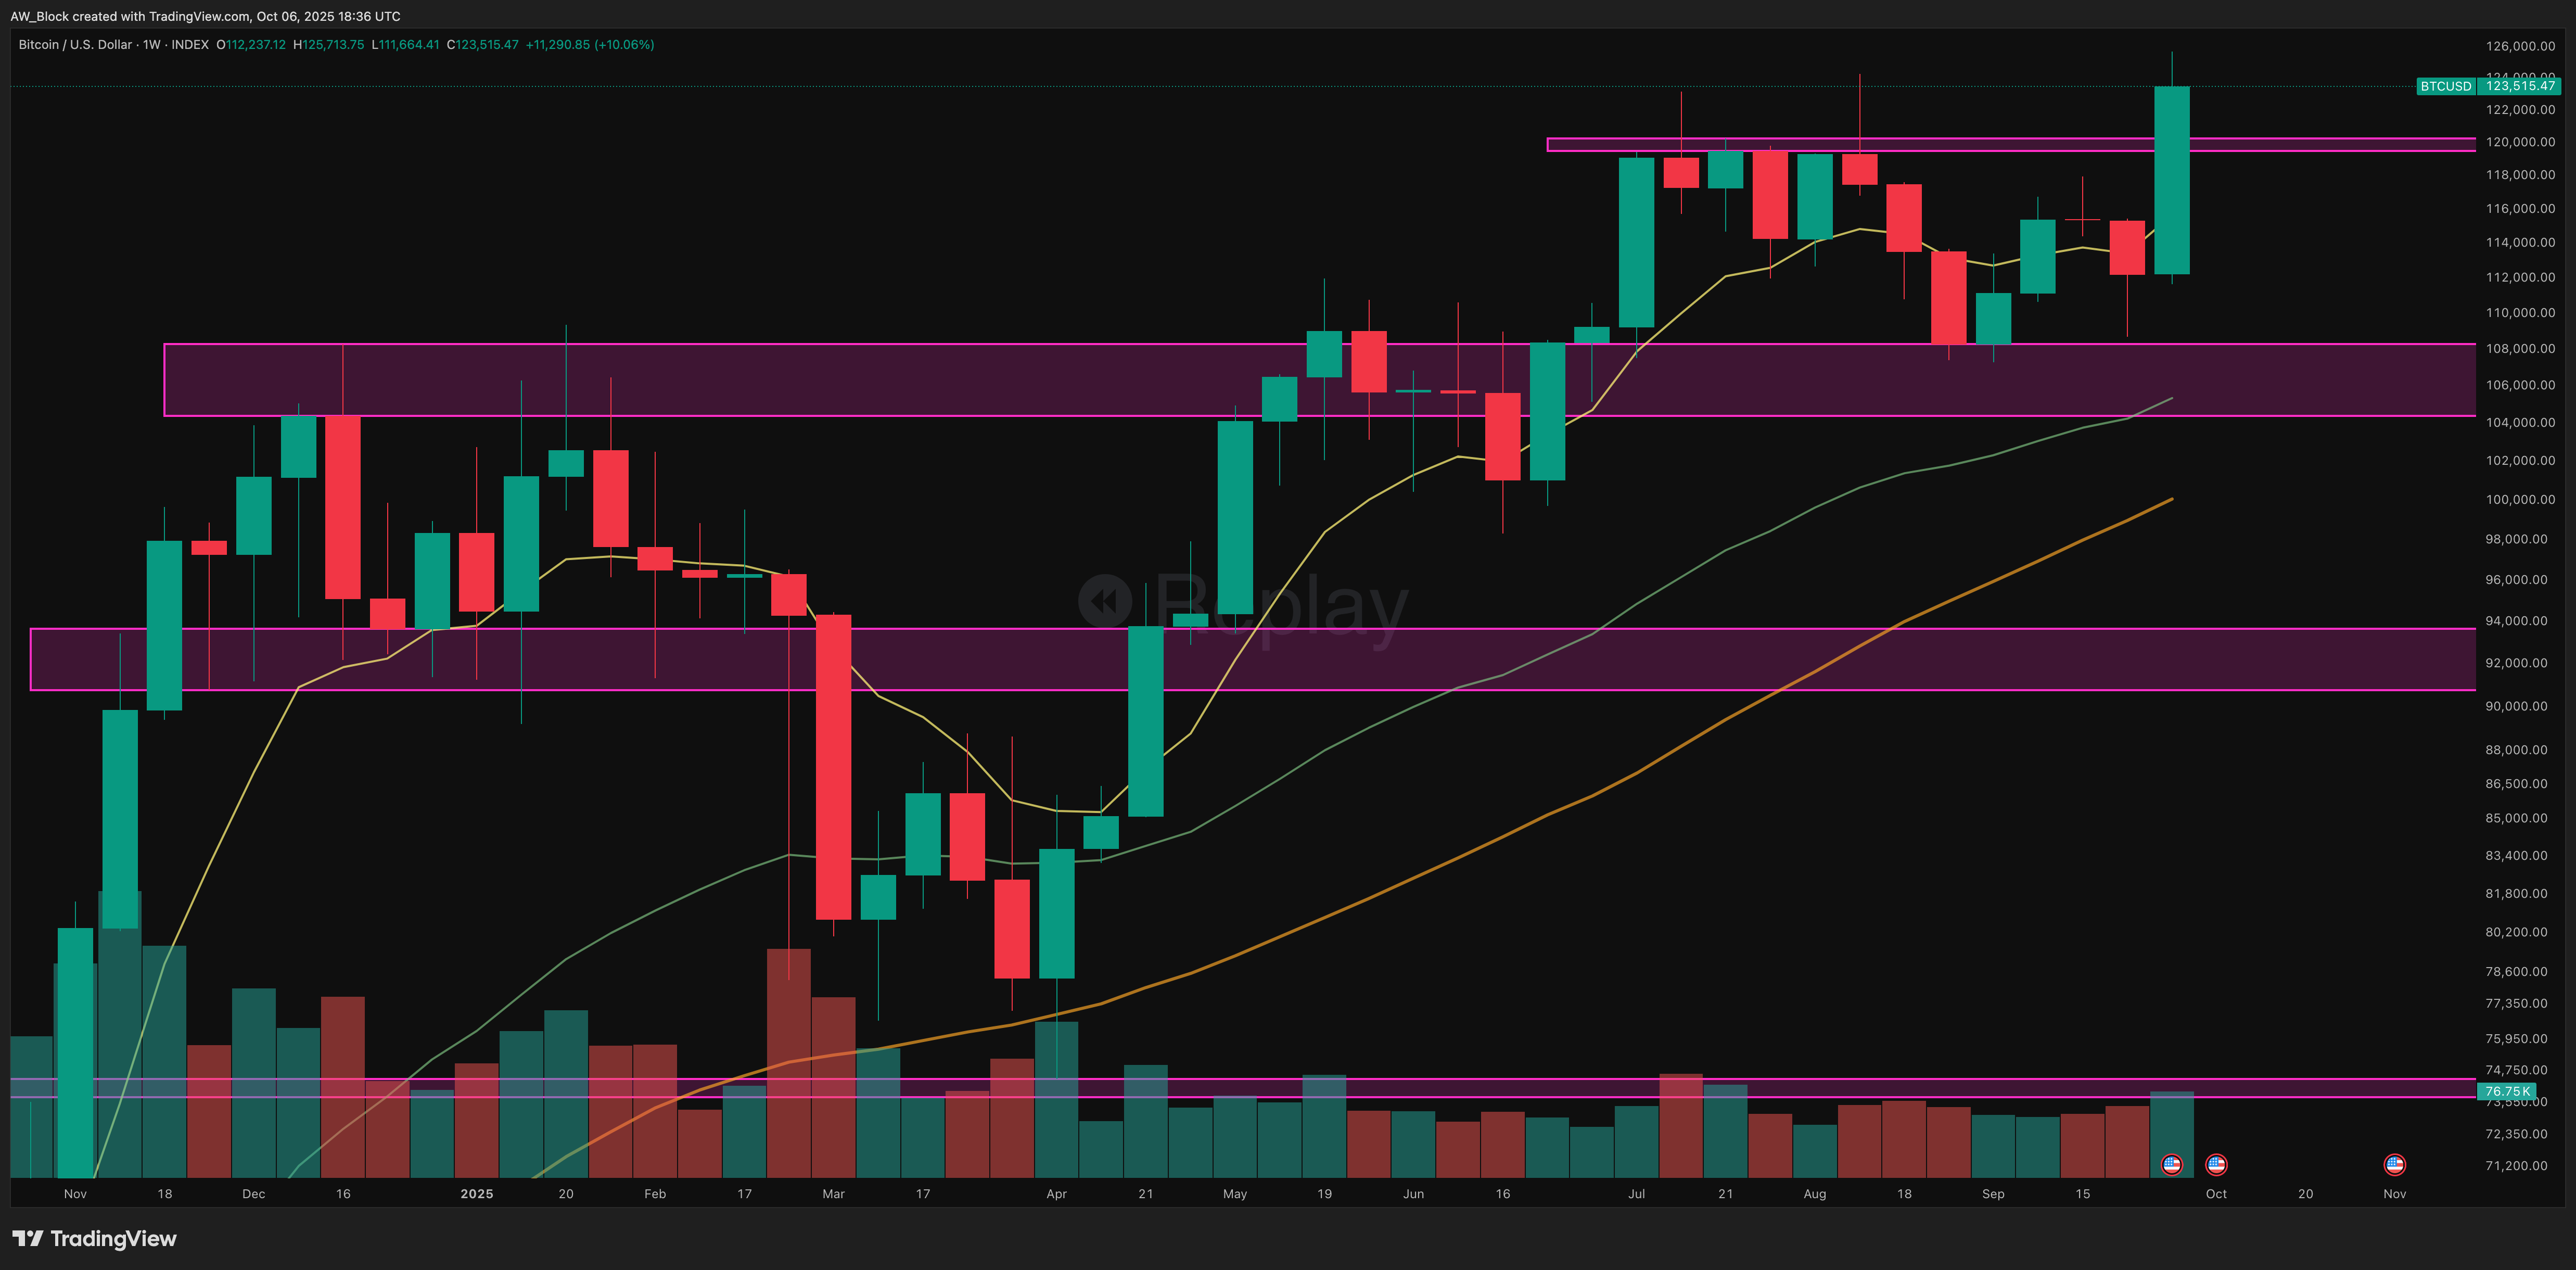
Key Weekly Levels:
$119,000–$120,000 (W S/R – Upper Zone):
Recently broken resistance now acting as short-term supply during retest.$104,000–$108,000 (W S/R – Mid-Zone):
Former resistance now confirmed as support — a textbook Schabacker “change of polarity.”$91,000–$94,000 (W S/R – Lower Zone)
8 EMA (Yellow): ≈ $115,662 — Short-term dynamic support, often used for acceleration.
34 EMA (Green): ≈ $105,355 — Mid-trend mean, still rising.
50 MA (Orange): ≈ $100,068 — Long-cycle anchor, untouched since early Q2 2025.
Structure and S/R Zones
Macro Context:
Bitcoin has broken cleanly above its multi-month consolidation range ($107K–$121K). The breakout is confirmed by a strong impulsive candle that closed well above resistance, reasserting the dominant uptrend.
Trend Structure:
Higher highs and higher lows remain intact. The 8 EMA provided launchpad support for this leg, while the $107K–$110K zone successfully flipped to support, validating bullish market structure.
Candlestick Patterns
The current breakout candle is a strong green Marubozu-style bar — opening near the low and closing near the high — indicating full control by buyers.
Preceding this move was a potential Three Line Strike setup: three small corrective red candles followed by one powerful green breakout.
Per Nison, this is a high-probability continuation pattern when confirmed by strong volume, which we see in this case.
Chart Patterns
Between May and September 2025, BTC formed a clear rectangle consolidation with ~$107K support and ~$121K resistance.
Now that price has broken above the range, the breakout appears valid.
Bulkowski stats: Rectangle tops in uptrends break higher ~68% of the time, with measured moves equal to the height of the pattern (~$14K).
Projected target: $135K–$140K
(This aligns with the macro monthly outlook.)
Trend and Moving Averages
8 EMA (≈ $115K): Rising steeply, holding as dynamic support
34 EMA (≈ $105K): Mid-trend guide, confirming sustained strength
50 MA (≈ $100K): Long-term structural support untouched for months
200 MA (≈ $53.5K): Deep cycle base — still rising, though unlikely to be revisited unless a major macro shift occurs
All moving averages are bullishly aligned (8 > 34 > 50 > 200), reinforcing an acceleration phase in the current trend.
Volume Profile
The breakout candle registered the highest bullish volume since August 2025.
This follows several weeks of contraction — a classic “quiet before the move” setup.
No major signs of distribution are present. Buyer dominance is clear.
Sentiment & Market Psychology
The market is moving from skepticism to acceptance.
Breaking above $121K, a key psychological ceiling, has removed doubt for many traders and is pulling sidelined participants back into the trend.
“Consistency arises from thinking in probabilities, not predictions.”
— Mark Douglas
Traders acting on structure and trend — not emotion — are being rewarded. As confidence builds, bearish pressure turns into short-covering fuel.
Daily
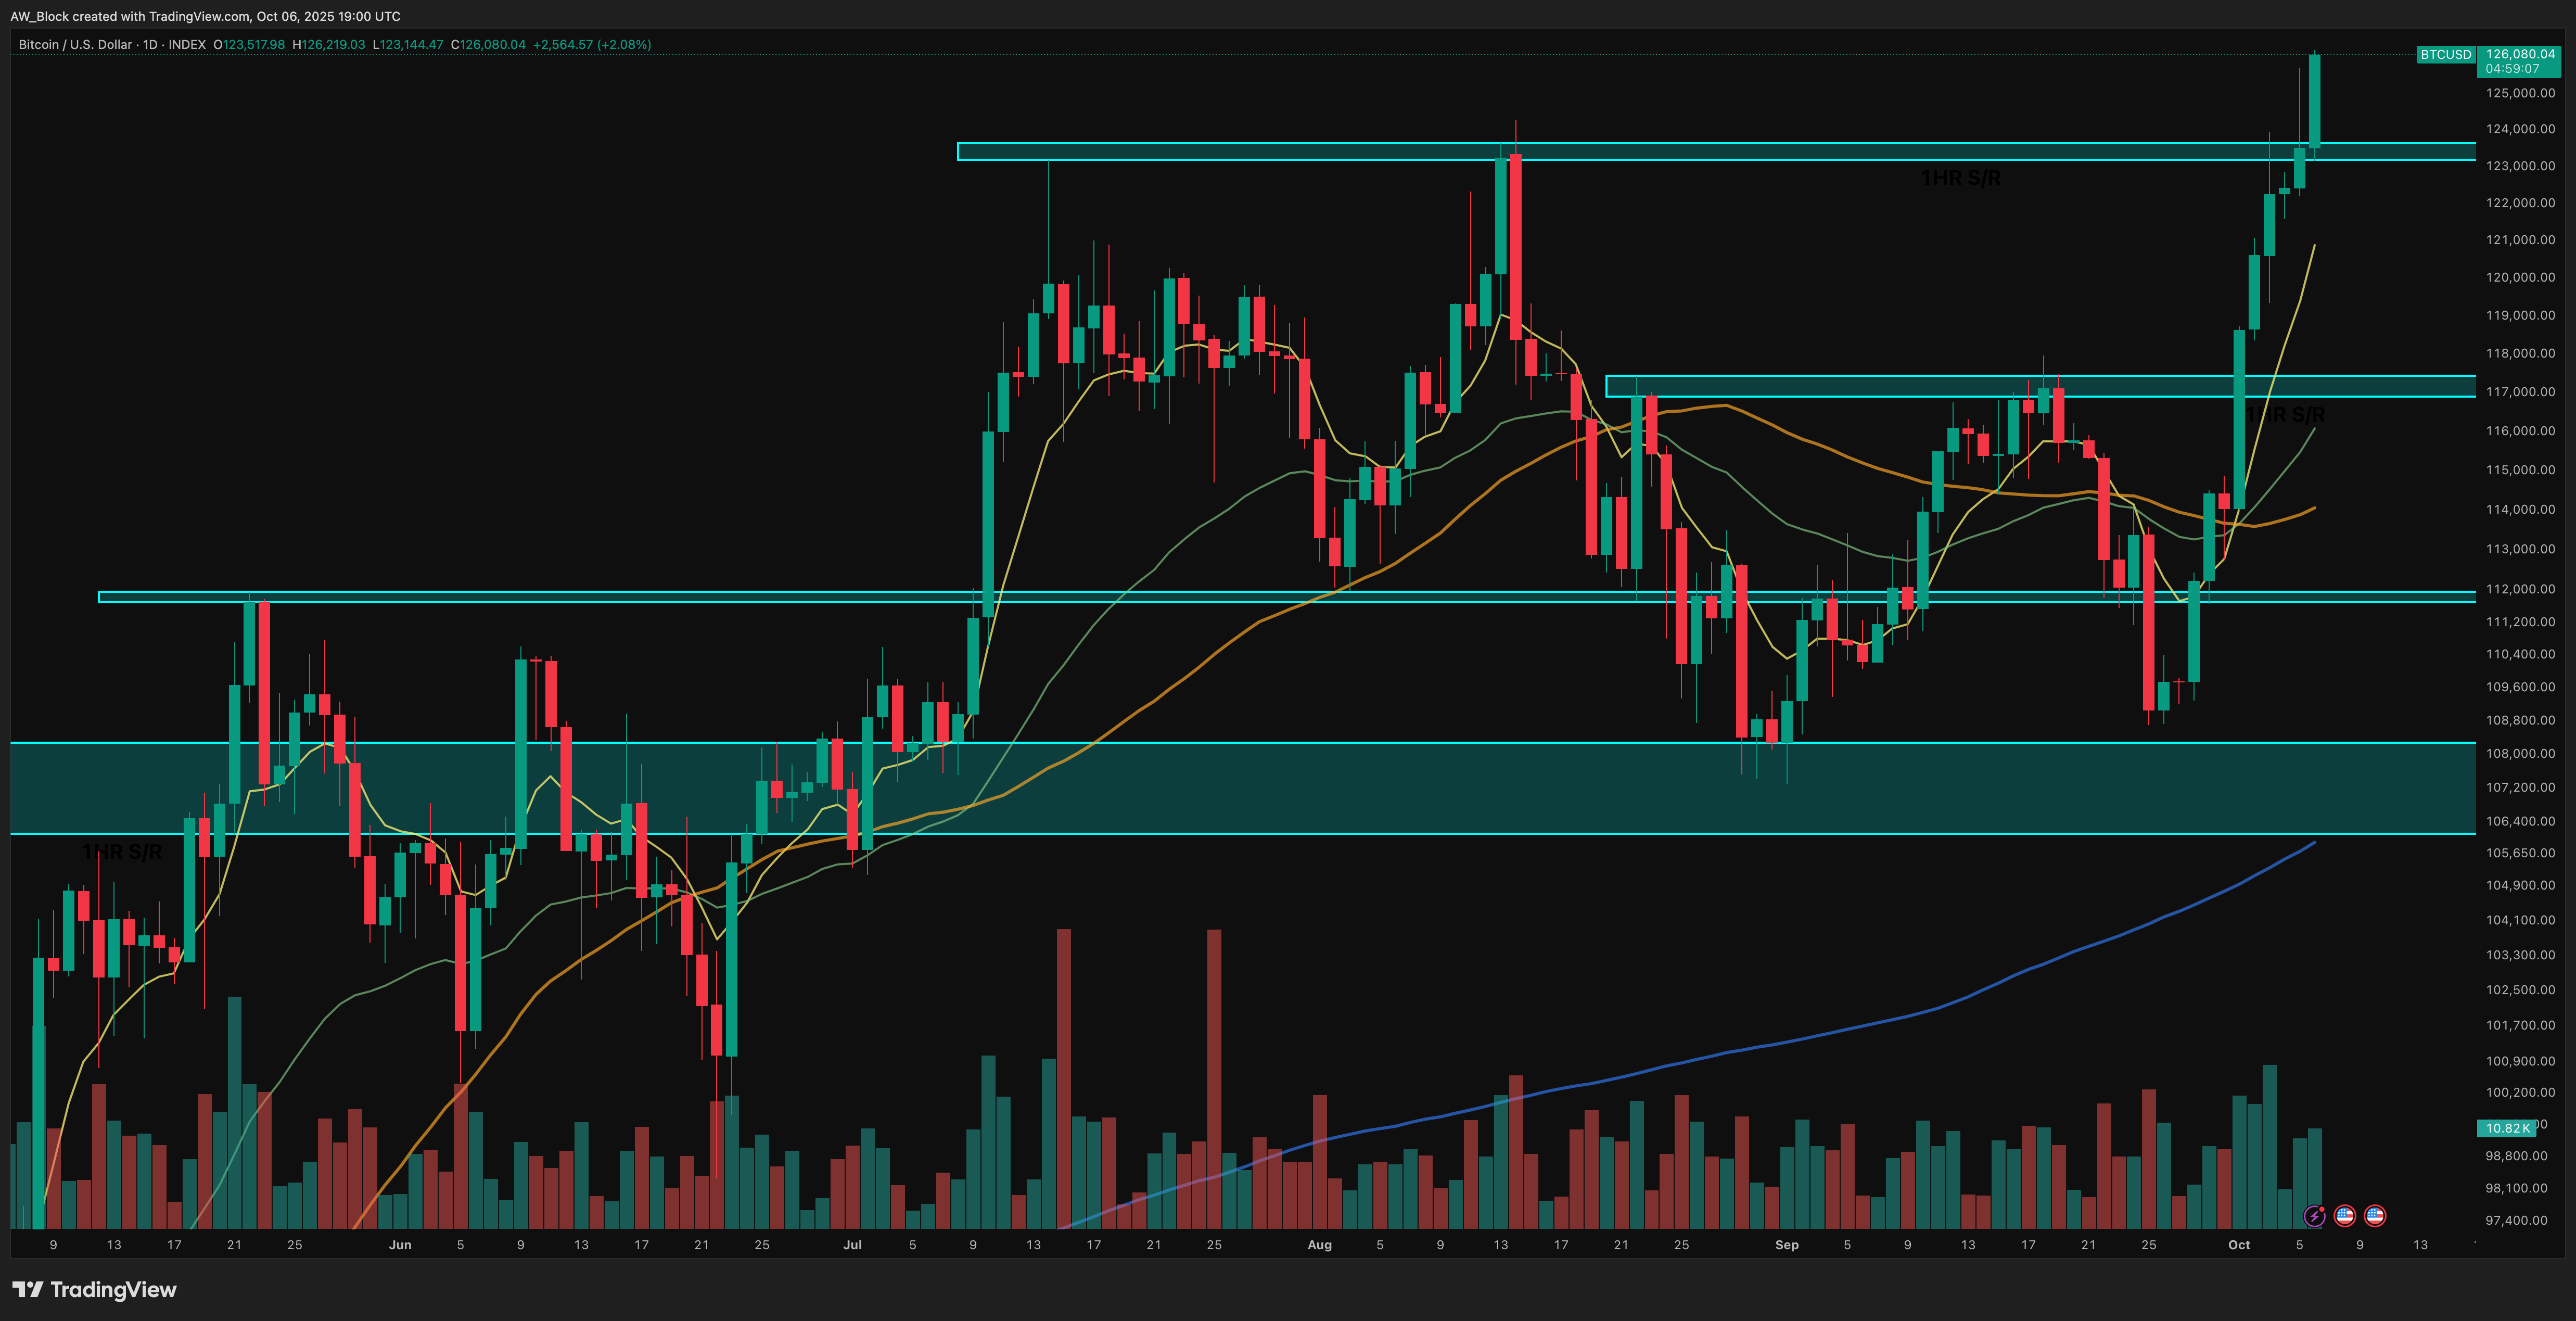
Key Levels:
D S/R (Teal): ~$123,100 – $123,700 → Freshly broken daily resistance, now testing as potential new support.
D S/R: $117,000 – $117,500 → Prior congestion / breakout trigger zone.
D S/R: $106,100 – $108,200 → Old base
8 EMA (Yellow): ≈ $120,827 → Short-term dynamic support.
34 EMA (Green): ≈ $116,065 → Intermediate trend control.
50 MA (Orange): ≈ $114,050 → Medium-term structural guide.
200 MA (Blue): ≈ $105,921 → Long-term directional bias line.
Structure & S/R Zones
Context:
BTC has broken out from a multi-month compression range bounded by $118 K – $124 K, confirming a shift from mid-cycle consolidation to trend expansion.
The breakout candle has closed above the upper D S/R zone with strong body follow-through.
Trend Structure:
Sequence of higher lows since mid-September.
Price is now in acceleration mode, distancing from the 8 EMA.
Nearest support rests at the breakout retest zone (~$123,100 – $123,700).
Candlestick Patterns
The current breakout candle is a large bullish Marubozu, closing at the highs → clear confirmation of momentum.
The prior four-bar structure shows a Morning Star-type reversal cluster that formed at the $111 K support (August 30 – Sept 10).
Nison classifies this as a major continuation/reversal hybrid depending on volume — here it triggered continuation, validating renewed bullish control.
Chart Patterns
Pattern development from August through early October formed a rounded base / inverted head-and-shoulders style structure.
Left shoulder: $118 K rejection (Aug)
Head: $107 K low (Sept)
Right shoulder: $111 K rebound (late Sept)
Neckline: ≈ $118 K
Breakout above neckline → pattern target = height (~$11 K) → projection: $129 K – $130 K.
Bulkowski stats: inverted H&S breakouts succeed ~72 % in uptrends with average +20 % move; fits ongoing momentum profile.
Moving Averages / Trend
8 EMA (≈ $120,827): Rising sharply, acting as immediate dynamic support and confirming short-term trend acceleration.
34 EMA (≈ $116,065): Mid-trend guide; steady upward slope indicates sustained market strength.
50 MA (≈ $114,050): Medium-term structural support aligning with prior breakout zone; trend foundation remains firm.
200 MA (≈ $105,921): Deep cycle base—still ascending, unlikely to be tested unless a broad macro correction develops.
All moving averages are bullishly aligned (8 > 34 > 50 > 200), reinforcing an acceleration phase within the ongoing uptrend.
Volume Analysis
Volume expanded significantly on the breakout candle—highest since mid-July.
This validates the move as institutionally confirmed rather than short-covering.
Volume during the base was contracting, meeting Bulkowski’s continuation criteria: contraction → expansion = valid breakout.
Psychological & Probabilistic Context
Market sentiment has transitioned from hesitation to conviction.
Traders previously anchored to the $118 K resistance are now chasing higher entries.
“The consistency you seek is in your mind, not the market.” — Mark Douglas
Confidence, not prediction, defines success here; staying aligned with the 8 EMA bias keeps focus on probabilities, not fear of reversal.
Summary & Outlook
Bullish Continuation (Primary):
Conditions: Daily closes above $124K; maintain 8 EMA support.
Target: $129K – $130K (initial); extended to $135K – $140K if confirmed by weekly continuation.
Invalidation: Break and close below $124K with heavy volume.
Neutral Retest Scenario:
Conditions: Controlled pullback to $123,100 – $123,700 on declining volume.
Expectation: Constructive retest forming a higher low before the next leg up.
Bearish Scenario (Low Probability)
Conditions: Daily close below $116,065 (beneath 34 EMA).
Target: Deeper retrace toward $114,050 (50 MA) or ~$107K structural support.
Bitcoin on the daily timeframe has completed a neckline breakout from a multi-week accumulation range. Price action, volume, and EMA alignment collectively reinforce a bullish continuation phase toward $129 K – $130 K. Maintaining closes above the 8 EMA (~$120,827) preserves trend momentum; a retest of the breakout zone ($123,100 – $123,700) would likely act as a launchpad rather than a reversal.
The Fundamentals
Hashrate
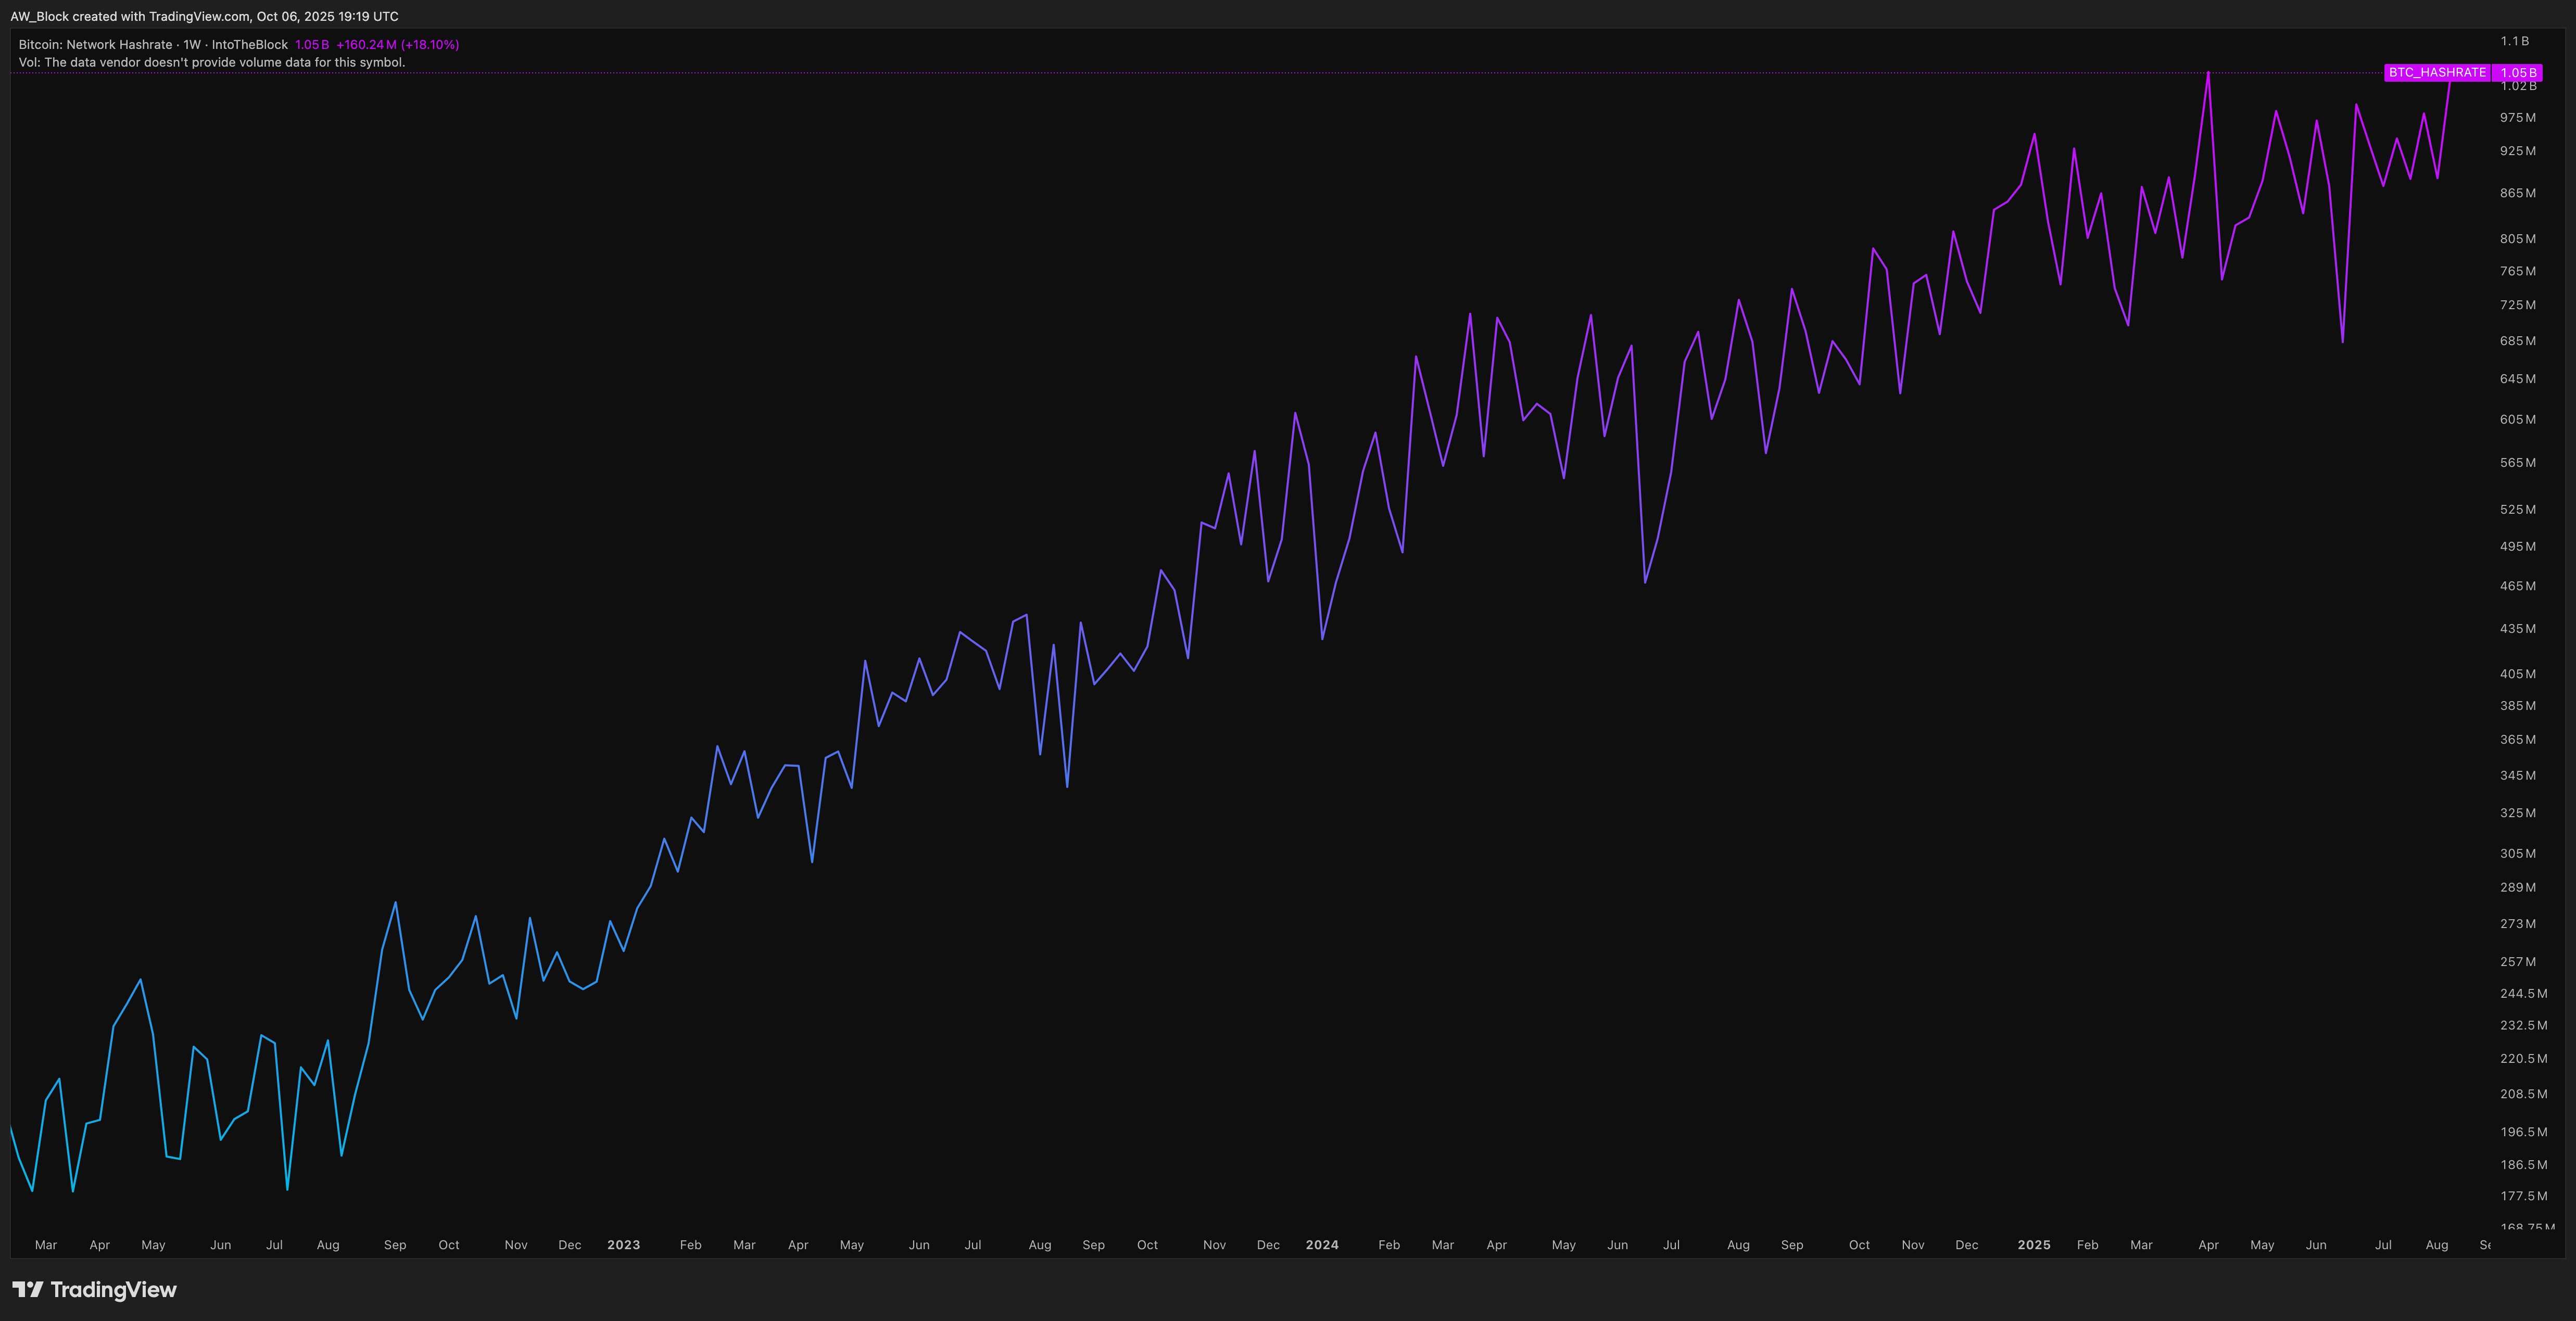
Bitcoin’s hashrate continues its steady climb, setting a new all-time high of 1.12 billion TH/s, up 5.8% from last month. The network shows no signs of slowing down, with higher lows and consistent growth across 2025, reflecting rising miner conviction and continued infrastructure investment globally.
This expansion comes during a period of price consolidation, which is historically a powerful signal. Miners aren’t backing off — they’re scaling up. The 8% reward reduction from April’s halving has been absorbed, and energy-efficient operations, particularly those backed by hydro and flare gas, are taking the lead.
Hashrate strength like this reinforces network security and miner confidence, especially in the mid-cycle phase. The protocol’s energy loop remains intact: energy → security → trust → demand → price → reinvestment.
Miners are clearly pricing in a bullish future. The hashrate is rising ahead of price — just as it has in every prior cycle.
“Hashrate follows belief — and belief is back near all-time highs.”
Average Mining Cost
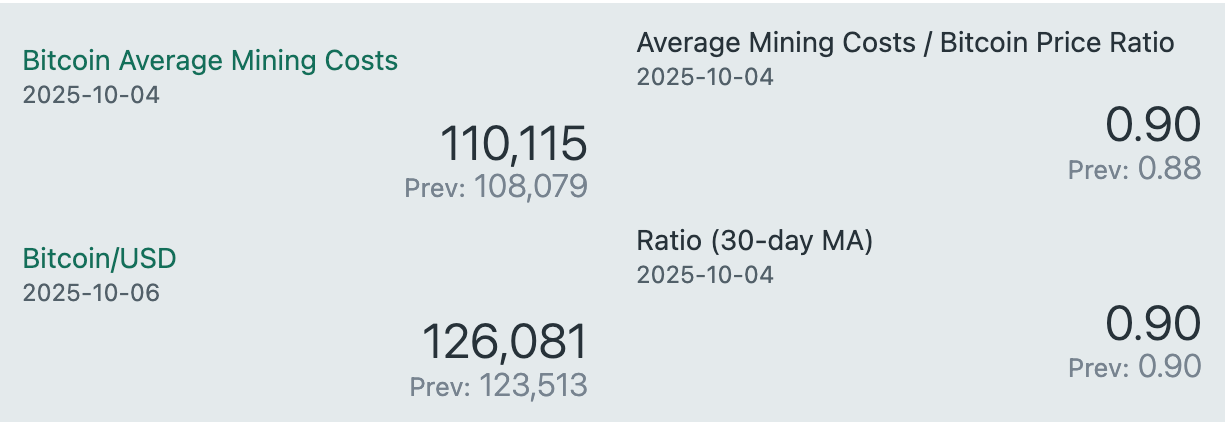
As of October 4, 2025, the average cost to mine one Bitcoin has climbed to $110,115, a sharp increase from $95,368 just one month ago. With Bitcoin trading around $126,081 (as of October 6), the mining cost-to-price ratio has risen to 0.90, and the 30-day moving average holds steady at 0.90 as well.
The rising cost reflects shifting dynamics across the network. Increasing hash rate, difficulty adjustments, and potentially higher input costs are all contributing to this lift. The margin between mining cost and price is still positive, but much tighter than last month when the ratio sat at 0.86. This compression suggests miners are operating with less room for error, particularly those with less efficient operations.
Still, no major signs of stress have emerged. Hash rate remains strong, and the price continues to trend upward. As long as this balance holds, the network remains in healthy territory. If price weakens or input costs rise further, margin pressure could increase for higher-cost operators.
For now, miner conviction appears intact. Rising costs are being met with rising price, maintaining stability in the broader mining economy.
Top Assets By Market Cap
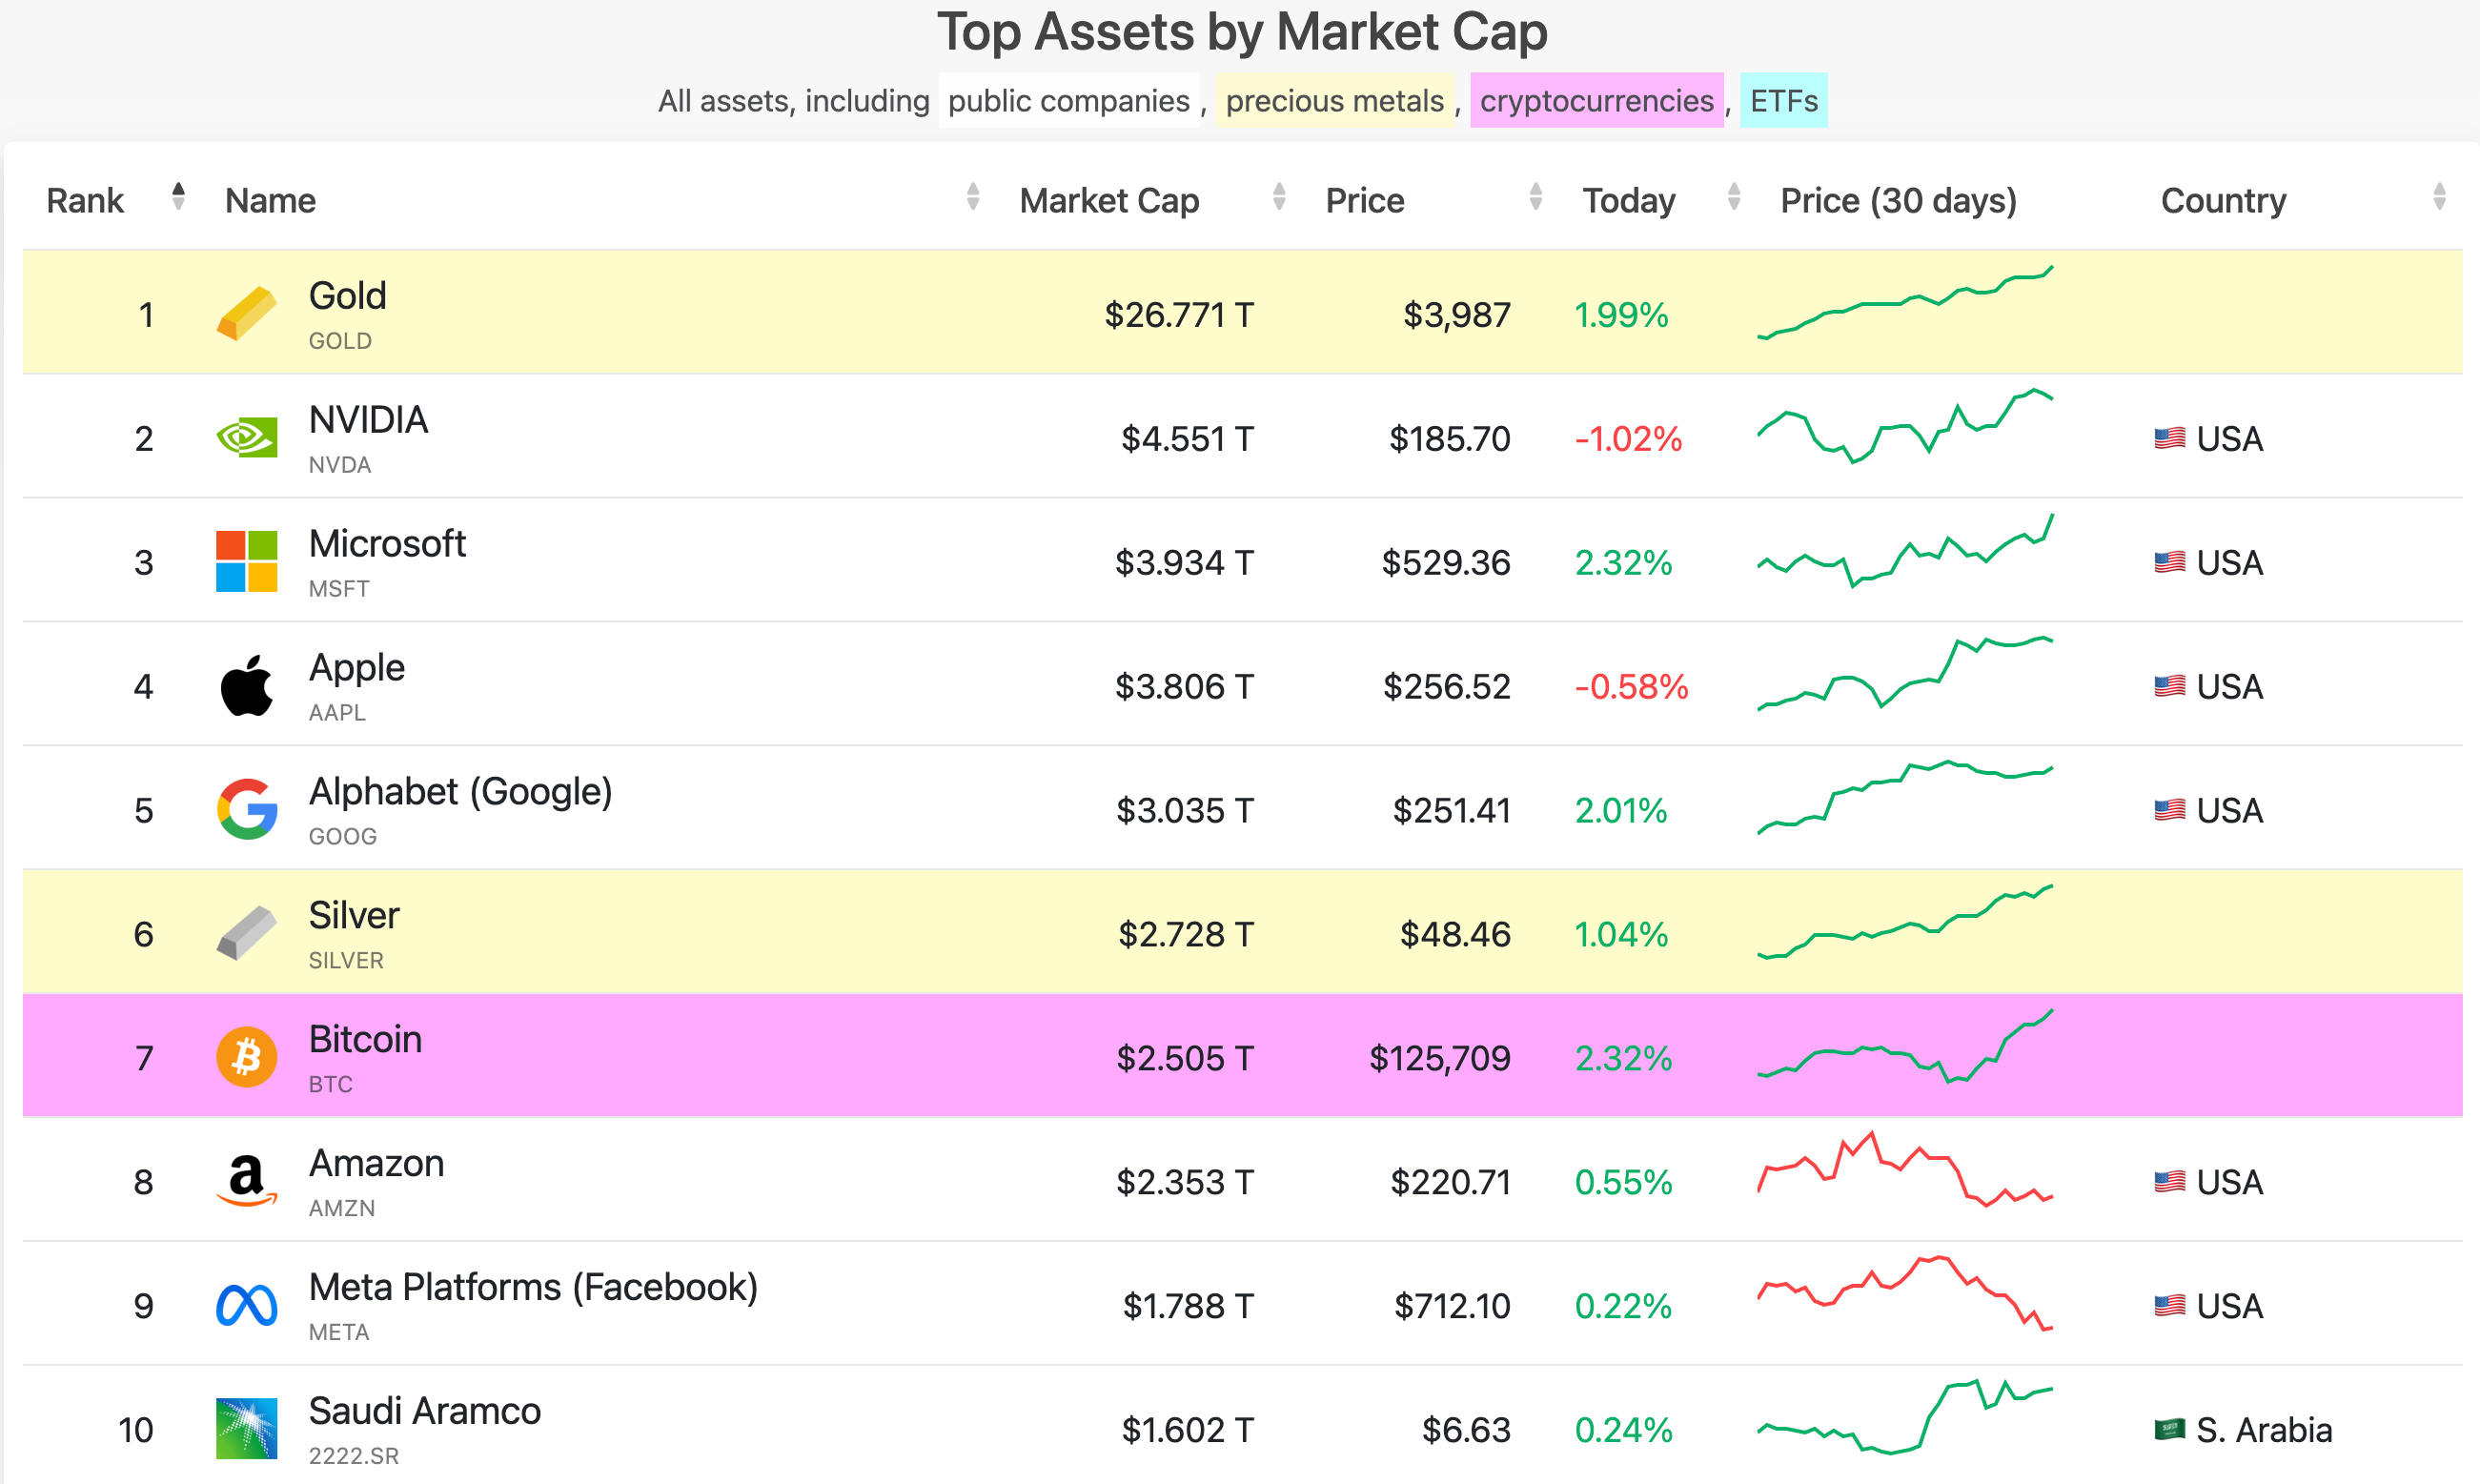
As of October 6, 2025, Bitcoin’s market capitalization has rebounded to approximately $2.505 trillion, securing the #7 position among the world’s largest assets. This marks a strong recovery from last month, when BTC sat at #8 with a market cap of $2.188 trillion.
The climb back above Silver and Amazon reflects both Bitcoin’s recent price strength and its ability to reclaim lost ground amid broader macro and equity market turbulence. At a trading price of roughly $125,709, Bitcoin has reasserted its dominance as a tier-one global asset, continuing to hold its place firmly in the elite $2T+ club.
Its year-long resilience in this upper echelon is more than symbolic. It reinforces Bitcoin’s evolving role as a credible store of value among legacy giants like Gold, Apple, and Microsoft. With market cap expansion aligning with bullish technicals, Bitcoin’s renewed momentum positions it for continued upward repricing in the global capital stack.
Bitcoin News
Highlights from the month of September
Federal Reserve Cuts Interest Rates by 25 Basis Points; Bitcoin Climbs Above $116,000
TL;DR
Bitcoin is in the most historically bullish phase of its cycle. That also means we are likely closer to the top than the bottom, at least in terms of timing. But before any major cooling off, price action still points higher. To the moon!
I just want to take a second and thank those who are sticking around and giving feedback. As you can see there have been slight changes throughout the newsletters thus far but I feel like we’re narrowing it down to what this newsletter should be.
If you have any suggestions, feel free to reach out to me on X. I’m always looking to improve and add value in ways others might enjoy—just keep it Bitcoin only.
Live free and stack sats,
Will
”Bitcoin isn’t about getting your money out of your country. It’s about getting your country out of your money.” - Farbood
What is A.W. Block?
We’re a Bitcoin consulting firm helping clients navigate the complexities of the digital asset world with clarity and confidence. Whether it’s recovering lost funds, developing a long-term Bitcoin accumulation strategy, or mastering market cycles through advanced charting education—we’re here to make your crypto journey seamless, secure, and strategic.
If you’re ready to level up your understanding, protect your wealth, or take control of your Bitcoin future, let’s talk.
awblock.io