

Around the Block | 8
Bitcoin‑Only Macro & Technical Recap for October 2025 — Published November 3, 2025

Another month down, and Bitcoin continues to remind the market who’s in control. It moves through volatility, shrugs off noise, and keeps proving that time in the market beats timing the market. October brought consolidation under resistance, a steady climb in hashrate, and new insight into miner behavior as network costs tightened. In this issue, we’ll break down Bitcoin’s current structure across multiple timeframes, review updated mining data and market positioning, and highlight the key metrics shaping the next move. As always, this is a Bitcoin-only publication with no noise, no distractions, and nothing off-topic.
None of this is financial advice.
Don’t trust, verify.
Let’s dive in.
Key Technical Terms
EMA (Exponential Moving Average):
A moving average that gives more weight to recent price data, making it react faster to short-term changes in market direction. Traders use EMAs (like the 8 or 34) to gauge momentum, identify pullbacks, and spot early trend shifts.
MA (Moving Average):
A smoothed line showing the average closing price over a chosen period (e.g., 50 or 200 candles). It filters out noise and helps identify the broader trend — whether the market is generally rising, falling, or consolidating.
Candlestick Patterns:
Visual formations created by individual or groups of candlesticks that represent market psychology — showing where buyers or sellers gained control. Examples include:
Hammer / Shooting Star: Potential reversal signals
Bullish / Bearish Engulfing: Momentum shift indicators
Doji: Market indecision
Together, EMAs, MAs, and candlestick patterns give a full picture of trend strength, momentum, and sentiment — essential for understanding where price may go next.
The Technicals
Monthly
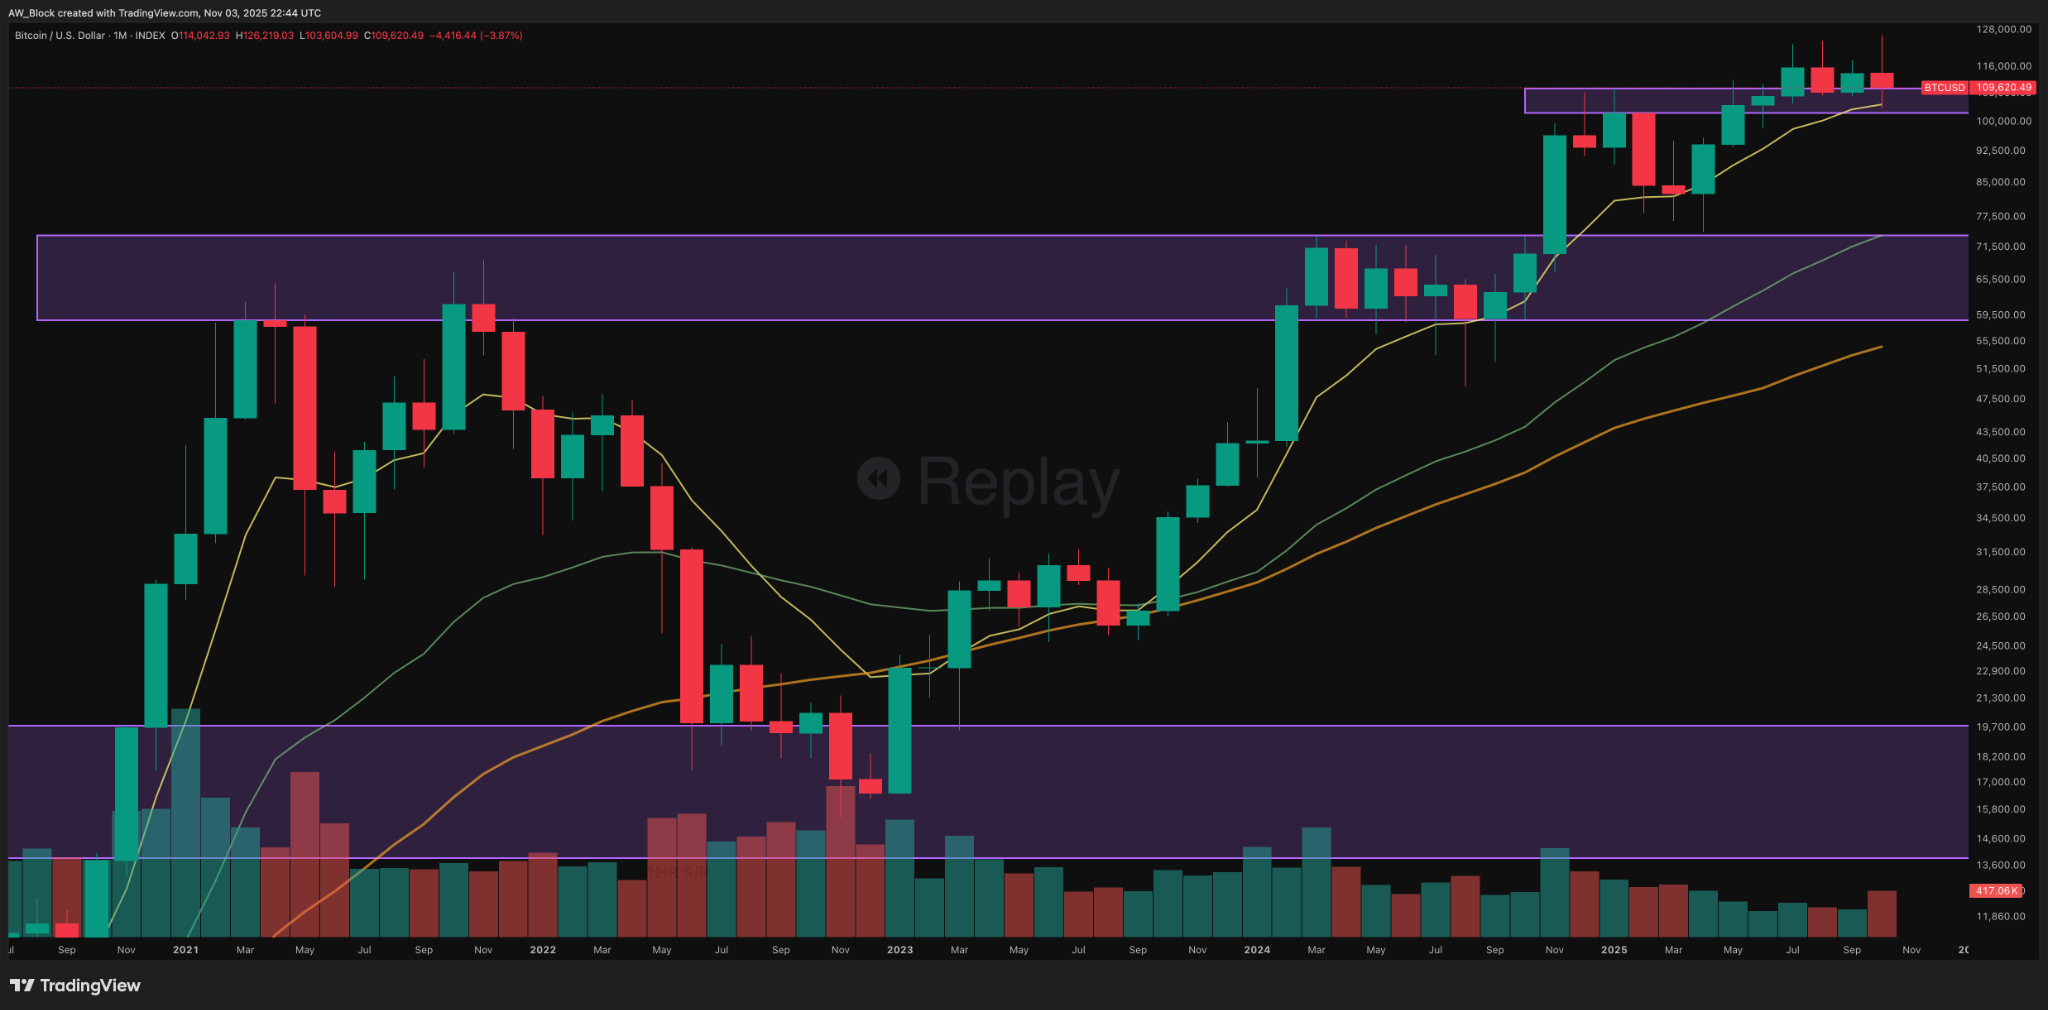
Monthly Chart Overview — Closing Price: $109,620.49
Key Monthly Levels:
M S/R (Upper): ≈ $123K → Recent rejection zone / upper resistance block.
M S/R (Mid-Zone): $102.4K–$109.4K → Key demand zone / current retest area.
M S/R (Base): $59K–$74K → Prior resistance turned macro support.
8 EMA: ≈ $105K → Immediate dynamic support now under test.
34 EMA: ≈ $74K → Mid-trend equilibrium / bullish control line.
50 MA: ≈ $55K → Long-term structural trend anchor.
Structure & S/R Zones
October’s monthly candle closed bearish, continuing a series of intermittent red closes within the broader uptrend. Structurally, Bitcoin retraced from the ≈$123K upper resistance and settled back toward the $102.4K–$109.4K mid-zone, aligning closely with an 8 EMA retest.
This behavior aligns with Schabacker’s “change of polarity” principle — a former breakout area now functioning as structural support. Despite the rejection, the macro structure remains intact and bullish, showing a controlled correction following months of impulsive expansion. The sequence of higher highs and higher lows persists, reflecting a standard pause within a maturing bullish cycle rather than the start of reversal distribution.
Candlestick Patterns
The October bar printed a bearish rejection candle with a notable upper shadow, representing supply pressure near the highs.
Psychology: Buyers lost short-term control near the prior cycle high, prompting profit-taking and mean reversion.
Confirmation: Close below $105K would have escalated downside pressure, but buyers defended the 8 EMA.
Interpretation: Nison would frame this as a controlled rejection, signaling equilibrium rather than full reversal momentum.
Chart Patterns
Price action persists inside a rectangle-style re-accumulation between $107K–$125K following an impulsive advance.
Bias: Continuation pattern within an uptrend.
Bulkowski guidance: Rectangle continuations break upward a majority of the time.
Measured move on breakout: ≈ $145K–$150K above $125K.
Failure condition: A decisive monthly close below $106K opens a path toward $95K; deeper risk is the $72K 34 EMA zone.
Moving Averages
8 EMA: ≈ $105K — first clean retest in months; key line for momentum retention.
34 EMA: ≈ $74K — rising and well below price, confirming mid-trend strength.
50 MA: ≈ $55K — upward slope; long-term structure intact.
Alignment: 8 > 34 > 50 > 200 → bullish stack preserved.
Phase: Consolidation / retracement under resistance, not distribution.
Volume Context
October showed modest volume contraction during the pullback — consistent with a low-conviction retest rather than distribution. The contraction supports a contraction → expansion setup once the range resolves.
Market Psychology
Sentiment cooled from confidence to caution at range highs. The disciplined approach is to treat this as a probabilistic pause inside a strong trend, not to anticipate tops.
“Trading is not about being right or wrong. It’s about managing information and probabilities.” — Mark Douglas
Weekly
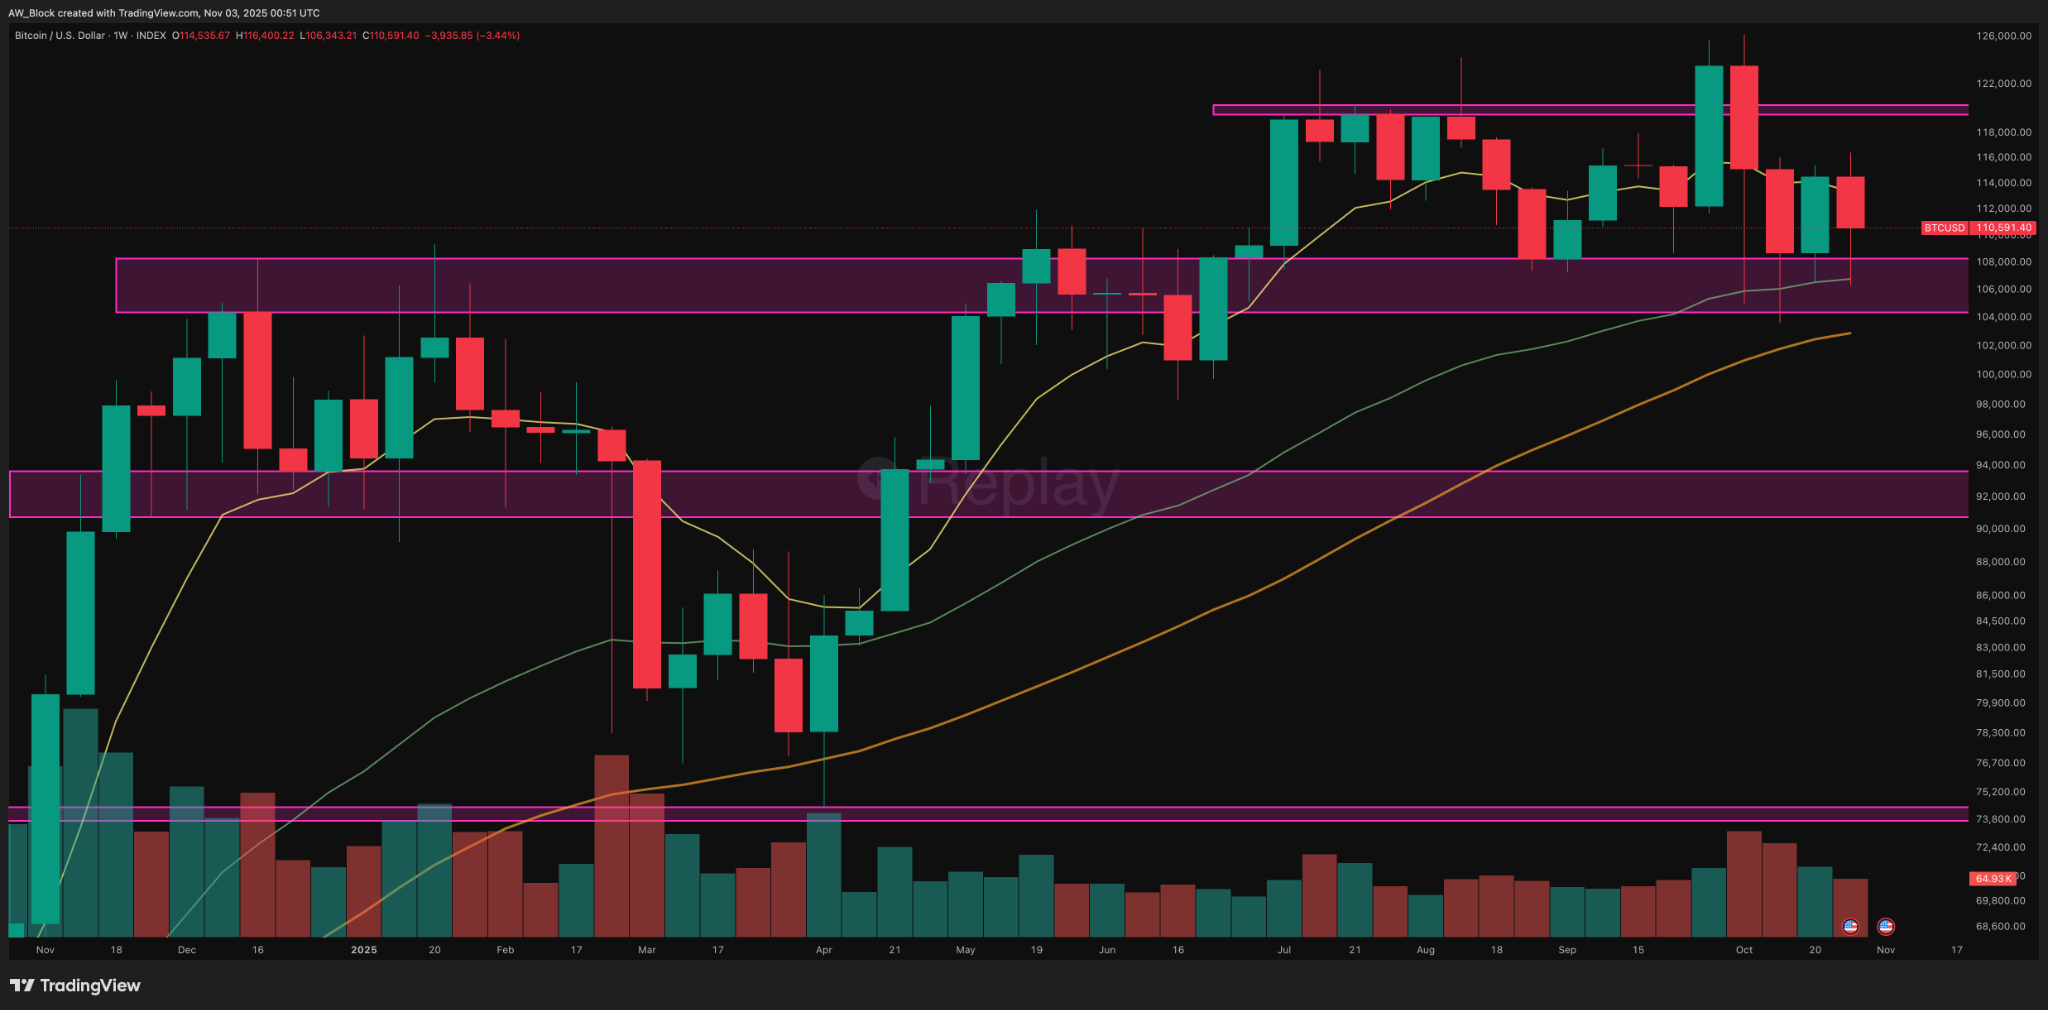
Weekly Chart Overview — Closing Price: $110,591.40
Key Weekly Levels:
W S/R: $19.5 K–$120.2 K → Rejection zone / upper range resistance
W S/R: $104.3 K–$108.2 K → Active demand zone / mid-range support
W S/R: $91 K–$94 K → Deep-cycle structural support
8 EMA: ≈ $113.3 K → Immediate short-term resistance
34 EMA: ≈ $106.7 K → Rising equilibrium / current support zone
50 MA: ≈ $103 K → Long-term directional anchor
200 MA: ≈ $54.7 K → Macro bull-market foundation
Structure & S/R Zones
Bitcoin continues to range between $106 K and $125 K, with the latest candle closing red but maintaining support above the $108 K–$110 K mid-range block.
This confirms that the rectangular reaccumulation structure remains intact, despite multiple failed breakout attempts above $121 K.
The current behavior represents a sideways digestion phase within a macro uptrend, consistent with Schabacker’s “consolidation plateau” following a strong advance.
Trend Structure
The sequence of higher lows since April 2025 remains unbroken.
The 34 EMA continues to rise beneath price, offering dynamic structure.
Price is compressing between the 8 EMA and 34 EMA, forming a coiling range ahead of the next expansion.
Candlestick Patterns
This week’s candle is a bullish reversal bar.
The real body takes up a notable portion of the range, which disqualifies it as a spinning top (those require much smaller bodies).
The long lower shadow signals firm rejection of sub-support pricing, as buyers absorbed intraperiod selling around $106 K–$108 K.
The short upper wick and moderate close confirm buyer defense and re-entry at structure support.
In Nison’s taxonomy this fits closest to an umbrella-line / hammer variant, implying a short-term reversal or base confirmation depending on next-week follow-through.
Nison parallel: “When a market probes for weakness and closes near the highs of the session, demand has stepped in to absorb the fear.”
Chart Patterns
Price continues to respect the rectangle reaccumulation formation ($106 K–$125 K).
Support remains firm at $107 K–$110 K after repeated tests.
Bulkowski’s data shows rectangles in uptrends break upward ≈ 68 % of the time, and current price action remains consistent with that probability.
Until breakout confirmation, the range remains a continuation pattern in development with EMAs compressing.
Measured Move Projection: Break above $125 K → $135 K–$140 K.
Moving Averages
8 EMA: ≈ $113.3 K — flattening near resistance; key level for short-term momentum recovery.
34 EMA: ≈ $106.7 K — rising and aligning with midrange support; trend equilibrium intact.
50 MA: ≈ $103 K — steady upward slope; confirms structural base.
200 MA: ≈ $54.7 K — far below price; defines long-term bull-market floor.
Alignment: 8 > 34 > 50 > 200 → bullish stack preserved.
Phase: Sideways consolidation / trend compression within reaccumulation, not distribution.
Volume Context
Weekly volume declined relative to the prior sessions, reflecting the continued contraction typical of a maturing reaccumulation range. The reduction in sell pressure confirms that recent price weakness is being absorbed rather than distributed. The most notable participation remains concentrated around the $106 K–$110 K zone, where prior spikes signaled institutional defense of midrange support. This tapering of volume activity, paired with firm structure retention above the 34 EMA, fits Bulkowski’s continuation criteria, contraction before expansion. In essence, the market is in the quiet phase of compression, preparing for the next directional expansion once the $121 K ceiling gives way.
Market Psychology
Market sentiment is defined by impatience and disbelief as the range drags on.
Douglas notes that this period represents the emotional shift from frustration to readiness:
“The longer a market consolidates, the more powerful the move that follows.” — Mark Douglas
Confidence here means alignment with probabilities, not prediction — patience through range builds edge for the eventual breakout.
Summary & Outlook
Neutral / Range-Bound Reaccumulation (Primary Scenario)
Conditions: Consolidation $107 K–$121 K with EMA compression.
Expectation: Sideways to upward bias.
Invalidation: Weekly close < $106 K (34 EMA).
Bullish Continuation
Conditions: Weekly close > $121 K–$122 K; breakout confirmation.
Target: $135 K–$140 K (measured move).
Bearish Scenario (Low Probability)
Conditions: Breakdown < $106 K with volume expansion.
Target: $94 K (50 MA) or lower S/R block ($91 K–$94 K).
Bitcoin remains range-bound but structurally strong.
The 34 EMA and $107 K support continue to hold while price compresses beneath $121 K. Momentum tightening between 8 EMA and 34 EMA indicates energy buildup for major expansion.
BTC/USD remains in a neutral-to-bullish reaccumulation phase, with the macro trend unchanged and upside continuation favored on a confirmed close above $121 K.
Daily
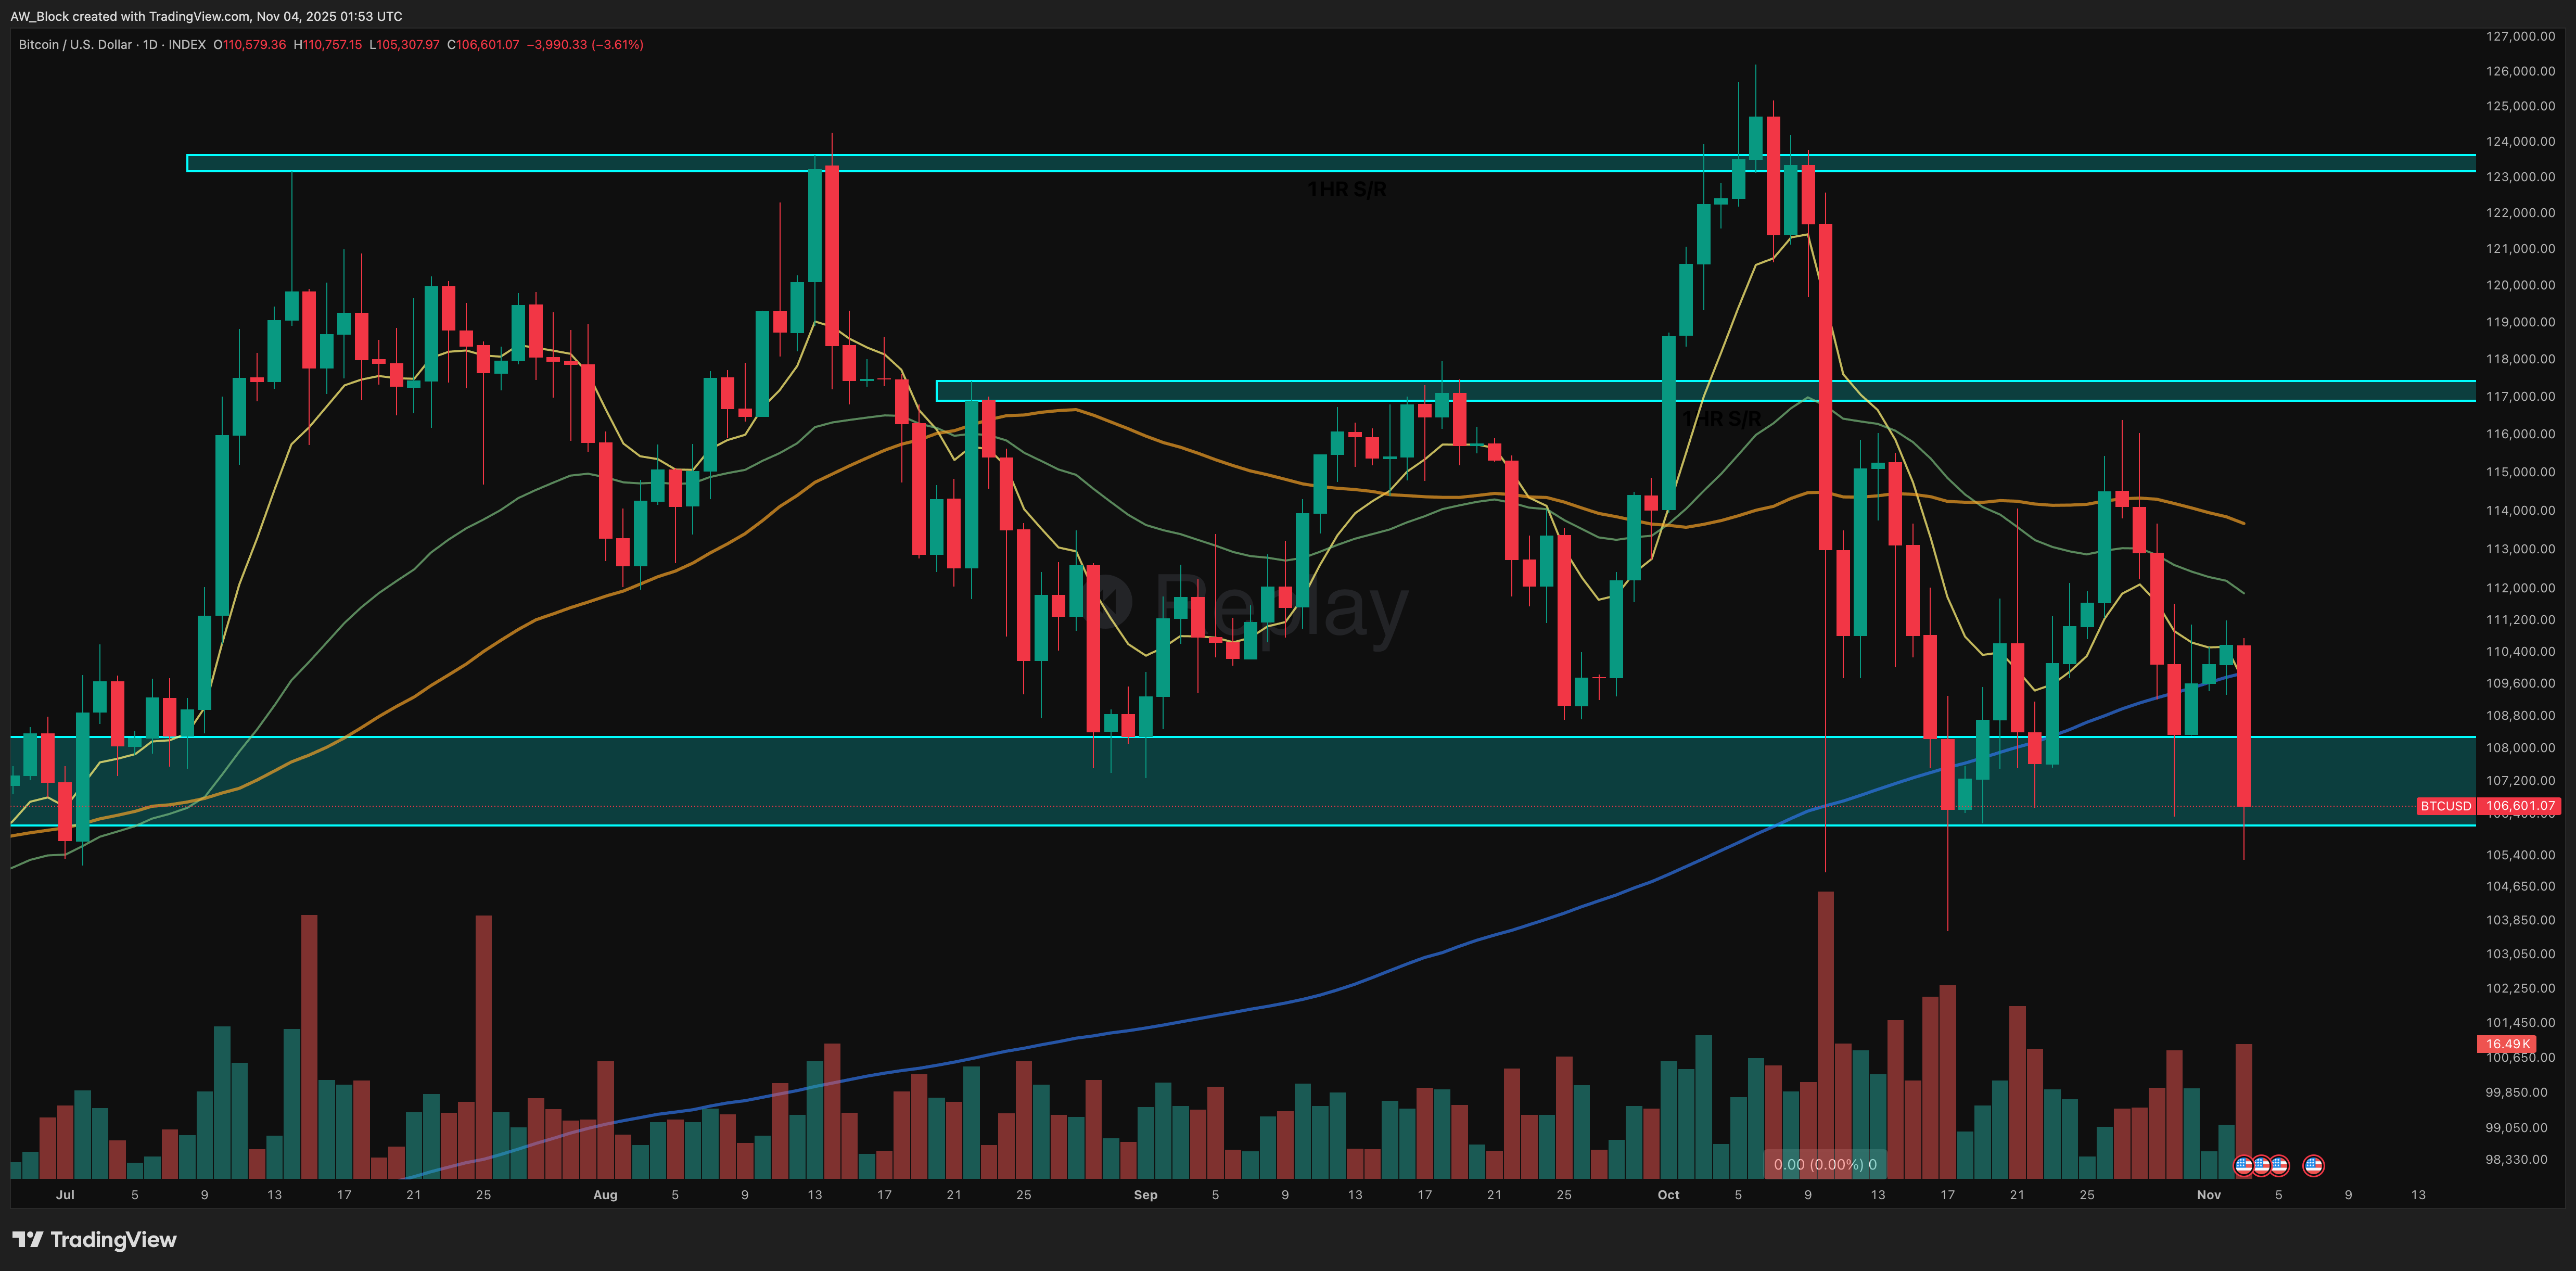
Daily Chart Overview — Closing Price: $106,601.07
Key Weekly Levels:
D S/R: $111K–$112K → failed retest, now resistance.
M S/R: $106K–$107K → current support and 200MA confluence.
W S/R: $122K–$125K → upper distribution range.
8 EMA: $109.5K
34 EMA: $112.8K
50 MA: $113.7K
200 MA: $109.8K
Structure & S/R Zones
Bitcoin has rejected cleanly from the $111K–$112K daily zone — a decisive failure at prior structure resistance that now reaffirms distribution behavior.
Today’s breakdown candle pushed back into the $106K–$107K monthly base, aligning with the 200-day MA, suggesting the market is once again testing cycle support.
This confirms a continuation of the lower-high, lower-low sequence, with structural pressure shifting back to sellers. The rejection from the 34EMA / 50MA zone indicates a failure of short-term bullish momentum and a resumption of corrective structure within the larger $106K–$122K rectangle.
Candlestick Patterns
Today’s session printed a wide-bodied bearish candle, engulfing the prior two sessions’ range — a classic bearish engulfing pattern that confirms renewed downside intent.
Psychology: Buyers were unable to defend the short-term 8EMA zone, capitulating under renewed sell volume.
Pattern classification: Reversal confirmation at resistance (Nison) — particularly potent after a failed retest.
Confirmation: Daily close below $106K opens risk to full range extension lower.
Invalidation: Recovery above $111K with volume expansion.
This mirrors Nison’s description of “confirmation by bearish follow-through at resistance after a short-lived rebound.”
Chart Patterns
The broader rectangle structure ($106K–$122K) remains intact, but current movement reflects a mid-range failure pattern.
Bulkowski statistics: Bearish breakouts from rectangles occur ≈46% of the time but often accelerate after multiple failed upper retests.
Measured projection: Breakdown below $106K projects ≈$99K — aligning with prior mid-summer accumulation.
Failure condition: Strong reversal close >$112K (neutralizes downside projection).
Moving Averages
8 EMA: $109.5K — rolling over beneath 34EMA → bearish momentum signal.
34 EMA: $112.8K — declining; aligns with resistance.
50 MA: $113.7K — flat-to-down; confirms medium-term weakness.
200 MA: $109.8K — rising, currently being tested as support.
Volume Context
Volume expanded notably on the breakdown, confirming participation-driven selling pressure. The reaction is not isolated; rather, it reflects broader market distribution since the October peak near $125K.
The rising red volume bar suggests supply dominance.
The move invalidates prior low-volume rebound attempts from $107K–$108K.
This validates Bulkowski’s “expansion after contraction” behavior — with volatility and volume rising together as direction asserts itself.
Market Psychology
Market sentiment has transitioned from cautious optimism back to defensive disbelief. The rejection from mid-range has reinforced traders’ hesitation, leading to renewed risk aversion near the 200MA.
“The market doesn’t punish you for being wrong; it punishes you for staying wrong.” — Mark Douglas
A disciplined participant accepts the reemergence of downside probability and avoids anchoring to recent bullish bias. Emotional attachment to “the base holding” creates vulnerability when structural evidence points otherwise.
Summary & Outlook
Bullish Continuation (Low Probability)
Conditions: Immediate defense and reclaim of $111K.
Target: $115K–$118K (EMA cluster).
Invalidation: Daily close below $106K.
Neutral / Retest Scenario
Conditions: Holding within $106K–$107K band.
Expectation: Temporary stabilization near 200MA; limited upside until $111K reclaimed.
Bearish Scenario (Primary)
Conditions: Close below $106K.
Target: $99K–$101K measured projection.
Confirmation: Volume expansion on breakdown.
Bitcoin’s daily chart has transitioned back into a defensive posture, rejecting cleanly from the mid-range and 34EMA resistance cluster. The wide-bodied bearish candle, aligned with volume expansion, reinforces supply control. The 200MA remains the final structural support — its defense or failure will determine whether this corrective phase evolves into a full distribution breakdown toward $99K or stabilizes into base consolidation once more.
Bitcoin / Gold
I’m adding this section to the newsletter because Bitcoin and gold represent two forms of sound money separated by time and technology. Gold anchored the physical age of value, while Bitcoin anchors the digital one. Both are scarce, both exist outside the control of governments, and both challenge fiat systems built on trust and debt. Comparing them isn’t about picking sides, it’s about understanding how the concept of sound money is evolving from what was once mined from the earth to what is now mined from energy and time.
This section will focus primarily on technical analysis, similar to the charts above, but I’ll include any additional insights, notable developments, and/or possibly educational tidbits as they come up.
Monthly
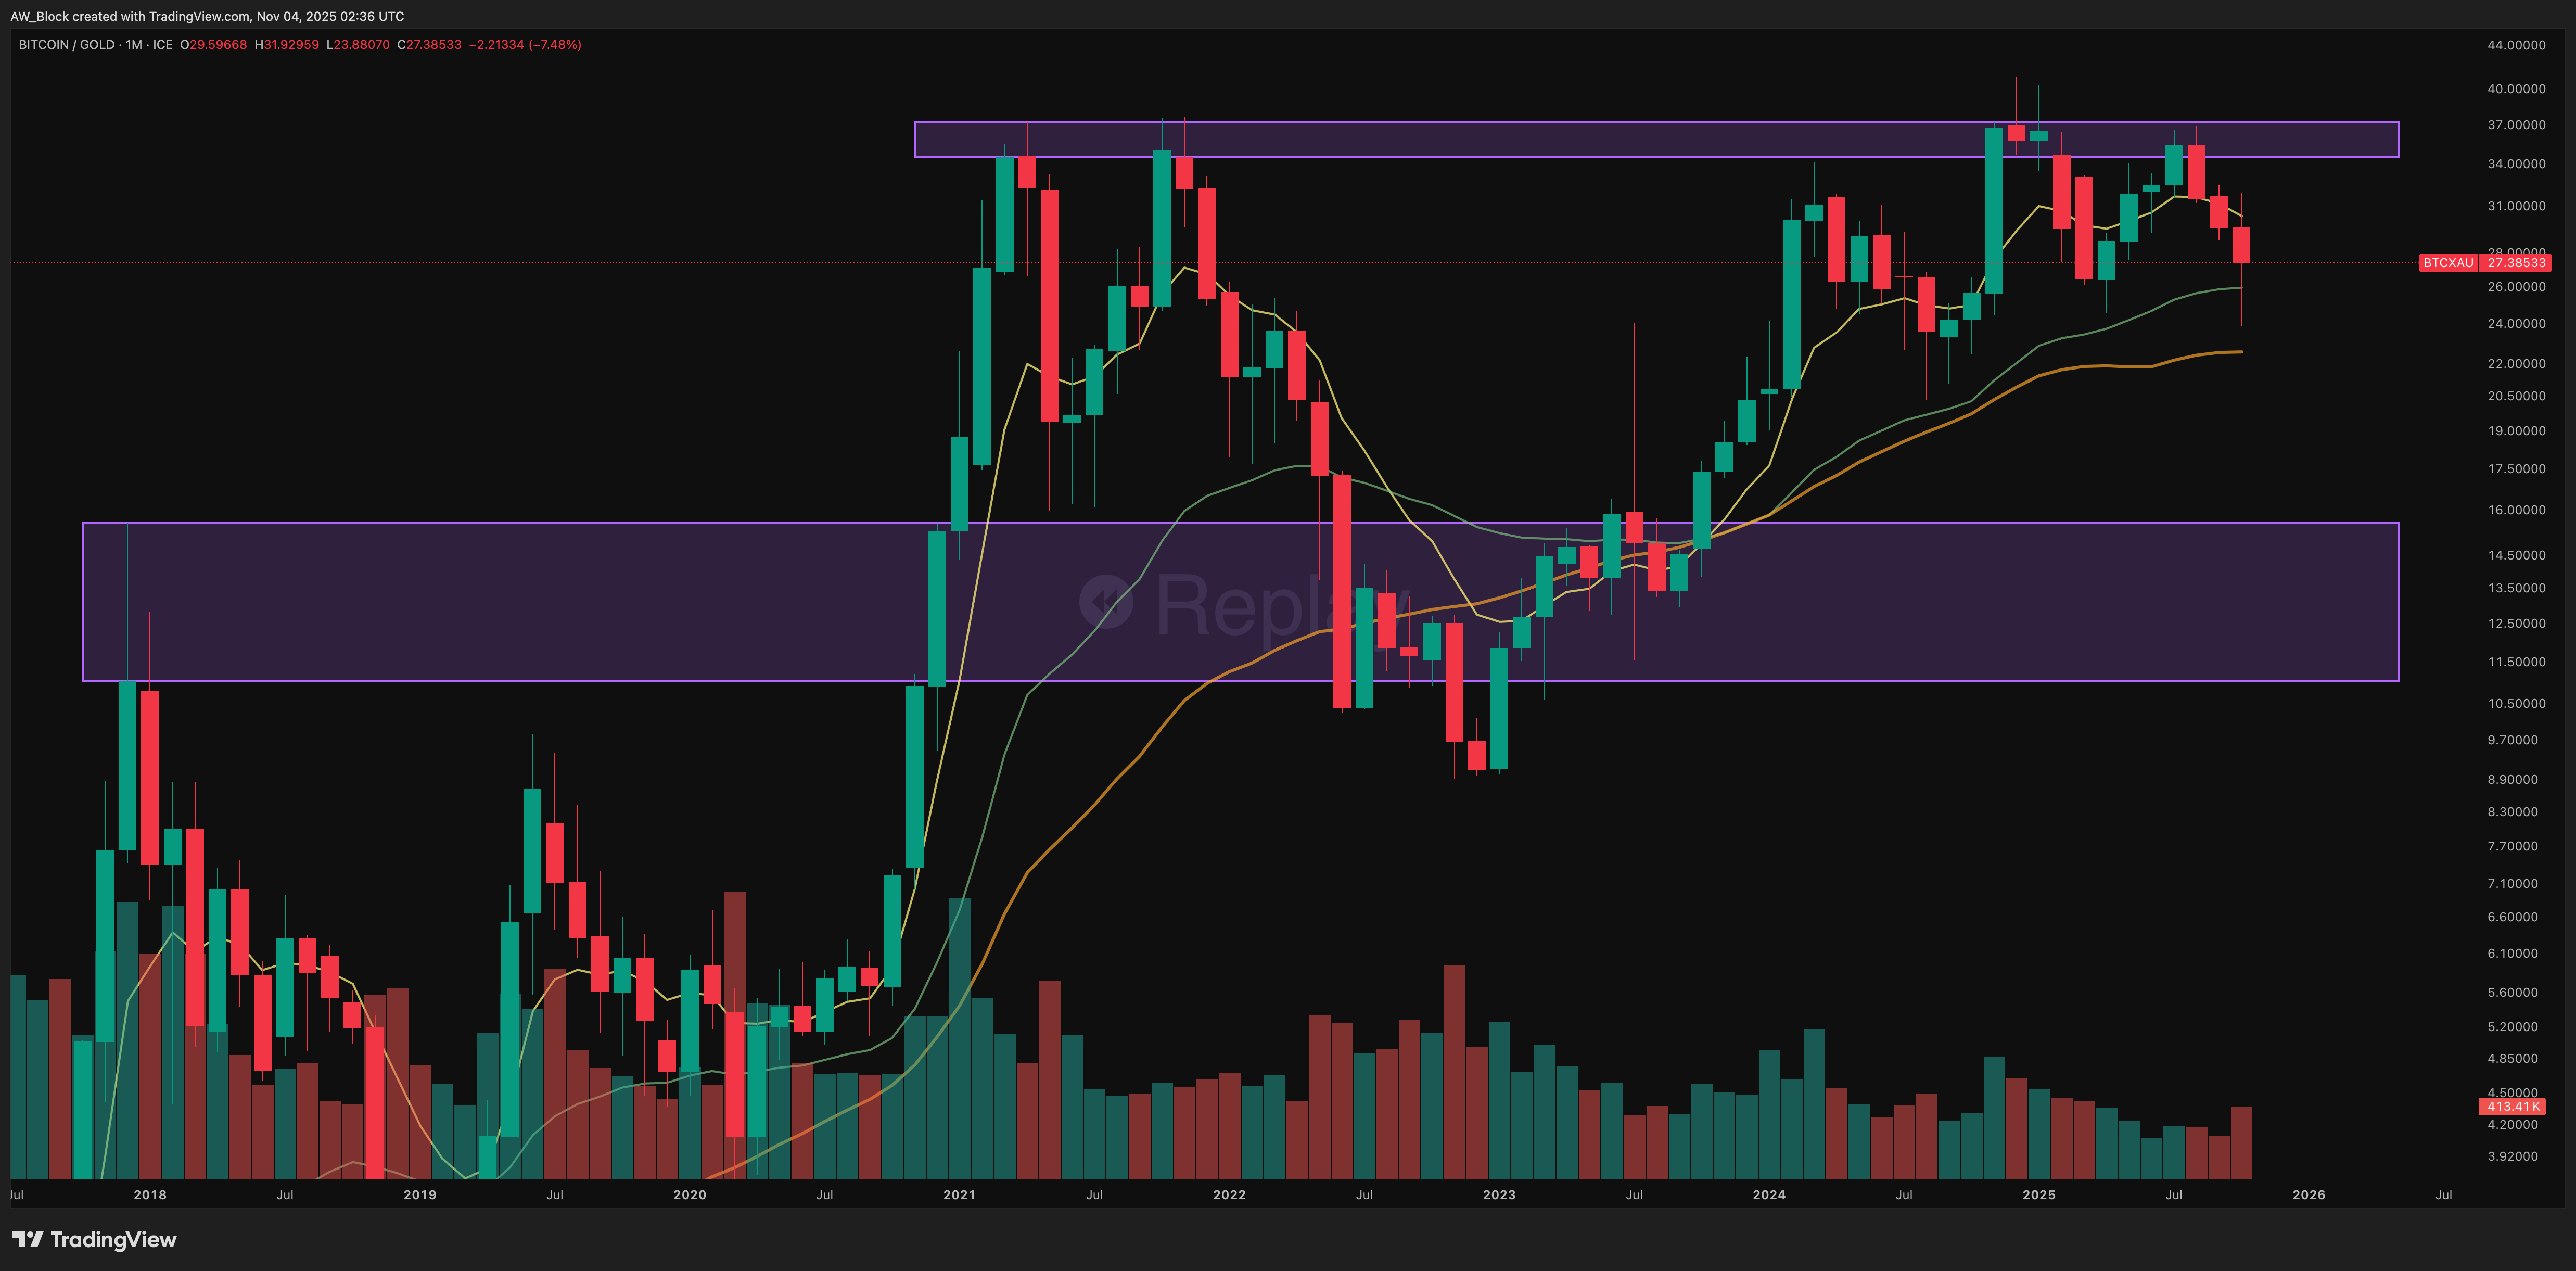
Bitcoin’s relative performance against gold remains structurally bullish over the 2020–2025 horizon, though momentum has shifted toward gold recently. The 25–26 support area represents the cycle’s equilibrium point where dominance could rotate again. Sustained stability above this zone will reinforce Bitcoin’s broader leadership narrative into 2026.
Bitcoin improves on gold by perfecting its monetary properties. It matches gold’s scarcity but adds portability, divisibility, and verifiability. You can send any amount across the world in minutes, audit the total supply instantly, and store it without trusted custodians. Bitcoin is sound money built for a digital economy.
The Fundamentals
Hashrate
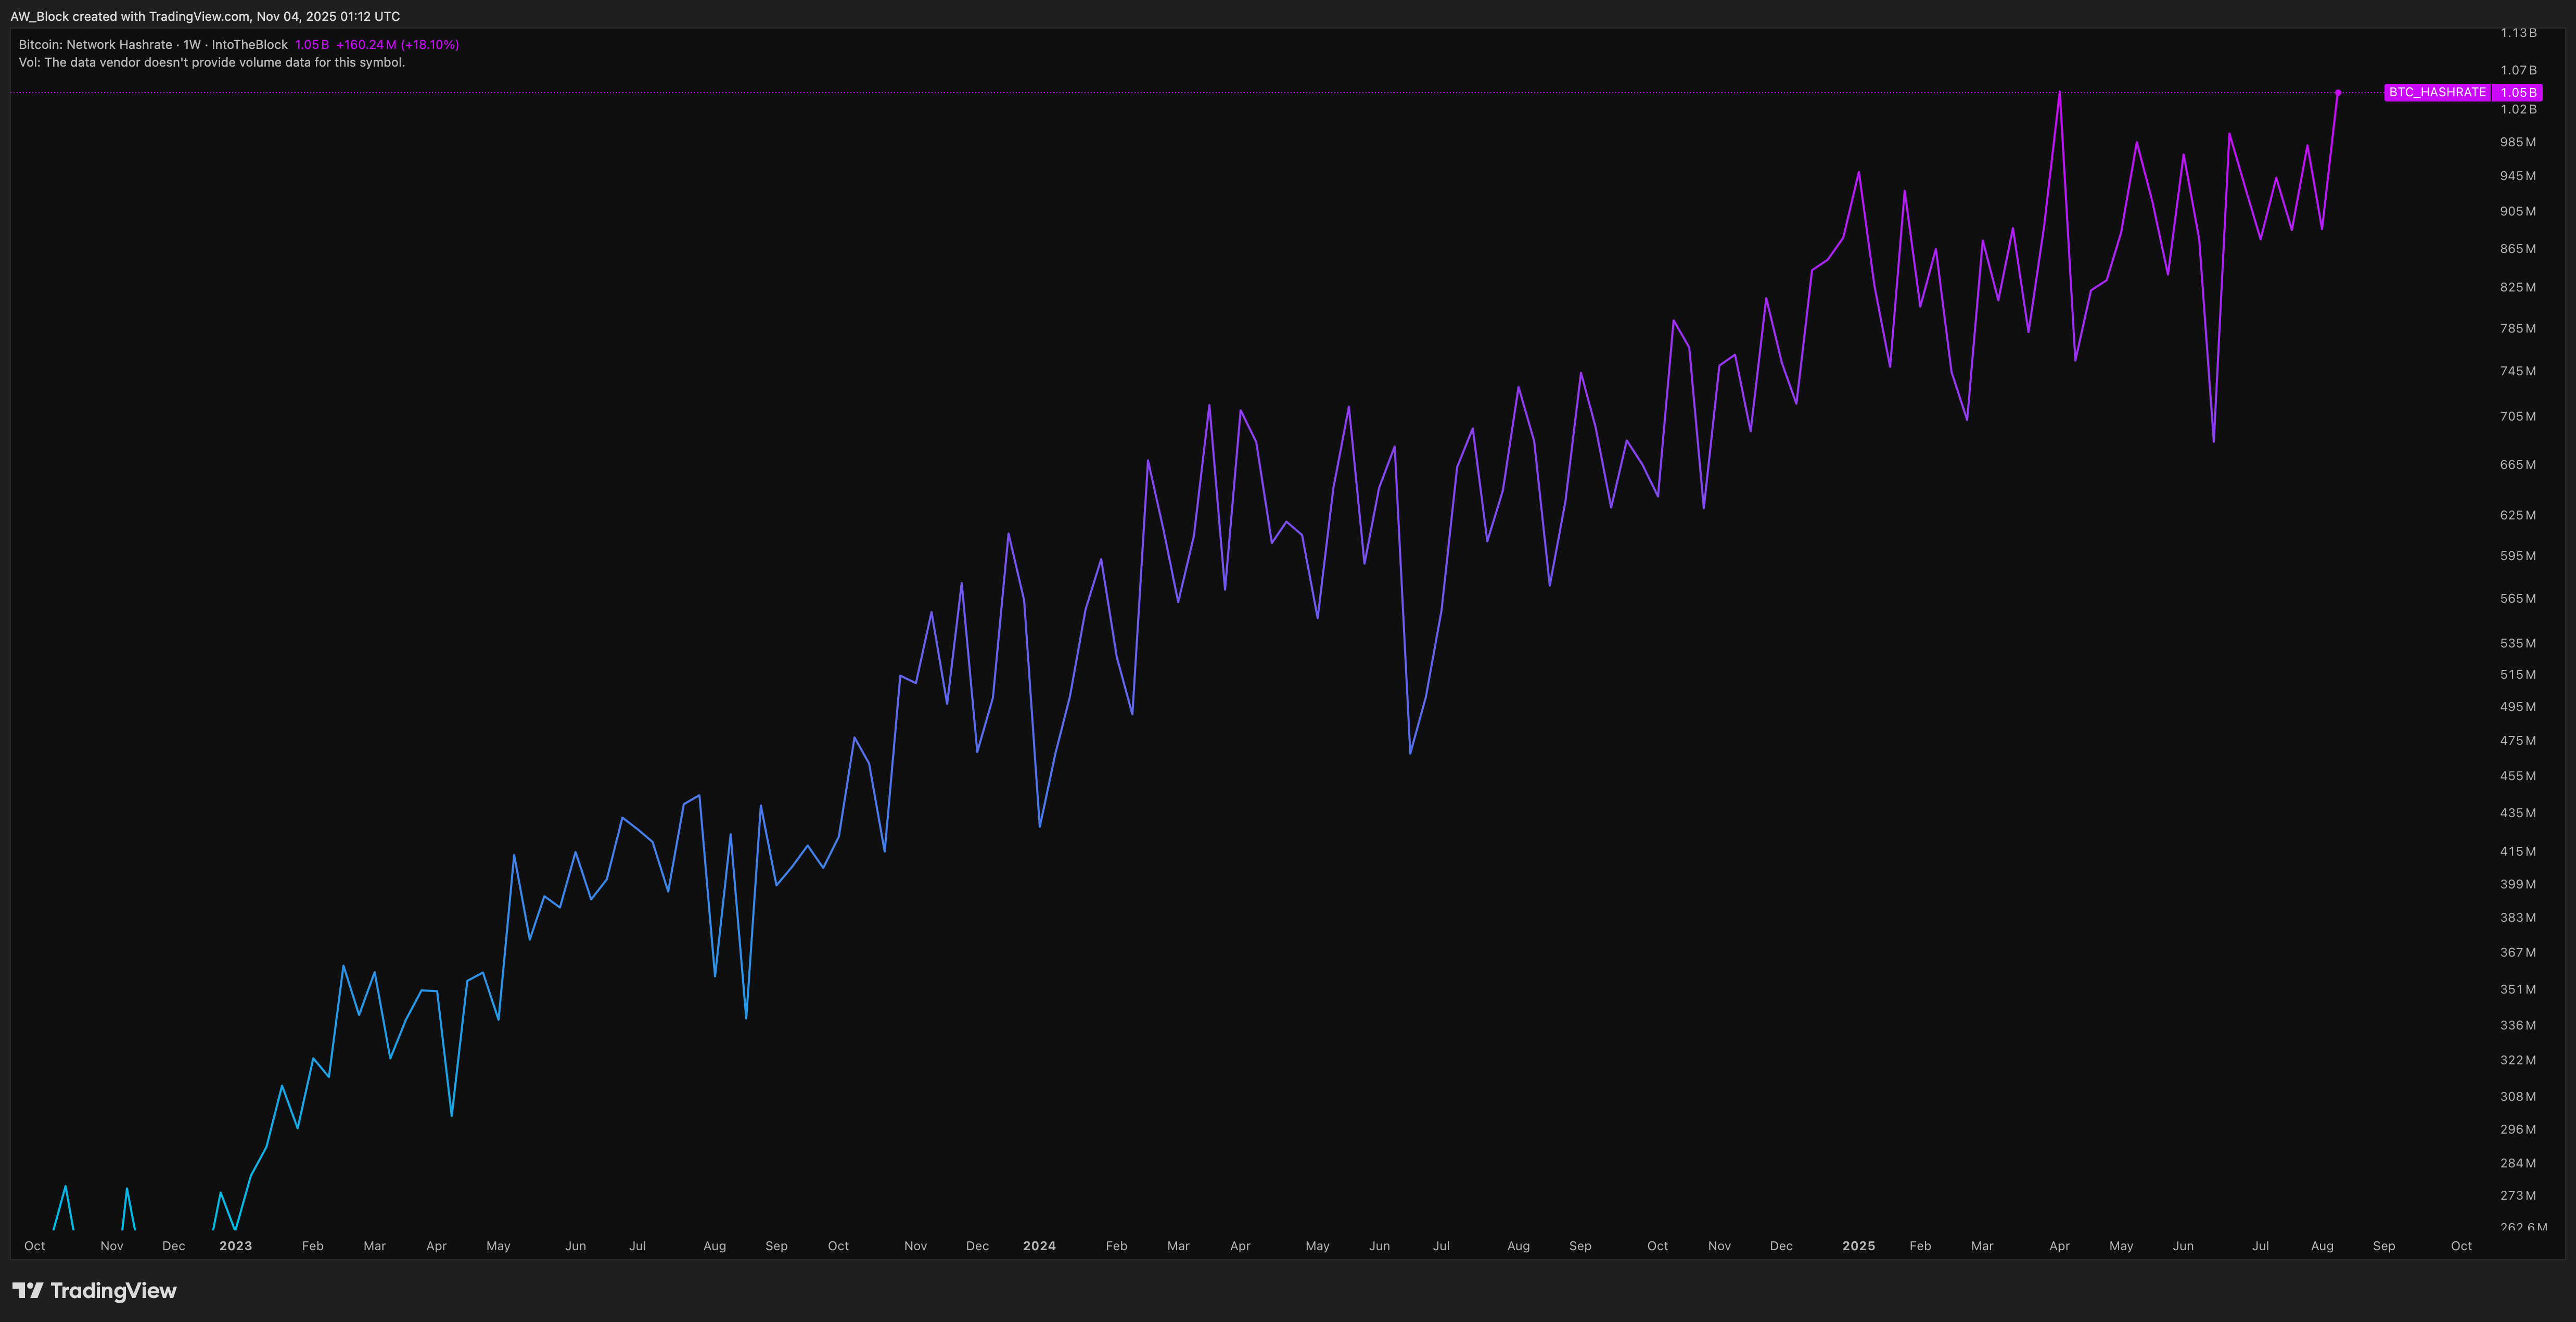
Bitcoin’s hashrate has once again set a new all-time high, now reaching 1.08 billion TH/s, up 1.6% from last month’s record. The network’s steady climb continues to underscore miner confidence, with no visible signs of slowdown despite tightening profitability and increased production costs.
This ongoing expansion, even as the market consolidates, reinforces the long-term health of the network. The April halving’s impact has been fully absorbed, and miners continue to deploy capital into more efficient rigs and renewable energy sources. Operations powered by hydro, nuclear, and flare gas remain particularly strong, helping maintain hashrate growth without major cost disruptions.
Historically, sustained hashrate growth during price pullbacks has been a bullish structural signal. It reflects miners’ conviction in Bitcoin’s future value — a belief strong enough to keep investing even when short-term margins compress.
The protocol’s energy loop remains firmly intact: energy → security → trust → demand → price → reinvestment. Each upward step in hashrate deepens Bitcoin’s security moat, reinforcing its role as the world’s most secure and decentralized financial network.
Miner behavior suggests continued faith in the cycle ahead. While price action has cooled, conviction hasn’t — hashrate follows belief, and belief is still climbing.
Average Mining Cost
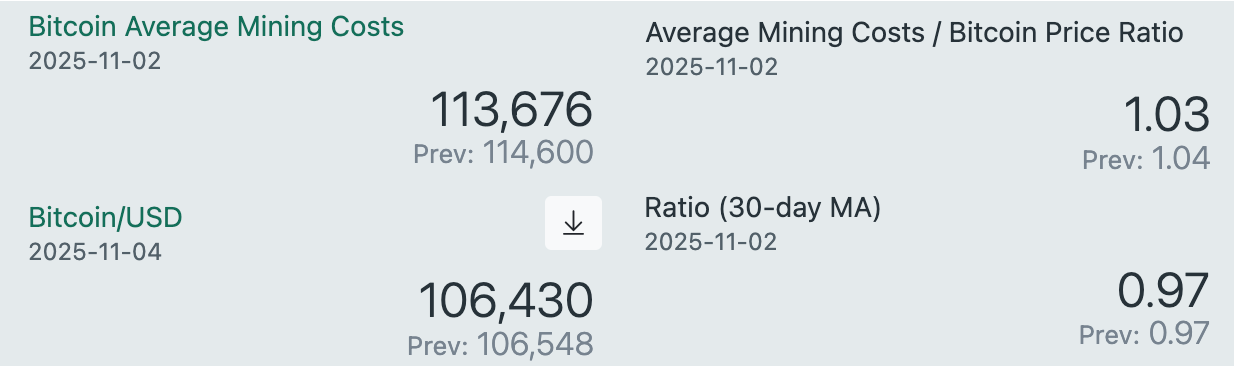
As of November 2, 2025, the average cost to mine one Bitcoin is estimated at $113,676, only a slight decrease from last month’s $114,600. With Bitcoin currently trading around $106,430 (as of November 4), the mining cost-to-price ratio has climbed to 1.03, while the 30-day moving average of the ratio remains steady at 0.97.
This marks the first time in several months that the estimated production cost has exceeded the spot price, creating short-term margin compression for miners. When mining costs run higher than market value, weaker operators often face increased financial strain, while more efficient firms continue accumulating hashpower and market share.
The elevated cost structure reflects persistently high network difficulty and energy input costs, even as hashrate continues to trend near all-time highs. Despite tighter margins, there are no visible signs of miner capitulation — block production remains stable, and the network’s total hashpower has not meaningfully declined.
Historically, periods where price dips below average production cost tend to mark cyclical equilibrium points rather than long-term stress events. As long as Bitcoin remains within this range, miner resilience and network confidence continue to hold.
Top Assets By Market Cap
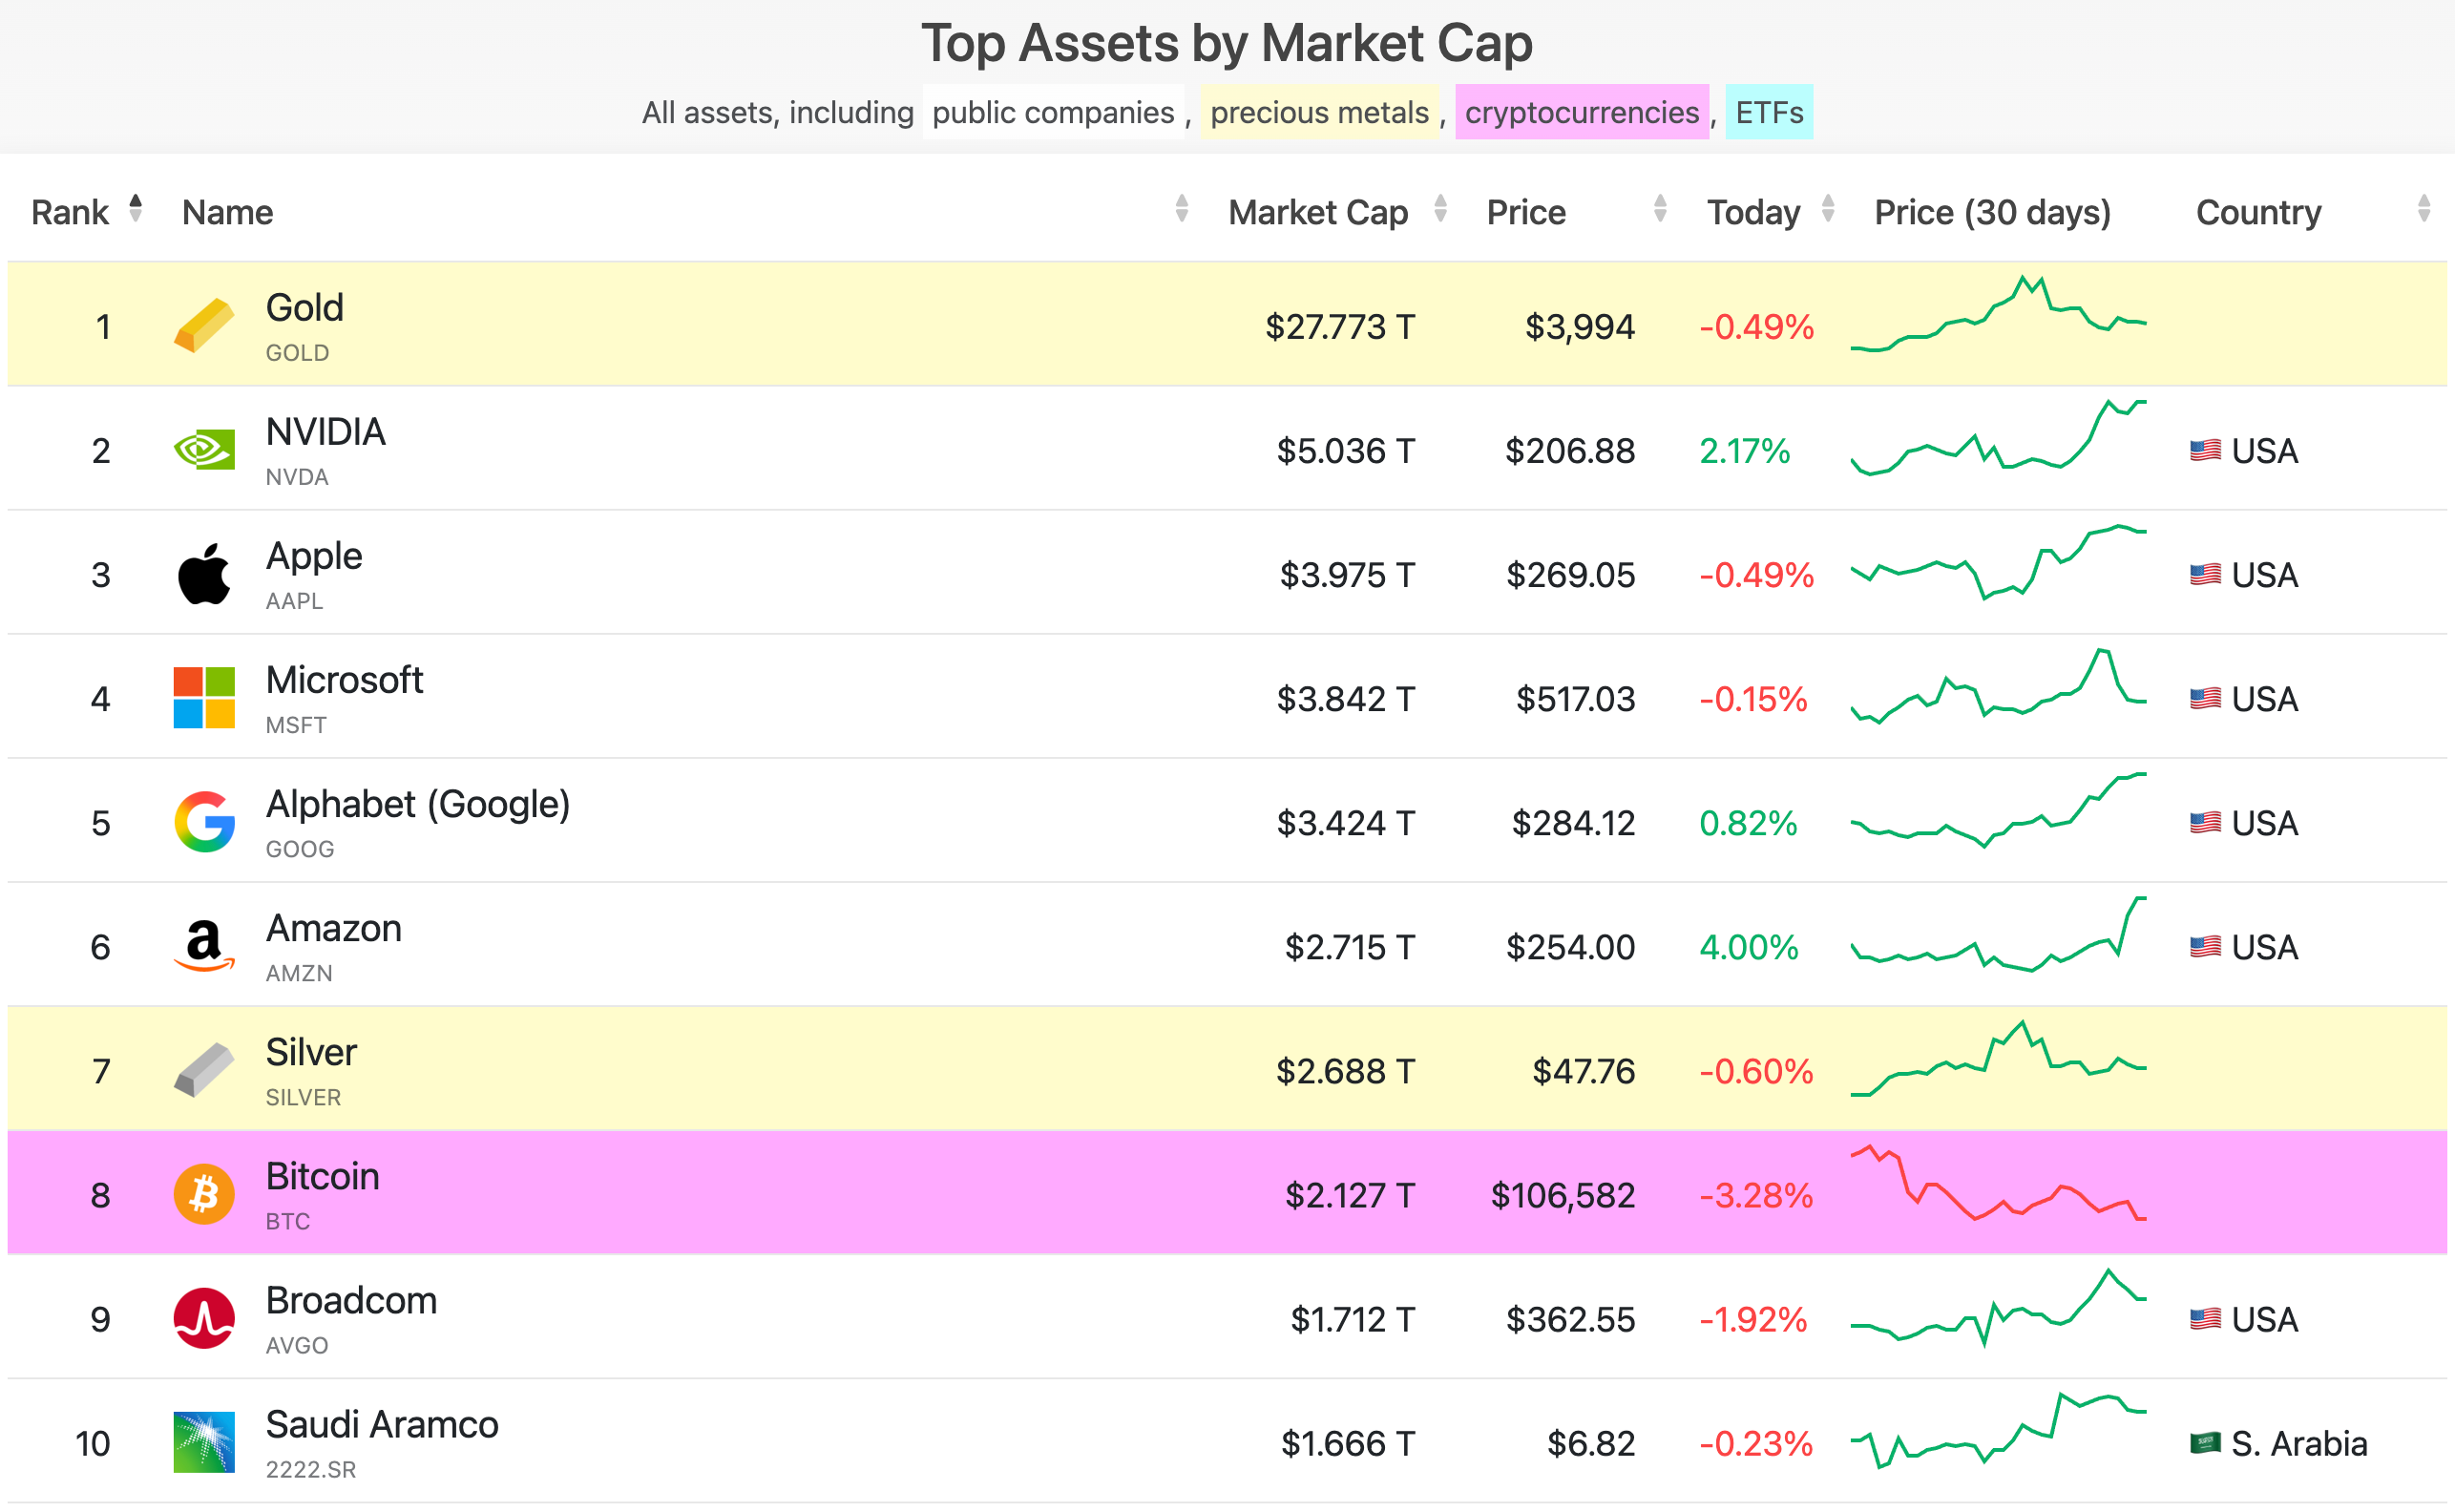
As of November 3, 2025, Bitcoin’s market capitalization stands at approximately $2.127 trillion, placing it at #8 among the world’s largest assets. This marks a slight pullback from last month’s $2.505 trillion valuation, where Bitcoin briefly climbed to the #7 spot above Silver and Amazon.
The recent dip reflects a period of consolidation following months of strong performance across sound money assets like gold, silver, and Bitcoin. With Bitcoin now trading around $106,582, its market cap remains firmly above the $2 trillion threshold — a level that continues to act as a psychological and structural foundation in this cycle.
Despite the ranking shift, Bitcoin’s long-term dominance and resilience remain clear. The asset’s ability to sustain a trillion-dollar valuation through both macro tightening and price corrections underscores its maturity as a global store of value. Gold continues to lead at $27.7T, but Bitcoin’s presence among the top ten reaffirms its place as the leading digital counterpart in the broader store-of-value landscape.
As traditional equities like NVIDIA and Apple jockey for short-term leadership, Bitcoin’s cyclical rhythm persists — building quietly through consolidation phases before its next expansion. For now, holding above this $2T base keeps Bitcoin well-positioned for strength into the next phase of the cycle.
Bitcoin News
Highlights from the month of October
Morgan Stanley Advises Up to 4% Bitcoin Allocation in Portfolios
Morgan Stanley Opens Bitcoin And Crypto Fund Access to All Wealth Clients
Trump Pardons Binance Founder Changpeng Zhao
JPMorgan to Accept Bitcoin as Loan Collateral by YearEnd
Steak ’n Shake Launches First-Ever Strategic Bitcoin Reserve
TL;DR
Bitcoin remains in a strong mid-cycle consolidation, trading between $106K and $125K after a controlled pullback from its highs. The 8 EMA and 34 EMA continue to act as dynamic support, confirming structural strength within the broader bullish trend. Momentum is compressing, but all signals point to reaccumulation rather than distribution — a setup that historically precedes expansion. A confirmed breakout above $121K–$125K would likely target $135K–$150K, while holding above $106K keeps the macro trend firmly intact.
If you have any suggestions, feel free to reach out to me on X. I’m always looking to improve and add value in ways others might enjoy—just keep it Bitcoin only.
Live free and stack sats,
Will
“As the world is crashing, bitcoin keeps hashing.” - Lt. Col. Steve
What is A.W. Block?
We’re a Bitcoin consulting firm helping clients navigate the complexities of the digital asset world with clarity and confidence. Whether it’s recovering lost funds, developing a long-term Bitcoin accumulation strategy, or mastering market cycles through advanced charting education—we’re here to make your crypto journey seamless, secure, and strategic.
If you’re ready to level up your understanding, protect your wealth, or take control of your Bitcoin future, let’s talk.
awblock.io