

Around the Block | 9
Bitcoin‑Only Macro & Technical Recap for November 2025 — Published December 2, 2025

Another month closes, and Bitcoin shifts from controlled pullback into confirmed correction. The break of the 8 EMA, renewed volatility, and a deep test of the 90K–94K demand zone define the landscape, even as the macro trend holds firm above its higher-low structure. November delivered decisive downside follow-through from October’s rejection, a retreat in market cap below the two-trillion level, and rising miner pressure as production costs climbed above spot. Yet the network’s fundamentals remain unshaken: hashrate set fresh highs, miners continued expanding, and structural security strengthened despite price compression.
In this issue, we dissect Bitcoin’s monthly and weekly trend structure, analyze the renewed test of mid-cycle support, examine miner economics and hashrate resilience, and review Bitcoin’s positioning among the world’s top assets. As always, this is a Bitcoin-only publication with no noise, no distractions, and nothing off-topic.
None of this is financial advice.
Don’t trust, verify.
Let’s dive in.
TL;DR
Bitcoin confirmed a full monthly break of the 8 EMA, shifting the market from pullback to correction while the macro trend remains intact.
Price sits inside the key 90K–94K demand zone; losing this range exposes 76K, while holding it forms the foundation for multi-month consolidation.
Weekly candle shows clear demand absorption with a strong lower wick, signaling seller exhaustion rather than trend failure.
Hashrate hit a new high and continues rising despite price pressure, reflecting strong miner conviction and network strength.
Mining cost now exceeds spot by a wide margin, tightening miner margins but showing no signs of capitulation.
Bitcoin’s market cap retraced to $1.83T but remains firmly in the global top ten as part of a normal mid-cycle consolidation.
The Technicals
Monthly
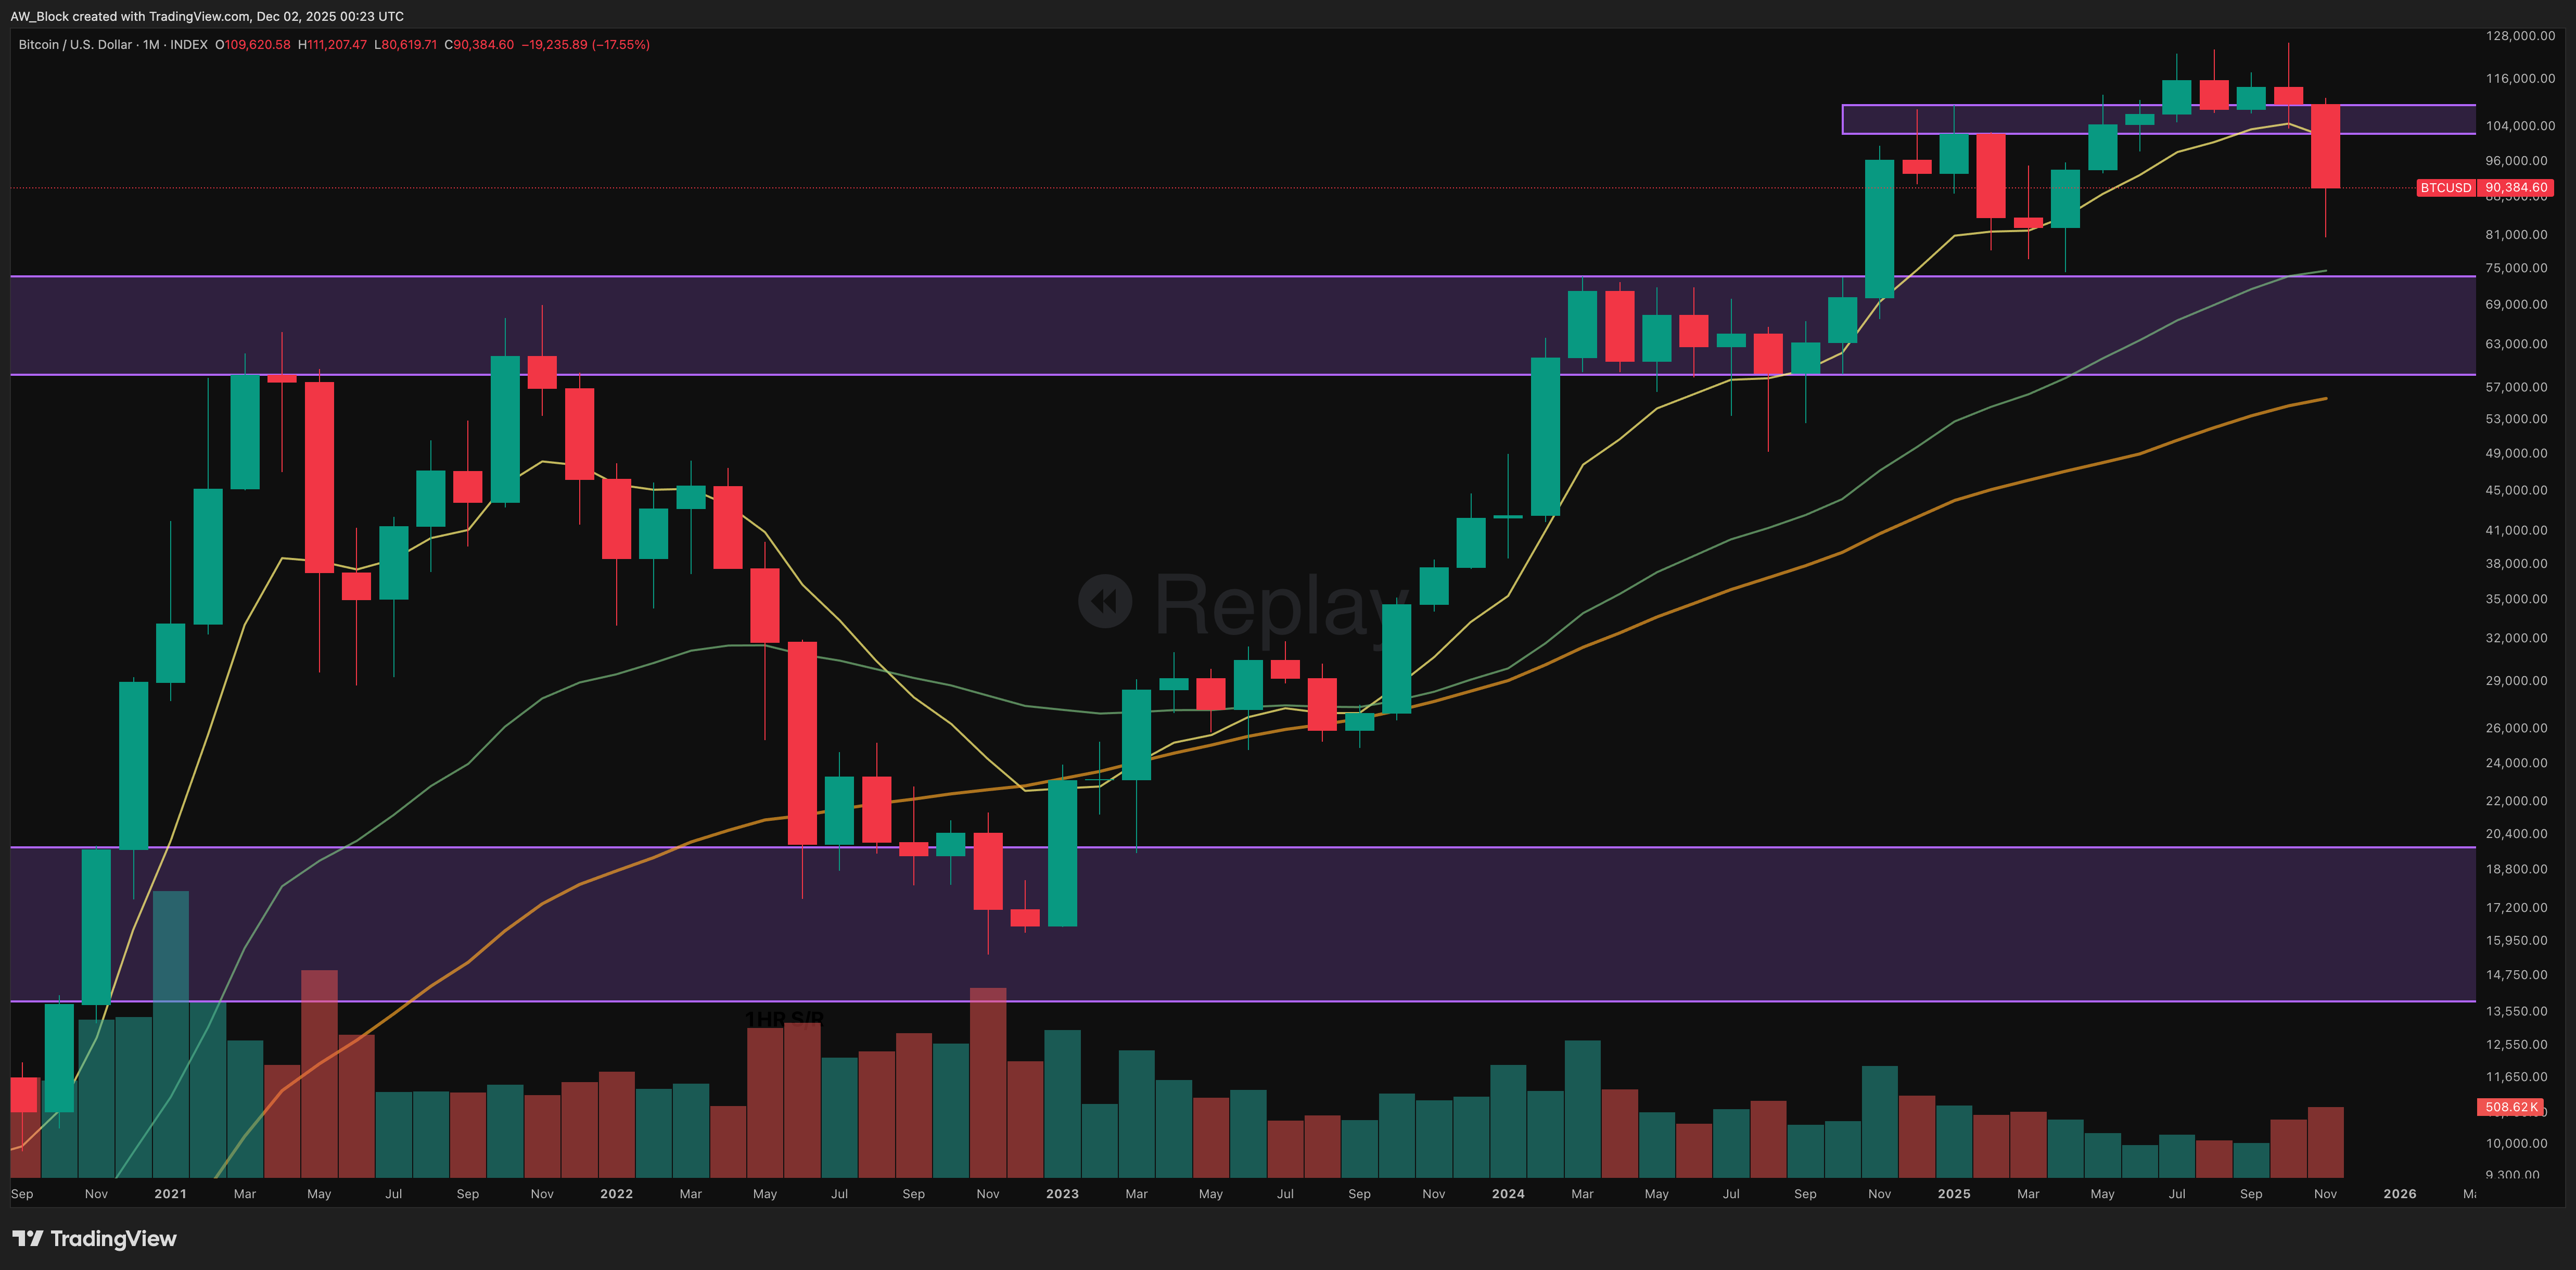
Close: 90,384.60
Open: 109,620.58
High: 111,207.47
Low: 80,619.71
Key Levels
M Upper S/R: ≈125K. Confirmed rejection.
M Mid S/R: 102K–110K. Lost. Now resistance.
M Lower S/R: 59K–74K. Primary demand.
8 EMA: 101,607. First decisive monthly loss since 2023.
34 EMA: 74,714. Rising mid-trend equilibrium.
50 MA: 55,667. Stable macro anchor.
Structure and S/R Zones
November produced a full-bodied bearish continuation candle, validating October’s supply rejection and completing the transition from a controlled pullback to a confirmed correction. Price slipped through the 107K–110K mid-zone and settled inside the 91K–94K demand block.
This is a textbook polarity shift per Schabacker:
Support at 102K–110K is now resistance.
Demand at ≈82K is now the active stabilizing zone.
Macro trend remains structurally intact because higher lows across the full cycle remain unbroken. The short-term structure, however, is no longer a mild reversion. It is an established correction.
Candlestick Analysis
October printed a rejection candle.
November printed the follow-through: a large bearish body, minimal lower shadow, and decisive momentum.
The two-month sequence communicates a clean shift from equilibrium to correction pressure. This is not capitulatory behavior. It is controlled selling triggered by the break of the 8 EMA.
Trend and Moving Averages
8 EMA broken. Confirms correction.
34 EMA rising. Holds mid-trend structure.
50 MA rising. Long-term trend intact.
The monthly loss of the 8 EMA confirms the shift from impulse to correction. Neither the 34 EMA nor the 50 MA suggests macro reversal. This is mid-cycle cooling.
Volume Behavior
Volume expanded relative to October’s contraction. This validates the breakdown’s legitimacy. Distribution remains controlled rather than emotional. No capitulation signature is present.
Psychological Context
Breaking a long-respected EMA produces an overreaction in sentiment. Fear is elevated, but pattern behavior remains orderly. Douglas context: the market is delivering a functional correction rather than a structural end. The emotional reading is disproportionate to the actual technical damage.
“The market gives you what you need, not what you want.” — Mark Douglas
A disciplined mindset acknowledges the correction without projecting future collapse.
Outlook
Bullish Continuation
Low probability short-term. Reclaiming 107K–110K resets momentum and points back to 121K–125K.
Neutral Range
Primary scenario. Holding 91K–94K produces a multi-month rectangle between 91K and 110K.
Bearish Continuation
Triggered by a monthly close under 91K. Target region aligns with 76K and the rising 34 EMA.
Monthly Assessment
The month confirms a clean break of the 8 EMA and converts October’s rejection into a defined correction. Bitcoin may face its most consequential support ≈74K toward the mid-trend 34 EMA in an orderly continuation of the corrective phase.. Hold this range and the macro uptrend remains unchanged.
Weekly
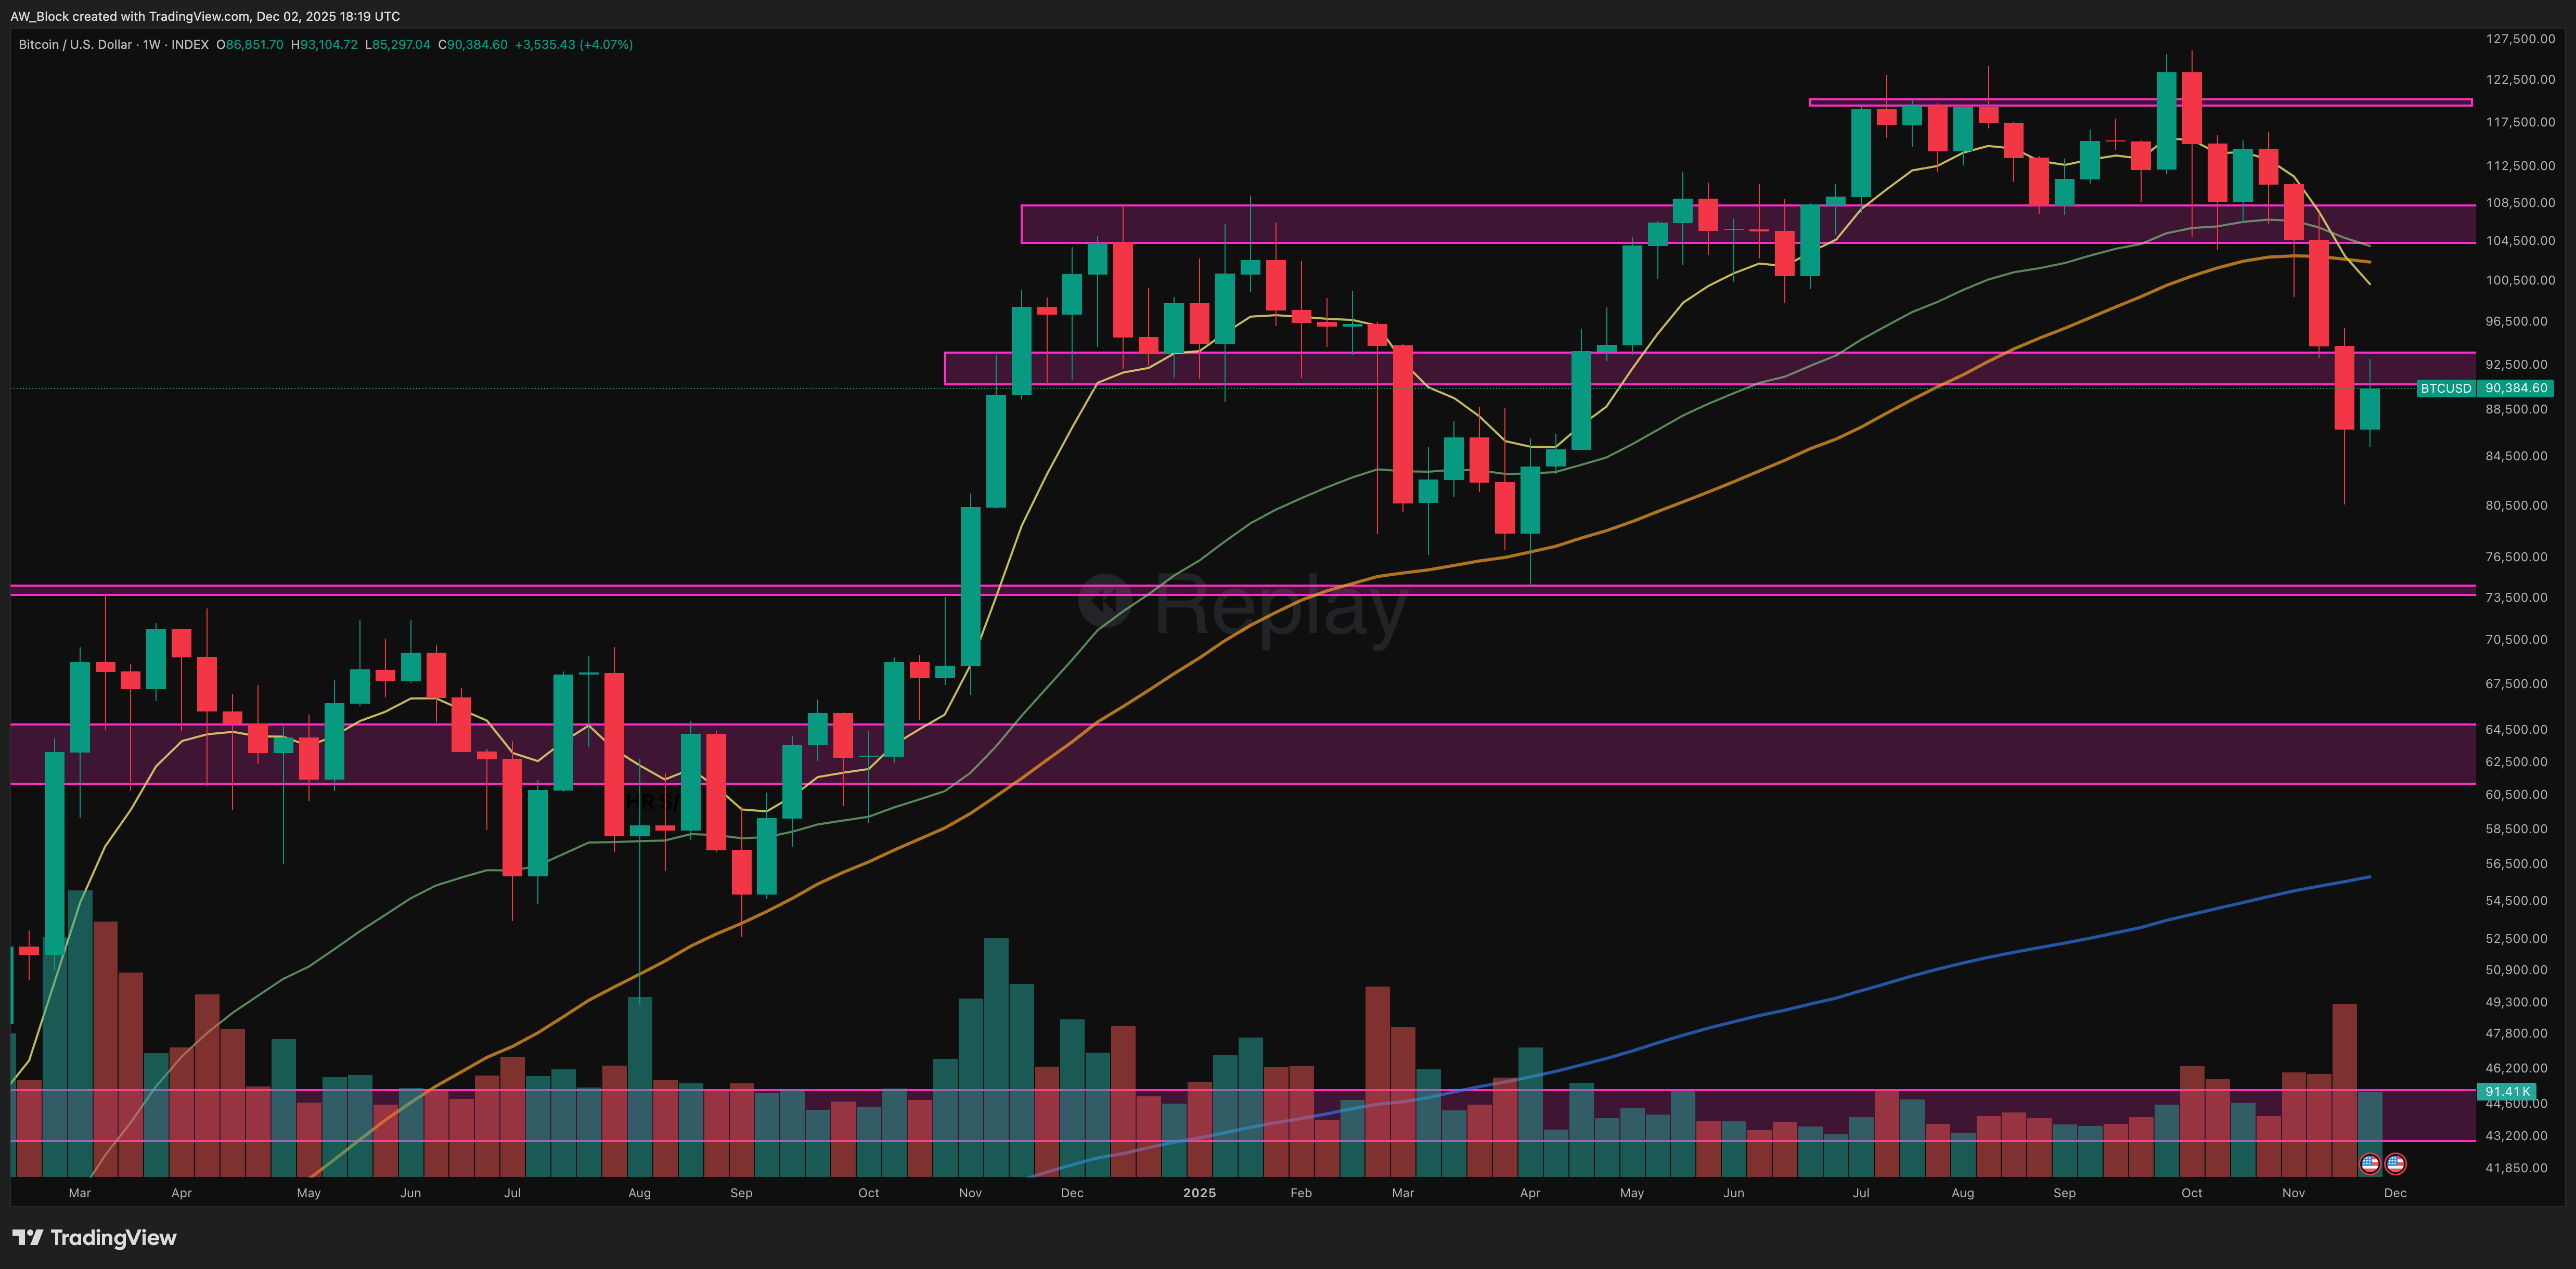
Open: 86,851.70
High: 93,104.72
Low: 85,297.04
Close: 90,384.60
Volume: 91.41K
Key Levels
W S/R 121K–125K. Cycle rejection.
W S/R 104K–108K. Firm resistance after breakdown.
W S/R 90K–94K. Active battleground.
W S/R 73K–75K. Macro higher-low.
8 EMA: 100,202K
34 EMA: 104,042K
50 MA: 102,416K
200 MA: 55,839
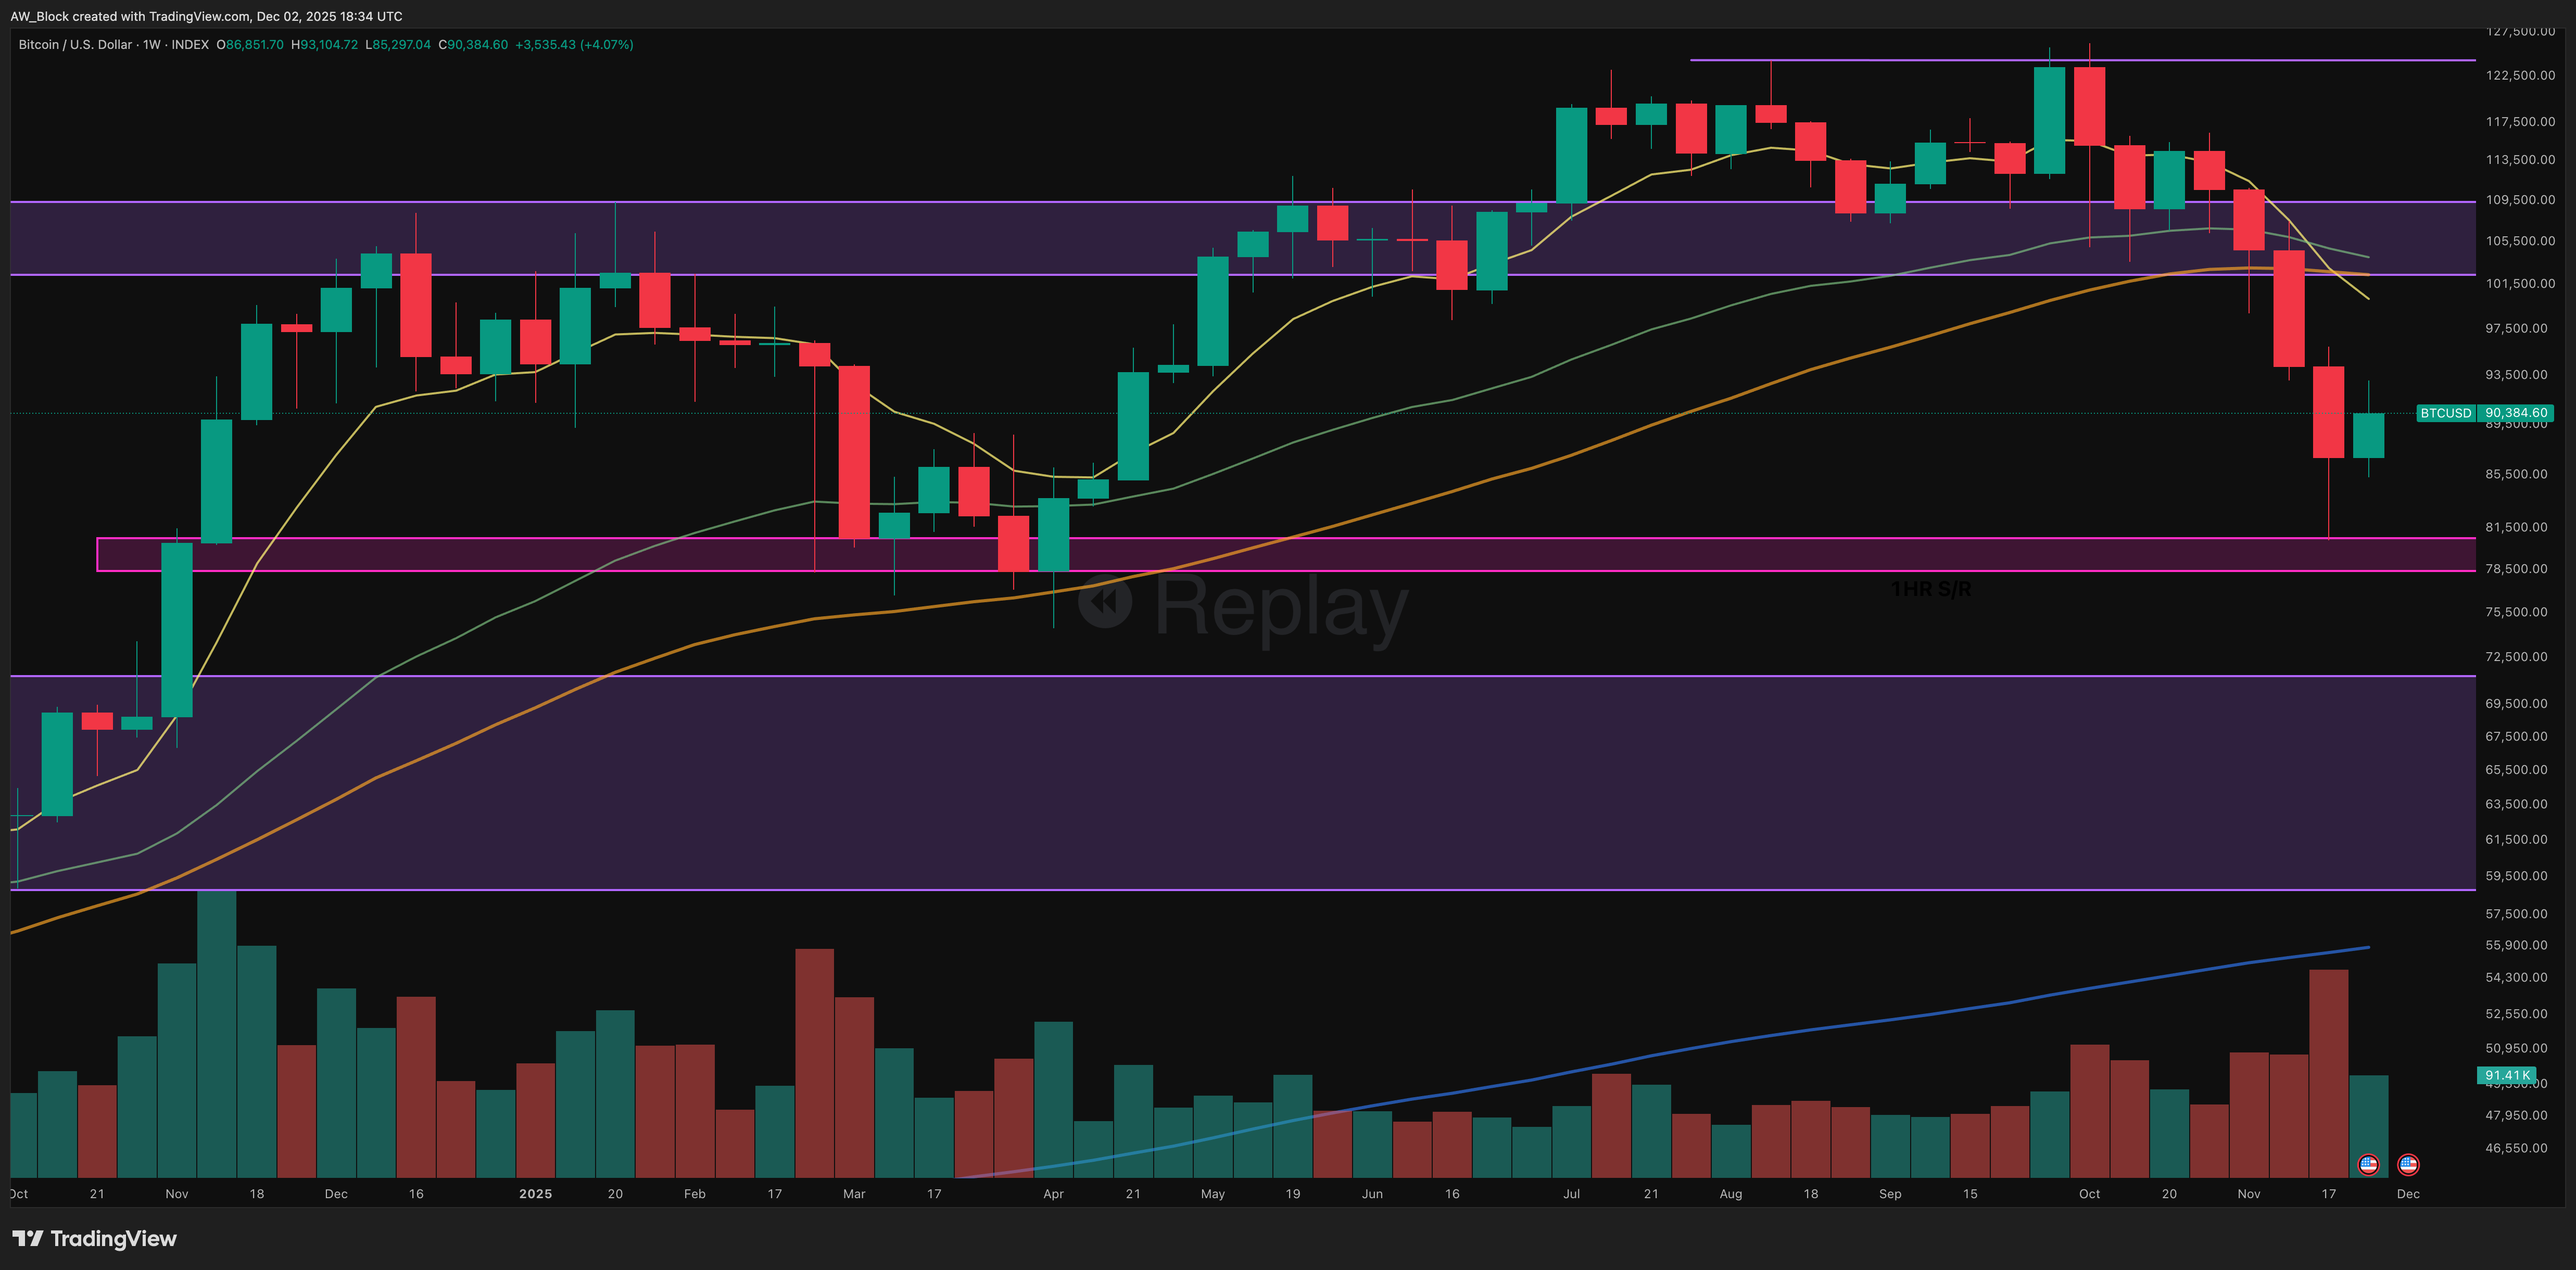
Structure and S/R Zones
Bitcoin’s corrective sequence extends into the current week as price trades fully inside the 90K–94K weekly demand block. The breakdown from 104K–108K remains unreclaimed, confirming mid-trend damage but not macro reversal. The macro higher-low structure at 73K remains untouched.
The weekly range expanded sharply — 85.29K to 93.10K — showing volatility expansion following the initial breakdown. Despite that volatility, the weekly close above 90K demonstrates firm defense of the demand area. Stabilization, not cascade, is the current read.
Candlestick Analysis
The weekly candle presents as a rejection-type structure per Nison:
Large real body.
Extended lower shadow.
Close in the upper half of the range.
This is a classic test-and-reject bar. Sellers drove deeply into support early in the week, but buyers absorbed the pressure and forced a recovery close.
Not a hammer, not a spinning top — a rejection candle.
Key implications:
Deep intraday selling was absorbed.
Demand surfaced beneath 90K.
No capitulation signature is present.
Nison’s principle applies: heavy probing into support followed by a recovery close signals hidden bid strength.
Pattern Structure
The failure of the 106K–125K rectangle has now fully unwound into its expected retracement zone. Bulkowski’s historical range for such failures is 10–25 percent; bitcoin’s drop matches that behavior.
Schabacker: this remains a secondary reaction inside a primary uptrend.
A developing descending channel beneath 100K is now visible. In uptrends, this structure resolves upward more than half the time once selling pressure exhausts.
Trend and Moving Averages
8 EMA at 100.2K — immediate dynamic resistance.
34 EMA at 104.0K — declining; mid-trend resistance.
50 MA at 102.4K — untested; primary structural guide.
200 MA at 55.8K — distant, confirming the intact macro cycle.
The averages remain bullishly stacked despite flattening. Distance between price and the moving-average cluster indicates a volatility overshoot rather than trend termination.
Volume Behavior
Volume remains elevated relative to the prior consolidation but is declining from the breakdown peak. The long lower wick on declining volume signals early supply exhaustion. Buyer absorption around 90K–92K is now measurable. A second week of contracted volume above 90K would mark early accumulation.
Psychological Context
The mid-zone breakdown triggered emotional selling, but structural damage is limited. Douglas’ lens applies: this is a probabilistic test of support, not a structural failure.
Professionals evaluate pivots and absorption. Retail reacts to emotion and recency.
Until 73K breaks, the bull cycle remains structurally intact.
Outlook
Bullish Continuation
Low probability short-term. Reclaiming 100K–104K (8 EMA and 34 EMA cluster) resets weekly momentum and opens a move back toward 106K–110K.
Neutral Range
Primary scenario. Holding 90K–94K produces a multi-week consolidation base beneath 100K, allowing structure to stabilize before any trend resumption.
Bearish Continuation
Triggered by a weekly close under 89K. Target region aligns with 73K–75K, consistent with the descending channel’s lower boundary and the macro higher-low zone.
Weekly Assessment
Bitcoin remains inside a multi-week corrective phase. The long lower wick, volume contraction, and volatility overshoot all reflect seller fatigue rather than macro breakdown. The 90K–94K region remains the fulcrum of the weekly structure. As long as it holds, this phase is characteristic of base formation, not cycle termination.
Bitcoin / Gold
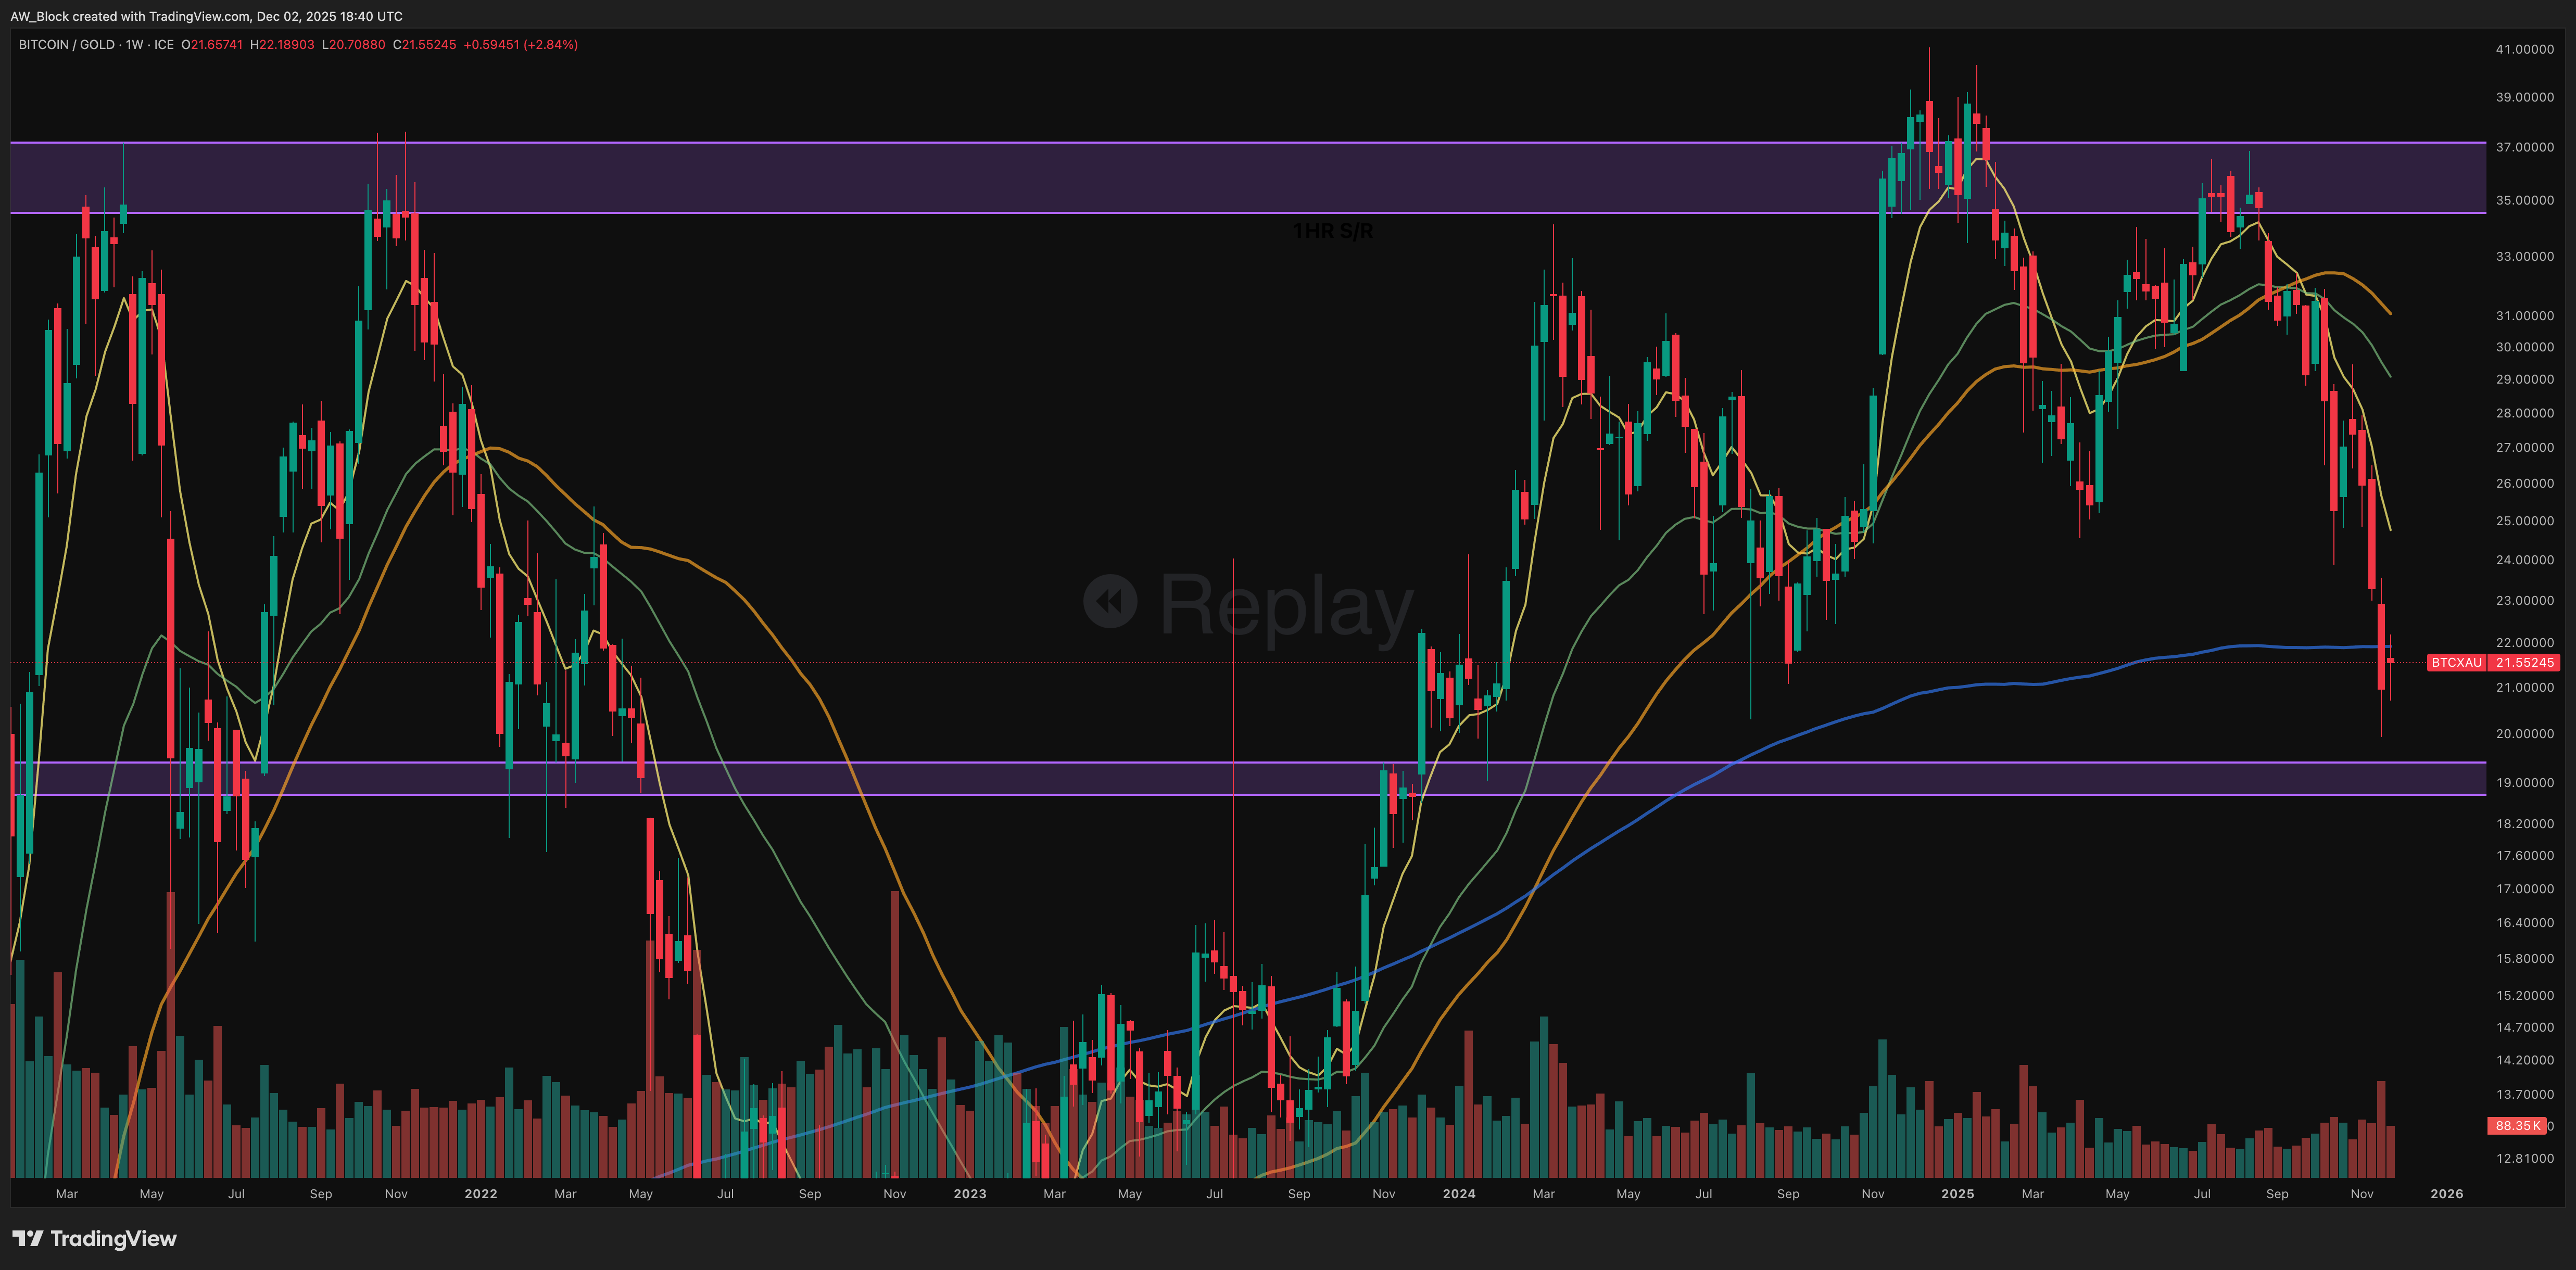
BTC/XAU has broken its multi-quarter range and is now testing its long-term structural floor at the 200 MA. Momentum remains sharply negative, and bulls have not yet defended the level with any recognizable candlestick reversal. Structure holds only as long as 18–20 remains intact. Without stabilization, the trend bias remains downward.
The Fundamentals
Hashrate
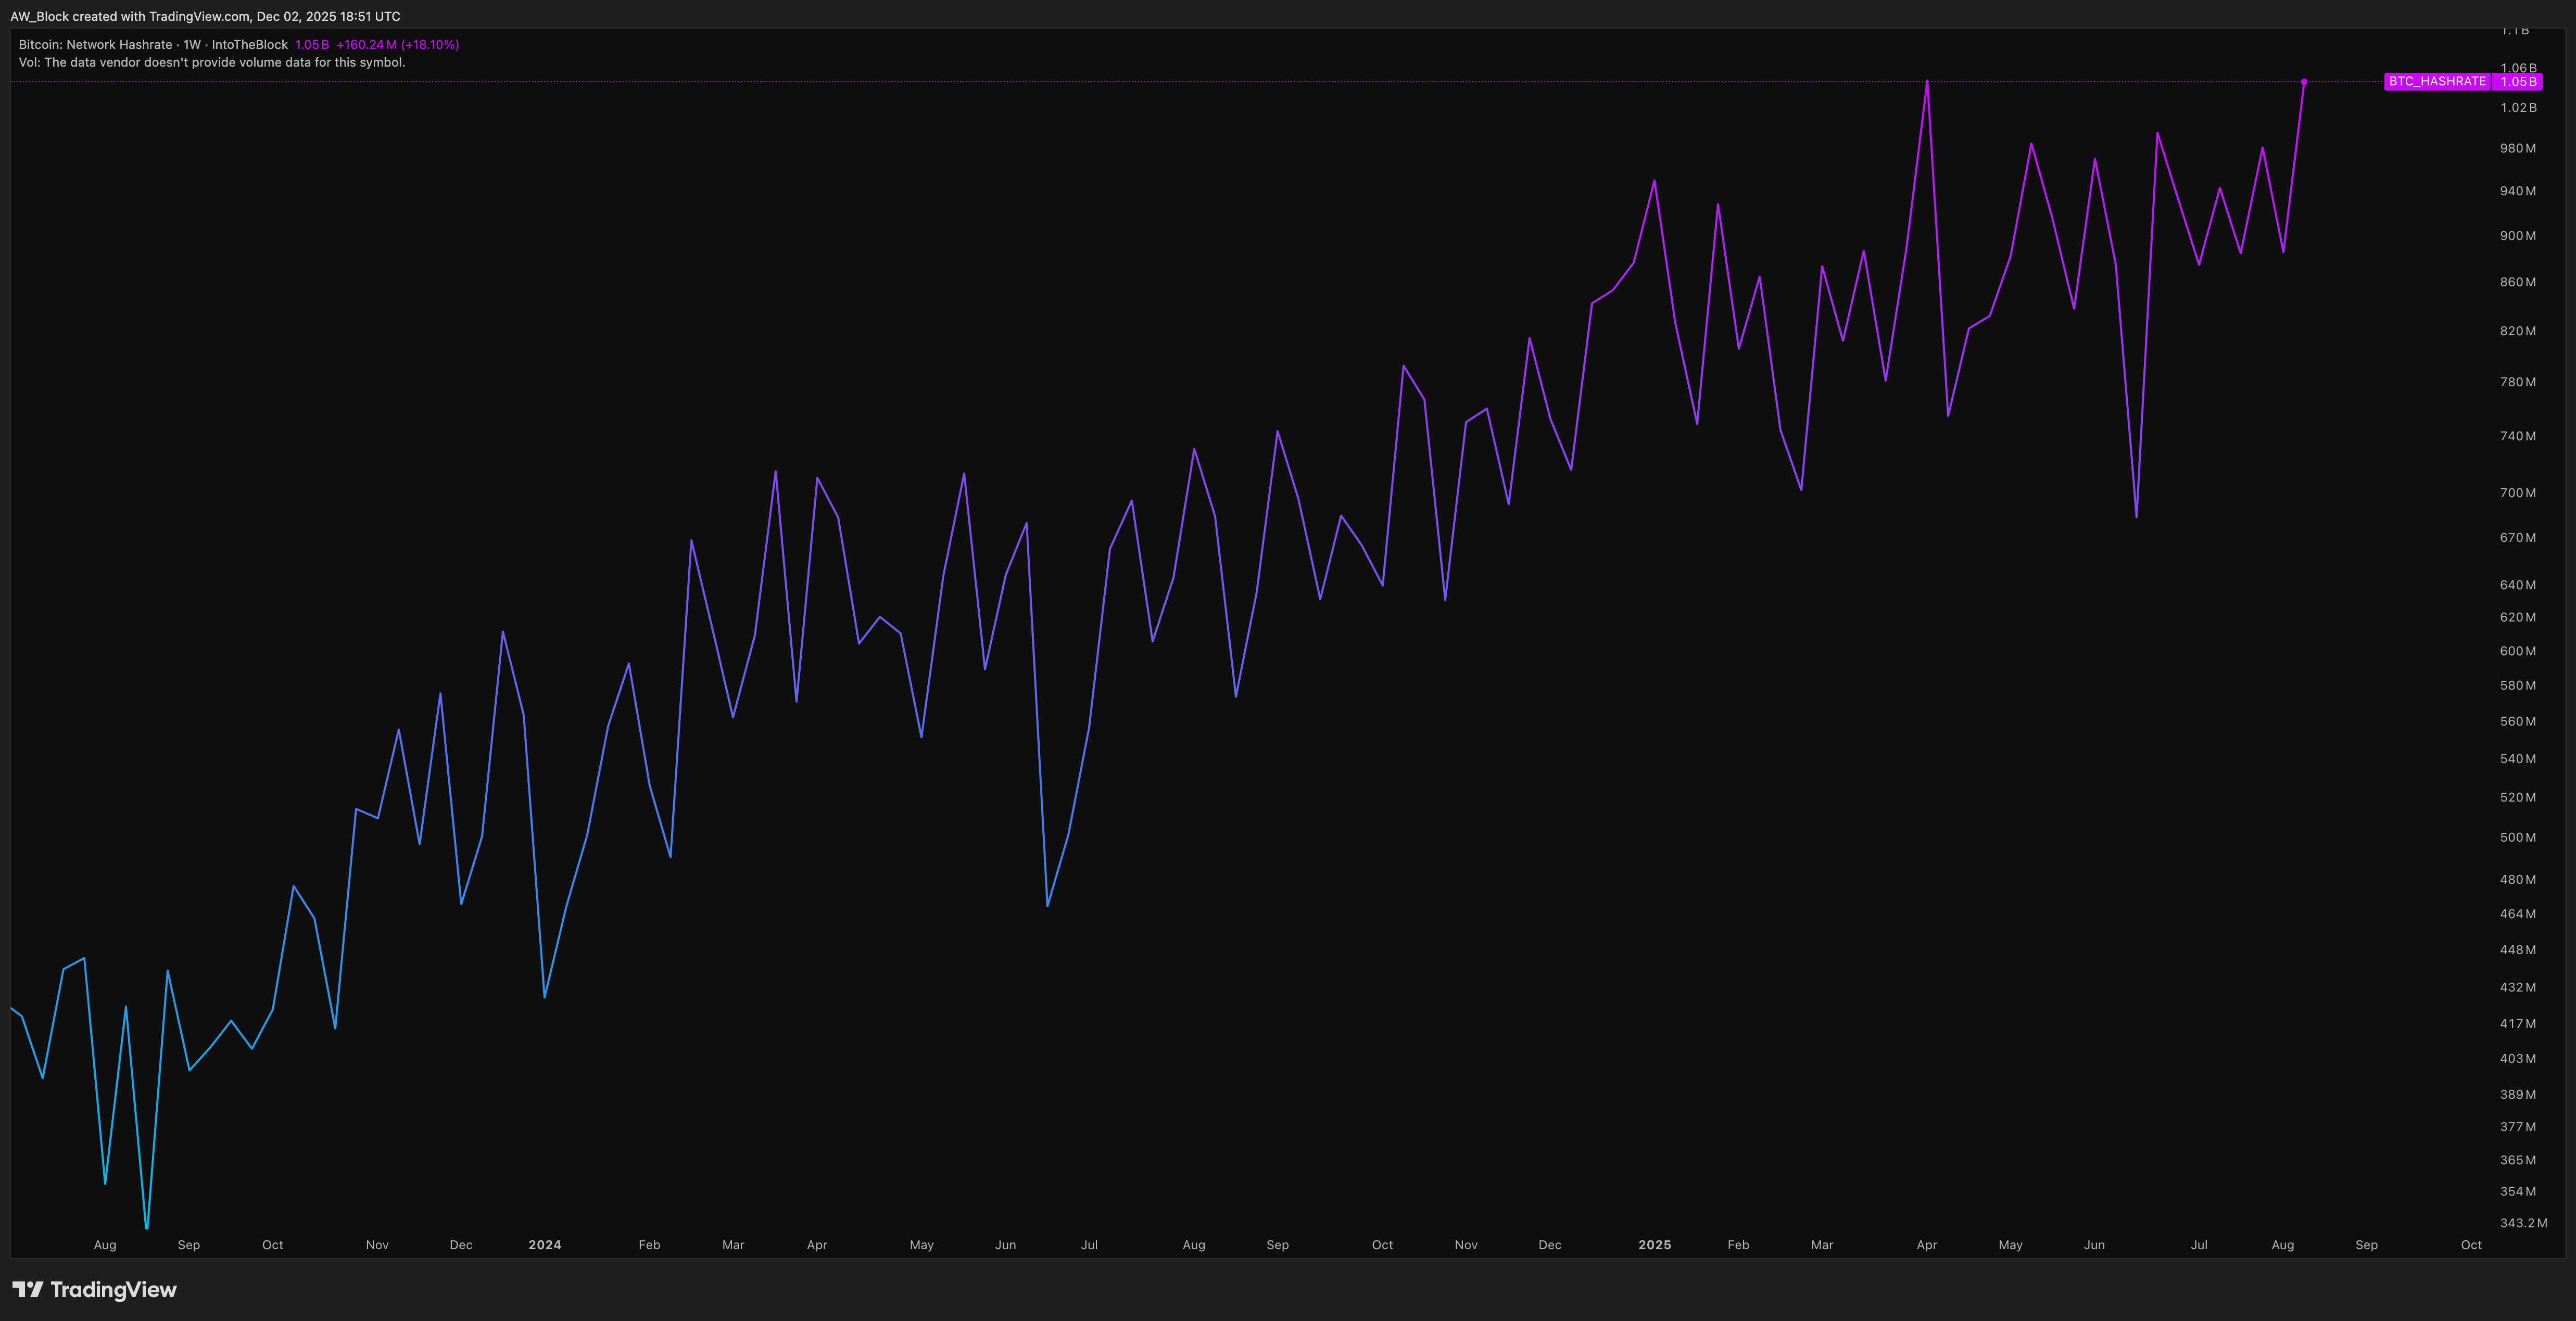
Bitcoin’s network hashrate has climbed back to 1.05 billion TH/s, marking a 1.8% increase from last month and continuing its steady rise after a brief period of leveling off in late October. The trend of higher lows remains firmly intact, showcasing ongoing miner conviction and investment despite tightening margins across the network.
This continued growth during a period of price retracement highlights a familiar mid-cycle behavior where miners strengthen operations even as spot markets consolidate. Energy-efficient mining setups and large-scale infrastructure expansions, particularly from regions utilizing hydro and flare gas, continue to contribute to Bitcoin’s expanding security base.
Hashrate growth of this nature reinforces the protocol’s resilience. Each incremental increase in computational power raises network security, reduces vulnerability, and underscores long-term confidence from miners who are clearly building for the next leg of the cycle rather than reacting to short-term price swings.
In short, the network remains in excellent health. Miner conviction is strong, capital deployment is steady, and the hashrate is once again leading price—just as it has in every prior cycle.
“Hashrate follows belief, and belief is still climbing.”
Average Mining Cost
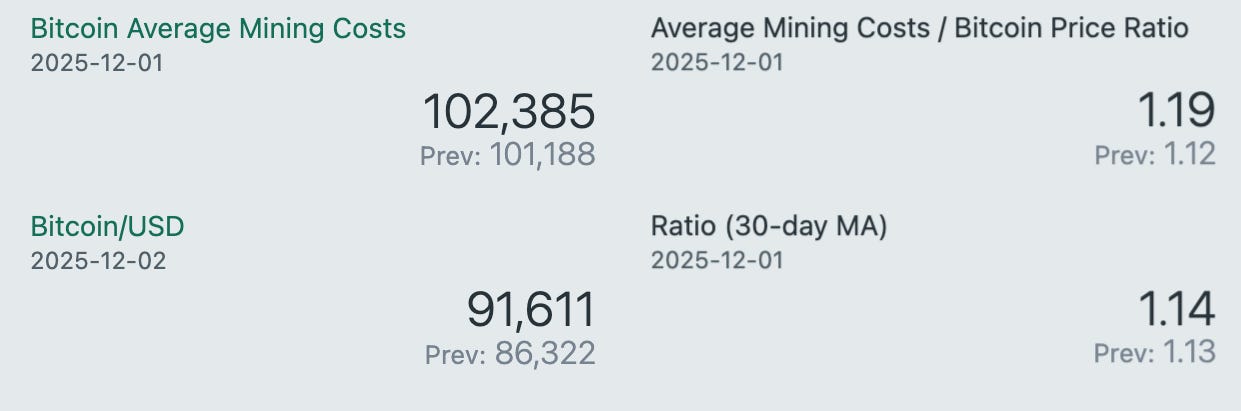
As of December 1, 2025, the average cost to mine one Bitcoin is estimated at $102,385, a meaningful decrease from last month’s $113,676. With Bitcoin currently trading around $91,611 (as of December 2), the mining cost-to-price ratio has risen sharply to 1.19, compared to 1.03 in early November. The 30-day moving average of the ratio now sits at 1.14, up from 0.97 last month.
This shift marks a notable change from the prior report. While November’s data showed mining cost only slightly exceeding spot price, December now reflects a much wider gap, with production cost running well above market value. This indicates a more pronounced period of miner margin compression. When the spot price sits meaningfully below average production cost, higher-cost miners face elevated financial strain, while more efficient operators tend to consolidate share and strengthen competitive positioning.
The decline in average mining cost suggests some easing of operational inputs, likely tied to recent difficulty adjustments and incremental efficiency improvements across the network. However, because price fell at a faster rate than cost, miners overall are now operating under tighter conditions despite the lower cost baseline.
Despite this compression, there are still no visible signs of miner capitulation. Hash rate remains near cycle highs, block production is stable, and total network hashrate has not meaningfully rolled over. This aligns with prior-cycle behavior, where miners typically endure below-equilibrium periods without immediate retreat, especially when long-term expectations remain bullish.
Historically, stretches where Bitcoin trades below average production cost often mark cyclical equilibrium zones rather than structural stress events. As long as BTC remains within this band, miner resilience and network confidence tend to hold, and these periods often precede stronger longer-term supply dynamics once price and cost realign.
Top Assets By Market Cap
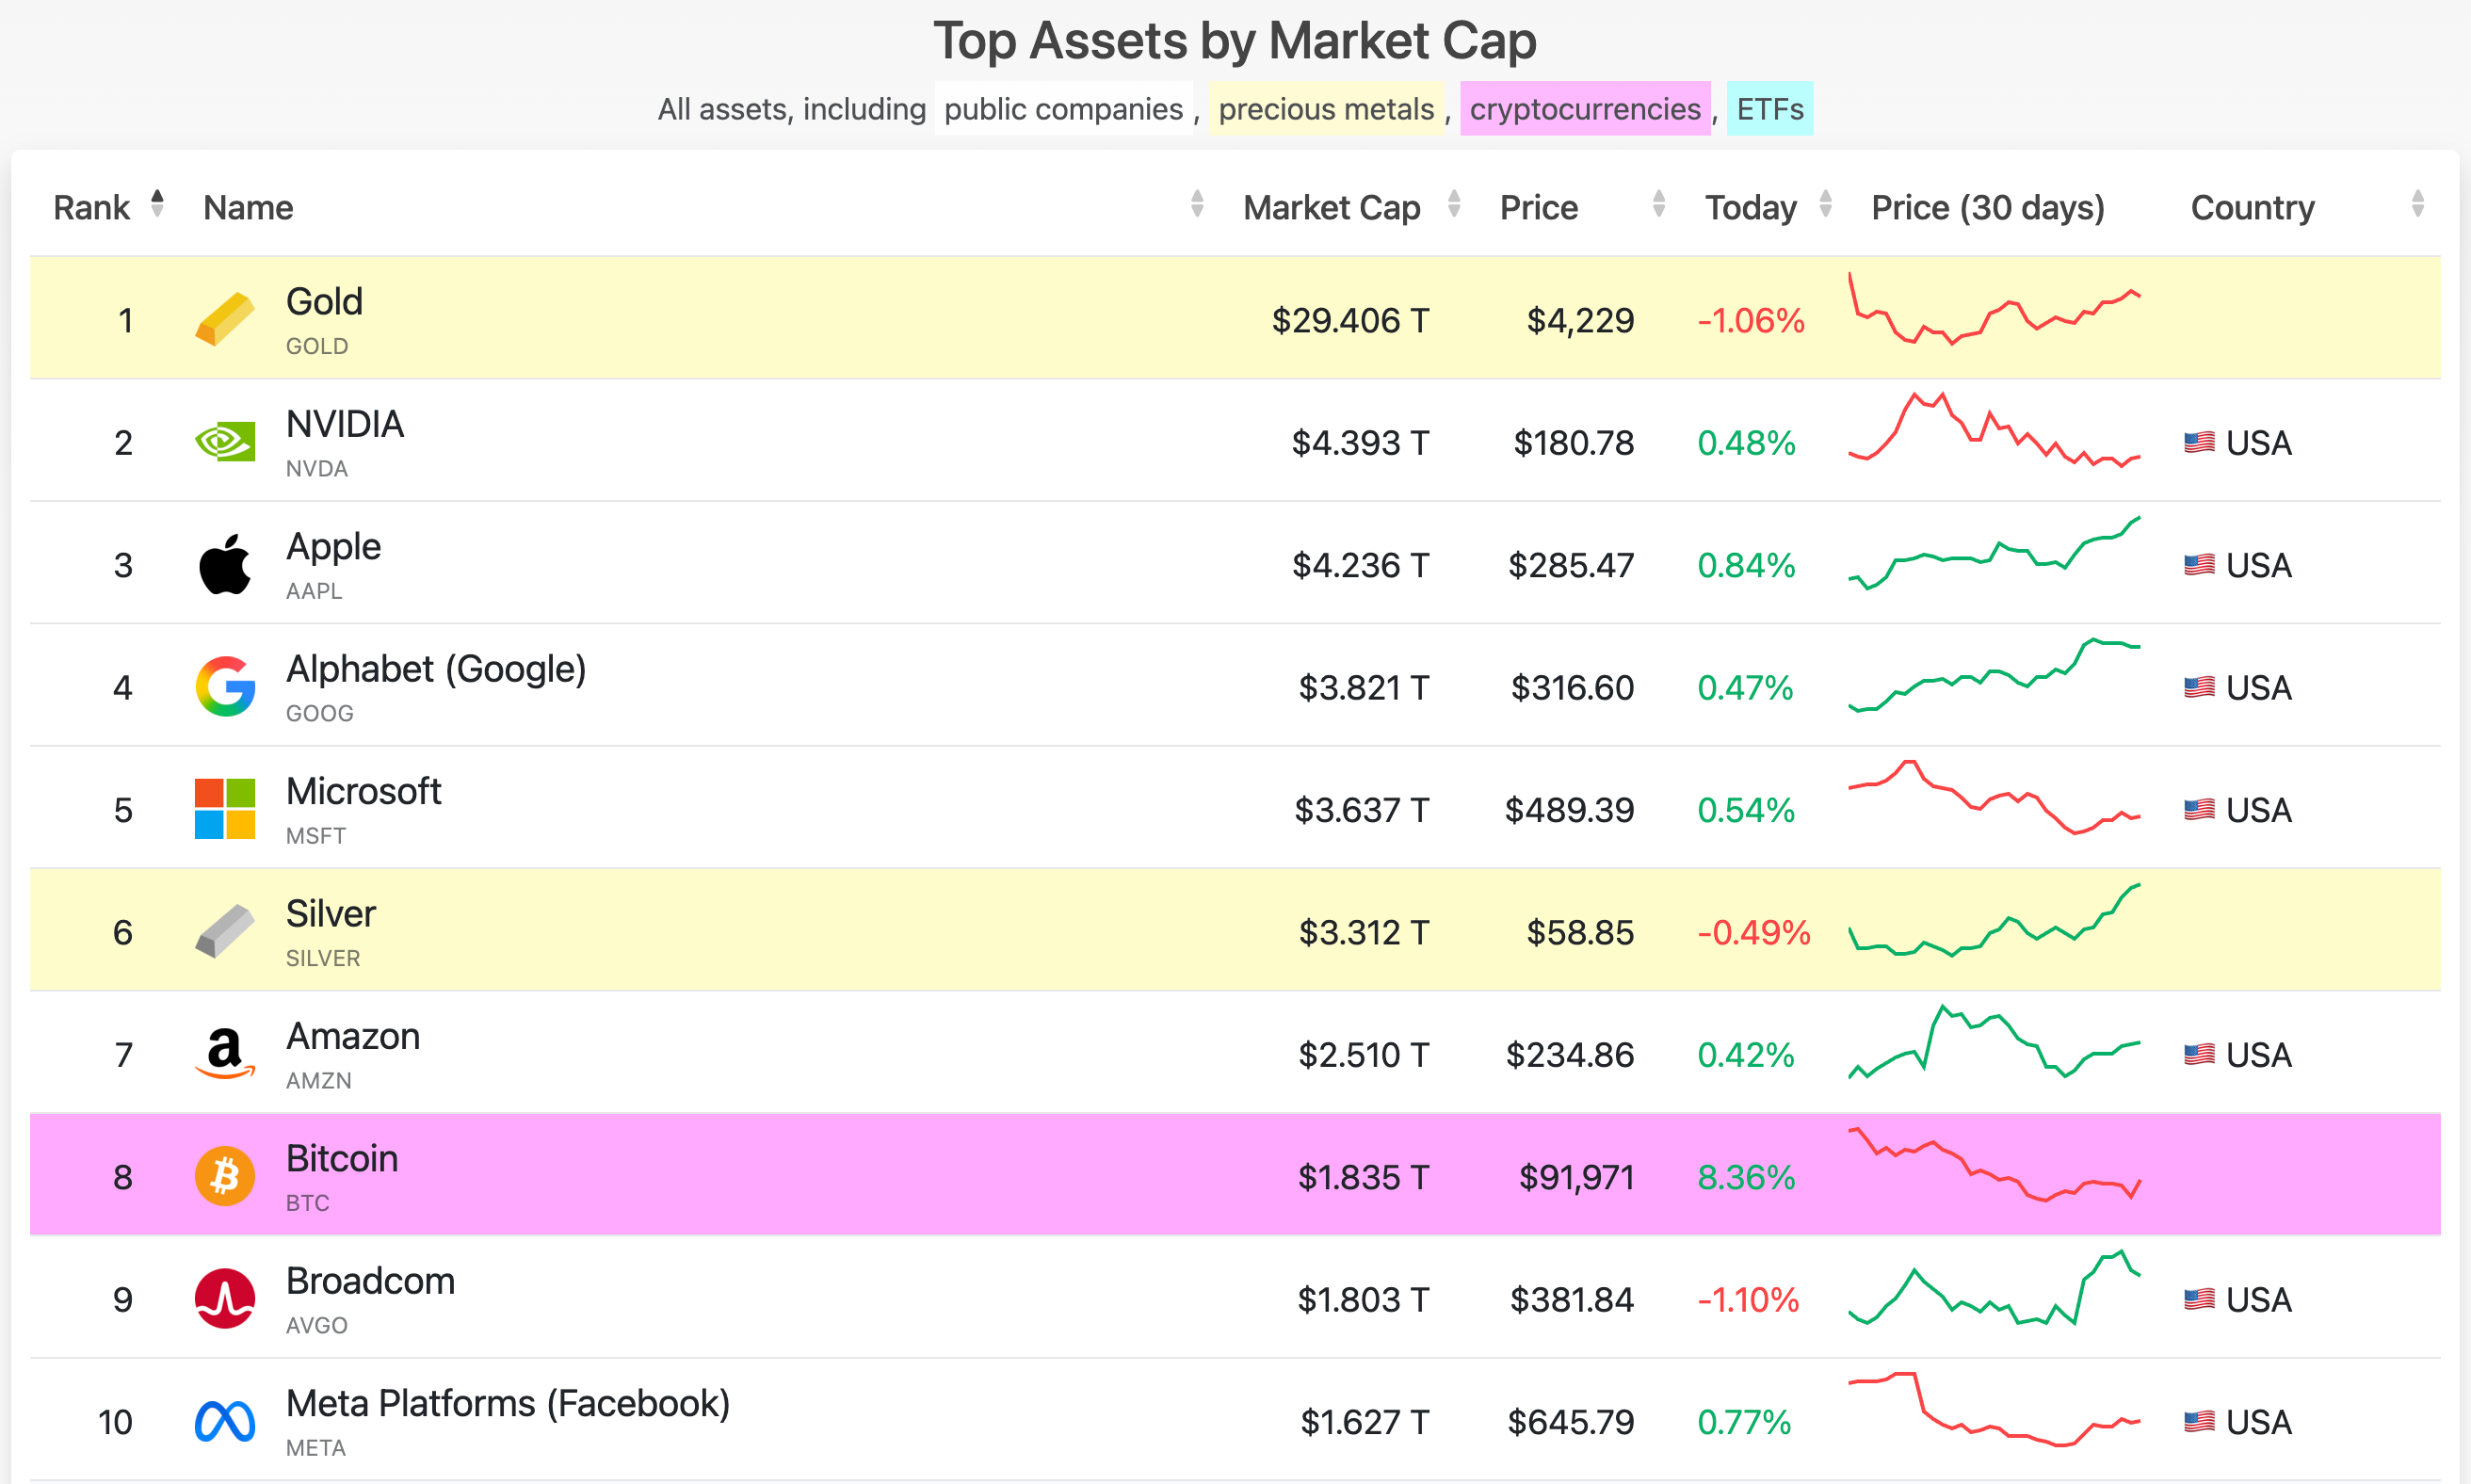
As of December 3, 2025, Bitcoin’s market capitalization stands at approximately $1.835 trillion, placing it at #8 among the world’s largest assets. This reflects a continued pullback from last month’s $2.127 trillion valuation, when Bitcoin briefly challenged the #7 position above Silver and Amazon. Now sitting below both, BTC has returned to the lower half of the top ten.
The drawdown mirrors the broader consolidation across sound money assets such as gold, silver, and Bitcoin. With Bitcoin now trading around $91,971, market cap has dipped below the $2 trillion level, a threshold that served as a psychological floor throughout much of the past year. Even with the decline, Bitcoin maintains a presence inside the global top ten, which continues to reinforce its legitimacy as a tier-one macro asset.
Silver now holds the #6 position with a market cap of $3.312 trillion, while Amazon sits above Bitcoin at $2.510 trillion. Gold remains the undisputed leader in the store-of-value category, climbing to $29.406 trillion, while equities such as NVIDIA, Apple, and Microsoft continue to dominate the upper ranks despite their own volatility.
The rotation lower for Bitcoin reflects the natural rhythm of a mid-cycle consolidation. Periods like this are not unusual, particularly after strong multi-month performance. While legacy assets such as NVIDIA and Apple are experiencing short-term strength, Bitcoin continues to operate along its own cyclical pathway, building energy within a deeper retracement phase before its next expansion.
Bitcoin’s ability to remain inside the top ten during corrective periods highlights both its resilience and its structural maturity. Holding a trillion-dollar valuation through macro tightening, shifting liquidity conditions, and ongoing volatility demonstrates the asset’s staying power as a global store of value. As long as Bitcoin maintains its current footing, it remains well positioned for the next leg of its cycle once market conditions stabilize.
Bitcoin News
Highlights from the month of November
Steak ’n Shake Launches First-Ever Strategic Bitcoin Reserve
Square Bitcoin Payments Go Live Today, Bringing Bitcoin to Millions of Merchants
Harvard Triples Bitcoin ETF Stake, Makes It Largest Public Holding
Texas Becomes First U.S. State to Buy $5M of BlackRock’s Spot Bitcoin ETF
If you have any suggestions, feel free to reach out to me on X. I’m always looking to improve and add value in ways others might enjoy—just keep it Bitcoin only.
Live free and stack sats,
Will
“Only Bitcoin is the disruptor.” — David Bennett
What is A.W. Block?
We’re a Bitcoin consulting firm helping clients navigate the complexities of the digital asset world with clarity and confidence. Whether it’s recovering lost funds, developing a long-term Bitcoin accumulation strategy, or mastering market cycles through advanced charting education—we’re here to make your crypto journey seamless, secure, and strategic.
If you’re ready to level up your understanding, protect your wealth, or take control of your Bitcoin future, let’s talk.
awblock.io